Zip Codes with the Highest Percentage of Population Employed in Accommodation & Food Services in Compton, CA
RELATED REPORTS & OPTIONS
Accommodation & Food Services
Compton
Compare Zip Codes
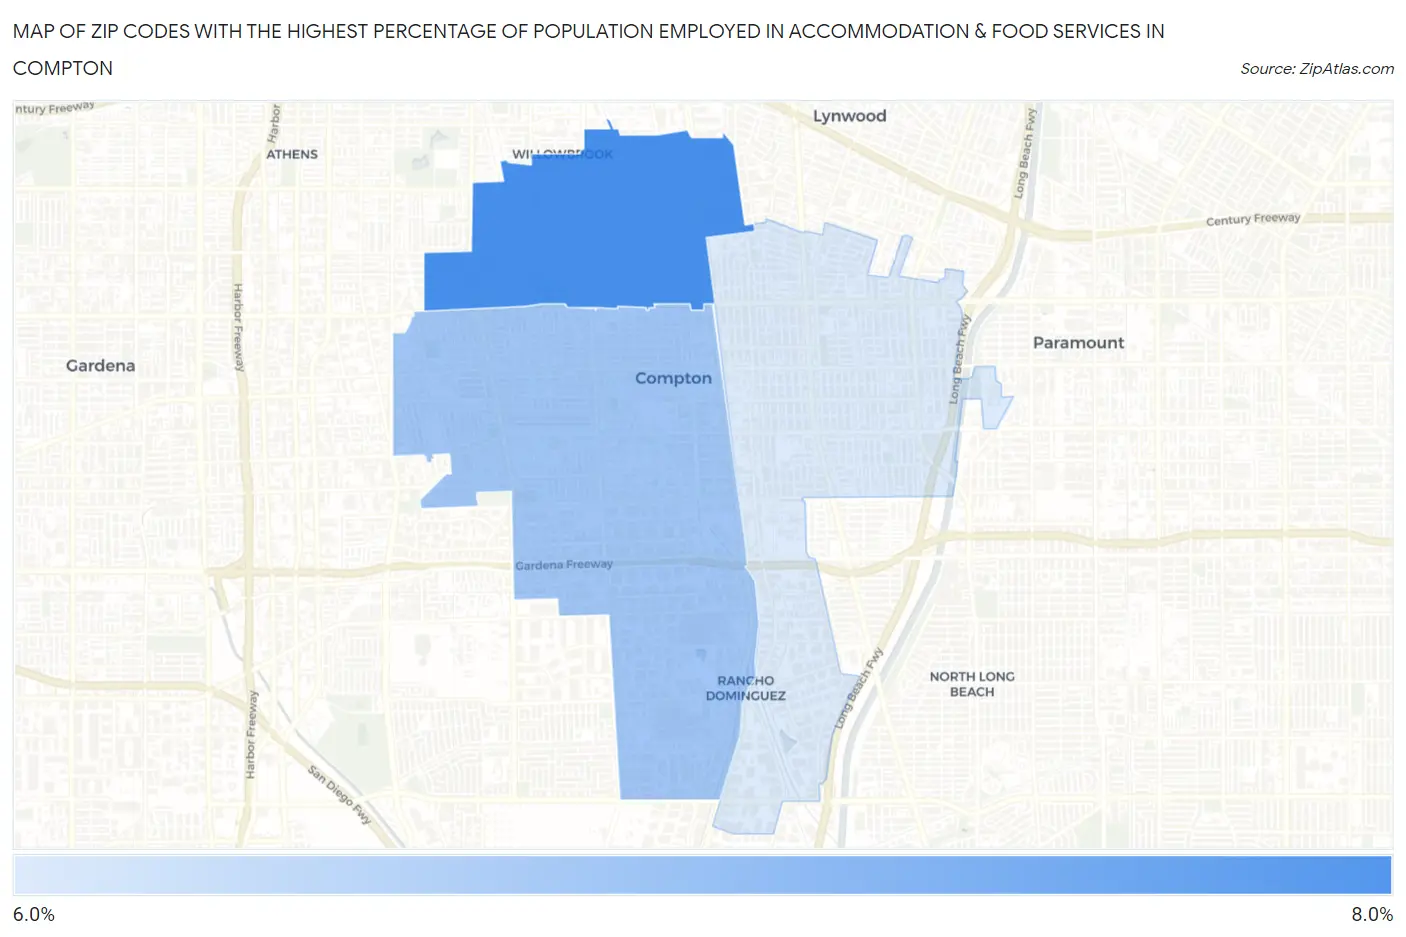
Map of Zip Codes with the Highest Percentage of Population Employed in Accommodation & Food Services in Compton
6.8%
7.6%
Zip Codes with the Highest Percentage of Population Employed in Accommodation & Food Services in Compton, CA
| Zip Code | % Employed | vs State | vs National | |
| 1. | 90222 | 7.6% | 7.2%(+0.382)#602 | 6.9%(+0.672)#8,857 |
| 2. | 90220 | 7.1% | 7.2%(-0.073)#694 | 6.9%(+0.217)#10,055 |
| 3. | 90221 | 6.8% | 7.2%(-0.369)#751 | 6.9%(-0.079)#10,882 |
1
Common Questions
What are the Top Zip Codes with the Highest Percentage of Population Employed in Accommodation & Food Services in Compton, CA?
Top Zip Codes with the Highest Percentage of Population Employed in Accommodation & Food Services in Compton, CA are:
What zip code has the Highest Percentage of Population Employed in Accommodation & Food Services in Compton, CA?
90222 has the Highest Percentage of Population Employed in Accommodation & Food Services in Compton, CA with 7.6%.
What is the Percentage of Population Employed in Accommodation & Food Services in Compton, CA?
Percentage of Population Employed in Accommodation & Food Services in Compton is 6.8%.
What is the Percentage of Population Employed in Accommodation & Food Services in California?
Percentage of Population Employed in Accommodation & Food Services in California is 7.2%.
What is the Percentage of Population Employed in Accommodation & Food Services in the United States?
Percentage of Population Employed in Accommodation & Food Services in the United States is 6.9%.