Zip Codes with the Highest Percentage of Population Employed in Accommodation & Food Services in Rancho Santa Fe, CA
RELATED REPORTS & OPTIONS
Accommodation & Food Services
Rancho Santa Fe
Compare Zip Codes
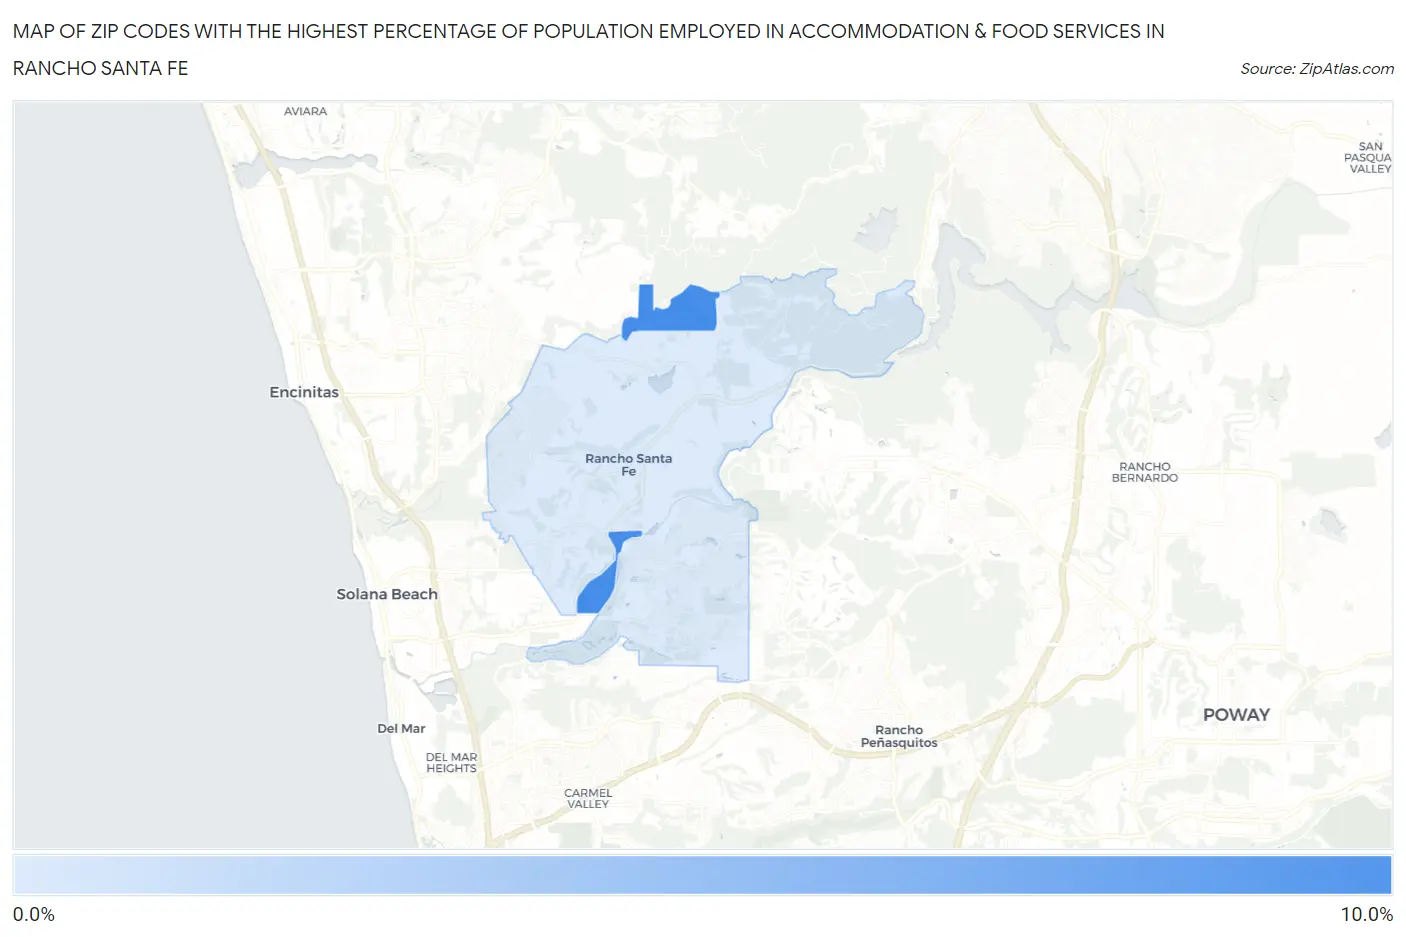
Map of Zip Codes with the Highest Percentage of Population Employed in Accommodation & Food Services in Rancho Santa Fe
1.1%
8.6%
Zip Codes with the Highest Percentage of Population Employed in Accommodation & Food Services in Rancho Santa Fe, CA
| Zip Code | % Employed | vs State | vs National | |
| 1. | 92091 | 8.6% | 7.2%(+1.45)#429 | 6.9%(+1.74)#6,598 |
| 2. | 92067 | 1.1% | 7.2%(-6.05)#1,525 | 6.9%(-5.76)#27,106 |
1
Common Questions
What are the Top Zip Codes with the Highest Percentage of Population Employed in Accommodation & Food Services in Rancho Santa Fe, CA?
Top Zip Codes with the Highest Percentage of Population Employed in Accommodation & Food Services in Rancho Santa Fe, CA are:
What zip code has the Highest Percentage of Population Employed in Accommodation & Food Services in Rancho Santa Fe, CA?
92091 has the Highest Percentage of Population Employed in Accommodation & Food Services in Rancho Santa Fe, CA with 8.6%.
What is the Percentage of Population Employed in Accommodation & Food Services in California?
Percentage of Population Employed in Accommodation & Food Services in California is 7.2%.
What is the Percentage of Population Employed in Accommodation & Food Services in the United States?
Percentage of Population Employed in Accommodation & Food Services in the United States is 6.9%.