Zip Codes with the Highest Percentage of Population Employed in Accommodation & Food Services in Rancho Cordova, CA
RELATED REPORTS & OPTIONS
Accommodation & Food Services
Rancho Cordova
Compare Zip Codes
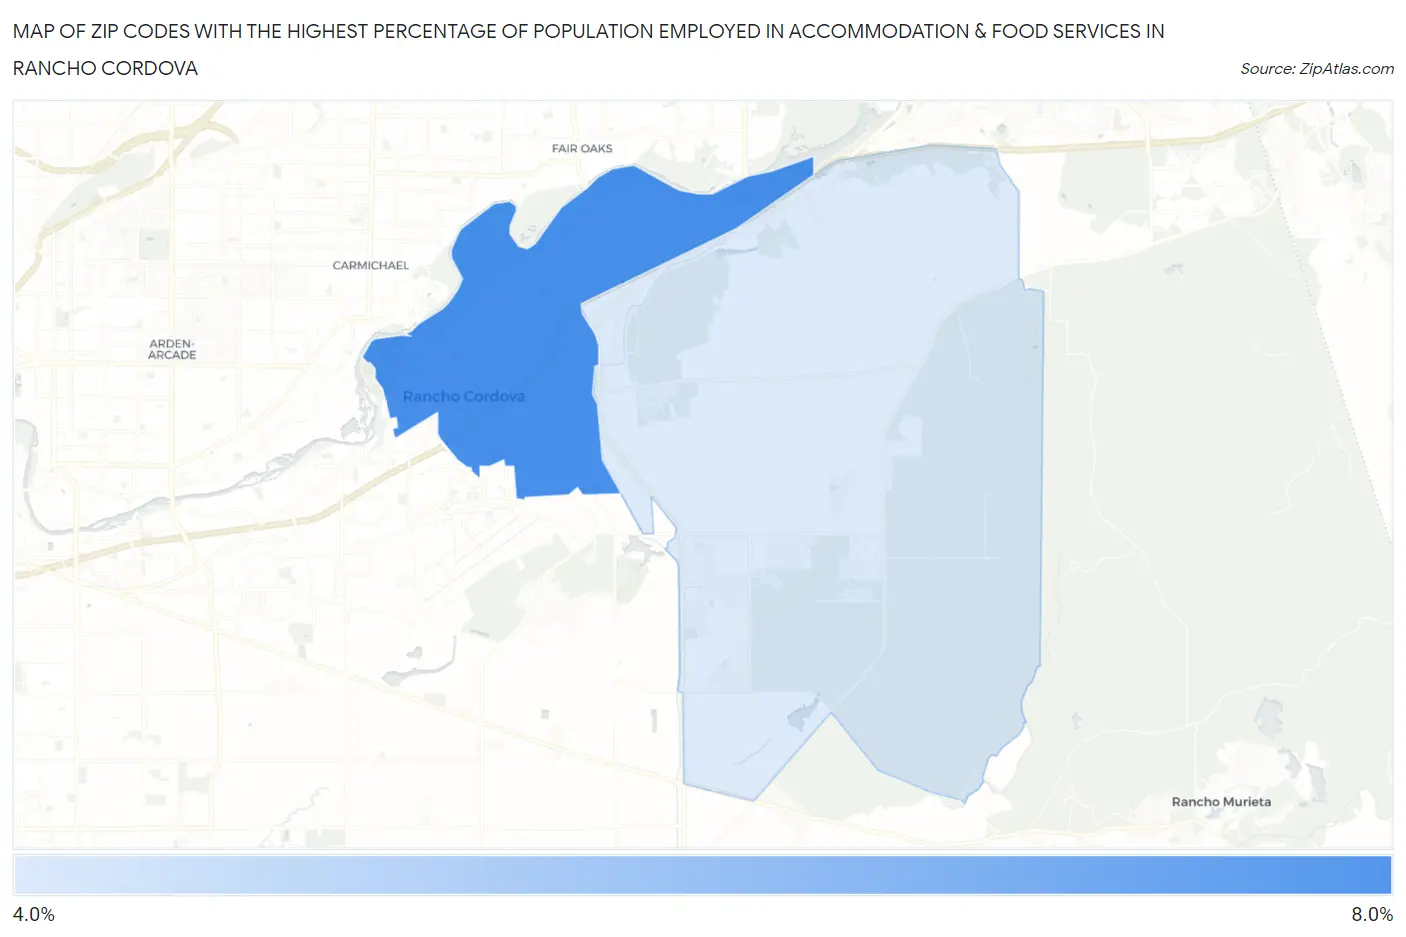
Map of Zip Codes with the Highest Percentage of Population Employed in Accommodation & Food Services in Rancho Cordova
4.9%
6.3%
Zip Codes with the Highest Percentage of Population Employed in Accommodation & Food Services in Rancho Cordova, CA
| Zip Code | % Employed | vs State | vs National | |
| 1. | 95670 | 6.3% | 7.2%(-0.875)#877 | 6.9%(-0.585)#12,495 |
| 2. | 95742 | 4.9% | 7.2%(-2.24)#1,129 | 6.9%(-1.95)#17,036 |
1
Common Questions
What are the Top Zip Codes with the Highest Percentage of Population Employed in Accommodation & Food Services in Rancho Cordova, CA?
Top Zip Codes with the Highest Percentage of Population Employed in Accommodation & Food Services in Rancho Cordova, CA are:
What zip code has the Highest Percentage of Population Employed in Accommodation & Food Services in Rancho Cordova, CA?
95670 has the Highest Percentage of Population Employed in Accommodation & Food Services in Rancho Cordova, CA with 6.3%.
What is the Percentage of Population Employed in Accommodation & Food Services in Rancho Cordova, CA?
Percentage of Population Employed in Accommodation & Food Services in Rancho Cordova is 7.1%.
What is the Percentage of Population Employed in Accommodation & Food Services in California?
Percentage of Population Employed in Accommodation & Food Services in California is 7.2%.
What is the Percentage of Population Employed in Accommodation & Food Services in the United States?
Percentage of Population Employed in Accommodation & Food Services in the United States is 6.9%.