Cities with the Highest Percentage of Population Employed in Accommodation & Food Services in New Mexico
RELATED REPORTS & OPTIONS
Accommodation & Food Services
New Mexico
Compare Cities
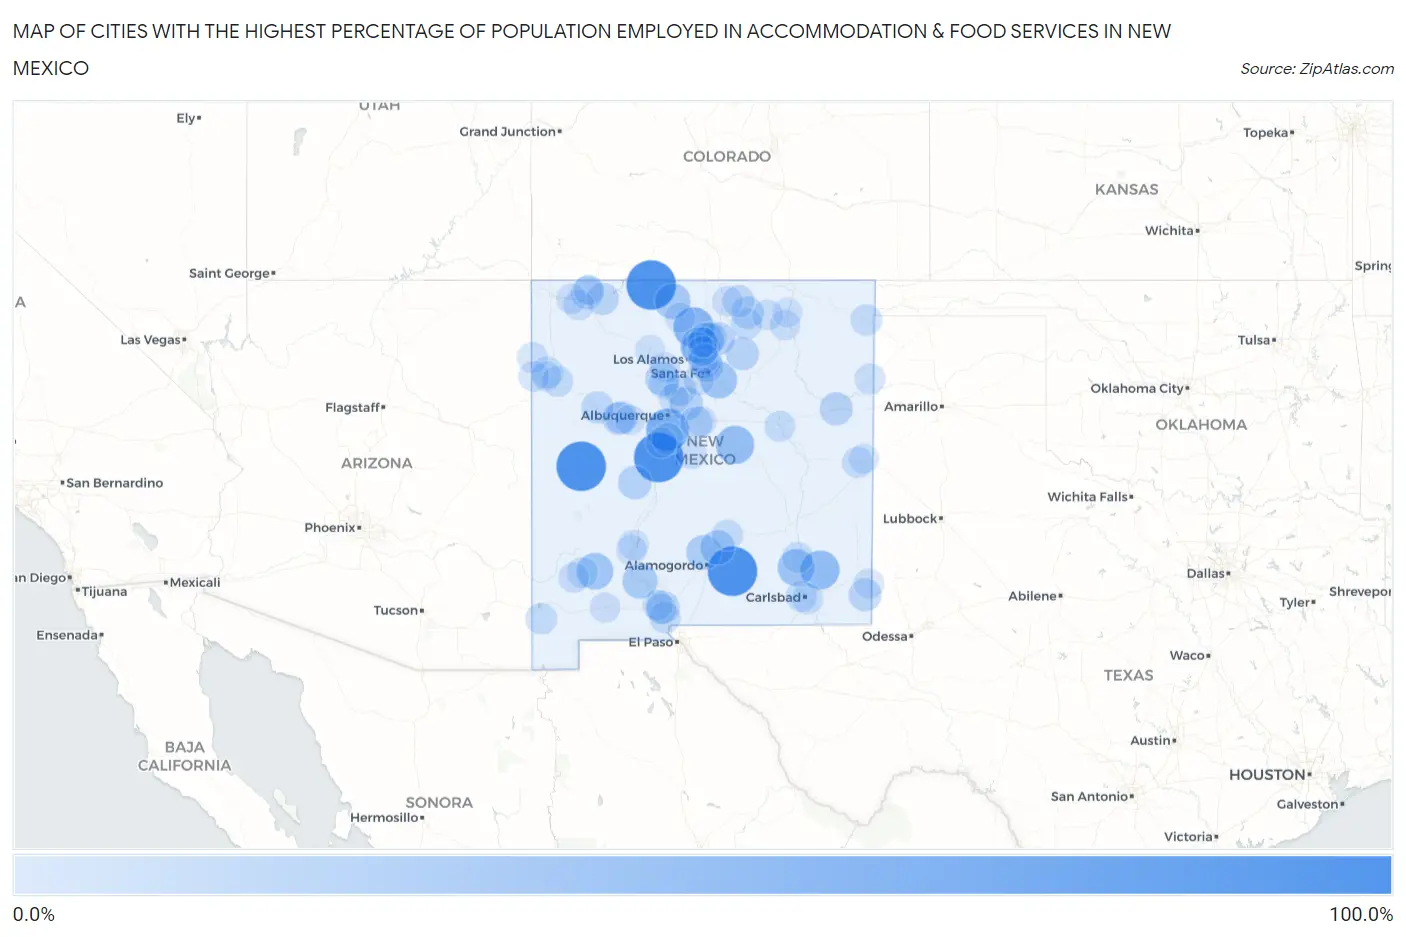
Map of Cities with the Highest Percentage of Population Employed in Accommodation & Food Services in New Mexico
0.0%
100.0%
Cities with the Highest Percentage of Population Employed in Accommodation & Food Services in New Mexico
| City | % Employed | vs State | vs National | |
| 1. | Pie Town | 100.0% | 7.9%(+92.1)#1 | 6.9%(+93.1)#4 |
| 2. | Abeytas | 100.0% | 7.9%(+92.1)#2 | 6.9%(+93.1)#5 |
| 3. | Weed | 100.0% | 7.9%(+92.1)#3 | 6.9%(+93.1)#13 |
| 4. | Lumberton | 100.0% | 7.9%(+92.1)#4 | 6.9%(+93.1)#14 |
| 5. | Chical | 68.1% | 7.9%(+60.1)#5 | 6.9%(+61.2)#61 |
| 6. | El Rito | 58.0% | 7.9%(+50.1)#6 | 6.9%(+51.1)#101 |
| 7. | Pueblito | 51.9% | 7.9%(+43.9)#7 | 6.9%(+45.0)#136 |
| 8. | Loco Hills | 51.4% | 7.9%(+43.5)#8 | 6.9%(+44.5)#140 |
| 9. | Encino | 48.0% | 7.9%(+40.1)#9 | 6.9%(+41.1)#187 |
| 10. | Canada De Los Alamos | 44.6% | 7.9%(+36.7)#10 | 6.9%(+37.8)#214 |
| 11. | La Tierra | 44.1% | 7.9%(+36.2)#11 | 6.9%(+37.2)#224 |
| 12. | Morningside | 42.1% | 7.9%(+34.1)#12 | 6.9%(+35.2)#243 |
| 13. | Glorieta | 40.9% | 7.9%(+32.9)#13 | 6.9%(+34.0)#258 |
| 14. | San Lorenzo | 40.0% | 7.9%(+32.1)#14 | 6.9%(+33.1)#264 |
| 15. | Gamerco | 36.9% | 7.9%(+29.0)#15 | 6.9%(+30.0)#314 |
| 16. | Tierra Amarilla | 36.8% | 7.9%(+28.8)#16 | 6.9%(+29.9)#320 |
| 17. | Velarde | 33.1% | 7.9%(+25.2)#17 | 6.9%(+26.3)#397 |
| 18. | Rodey | 33.1% | 7.9%(+25.1)#18 | 6.9%(+26.2)#400 |
| 19. | Tularosa | 32.4% | 7.9%(+24.5)#19 | 6.9%(+25.5)#414 |
| 20. | Mescalero | 31.6% | 7.9%(+23.6)#20 | 6.9%(+24.7)#433 |
| 21. | Hyde Park | 30.5% | 7.9%(+22.5)#21 | 6.9%(+23.6)#471 |
| 22. | Jemez Pueblo | 28.6% | 7.9%(+20.6)#22 | 6.9%(+21.7)#532 |
| 23. | Magdalena | 27.3% | 7.9%(+19.4)#23 | 6.9%(+20.5)#593 |
| 24. | University Park | 27.1% | 7.9%(+19.2)#24 | 6.9%(+20.2)#604 |
| 25. | La Madera | 25.6% | 7.9%(+17.6)#25 | 6.9%(+18.7)#695 |
| 26. | Tucumcari | 25.5% | 7.9%(+17.6)#26 | 6.9%(+18.6)#704 |
| 27. | Cuyamungue Grant | 25.1% | 7.9%(+17.2)#27 | 6.9%(+18.2)#723 |
| 28. | Mora | 24.3% | 7.9%(+16.3)#28 | 6.9%(+17.4)#793 |
| 29. | Spencerville | 24.2% | 7.9%(+16.2)#29 | 6.9%(+17.3)#799 |
| 30. | Seama | 23.1% | 7.9%(+15.1)#30 | 6.9%(+16.2)#894 |
| 31. | La Bajada | 23.1% | 7.9%(+15.1)#31 | 6.9%(+16.2)#900 |
| 32. | Chamisal | 22.9% | 7.9%(+15.0)#32 | 6.9%(+16.0)#917 |
| 33. | Eunice | 22.9% | 7.9%(+14.9)#33 | 6.9%(+16.0)#923 |
| 34. | Paraje | 22.6% | 7.9%(+14.7)#34 | 6.9%(+15.7)#948 |
| 35. | Blanco | 22.0% | 7.9%(+14.0)#35 | 6.9%(+15.1)#1,017 |
| 36. | Milan | 21.1% | 7.9%(+13.2)#36 | 6.9%(+14.3)#1,107 |
| 37. | Eagle Nest | 21.1% | 7.9%(+13.2)#37 | 6.9%(+14.2)#1,108 |
| 38. | Indian Hills | 21.1% | 7.9%(+13.1)#38 | 6.9%(+14.2)#1,114 |
| 39. | San Felipe Pueblo | 20.2% | 7.9%(+12.2)#39 | 6.9%(+13.3)#1,224 |
| 40. | Peak Place | 20.1% | 7.9%(+12.2)#40 | 6.9%(+13.2)#1,228 |
| 41. | Monterey Park | 19.8% | 7.9%(+11.8)#41 | 6.9%(+12.9)#1,289 |
| 42. | Red River | 19.6% | 7.9%(+11.7)#42 | 6.9%(+12.7)#1,302 |
| 43. | Totah Vista | 19.2% | 7.9%(+11.2)#43 | 6.9%(+12.3)#1,390 |
| 44. | Angustura | 19.0% | 7.9%(+11.1)#44 | 6.9%(+12.1)#1,420 |
| 45. | Ojo Encino | 18.2% | 7.9%(+10.2)#45 | 6.9%(+11.3)#1,584 |
| 46. | Valle Vista | 18.0% | 7.9%(+10.1)#46 | 6.9%(+11.1)#1,623 |
| 47. | Angel Fire | 17.8% | 7.9%(+9.88)#47 | 6.9%(+10.9)#1,655 |
| 48. | La Mesa | 17.6% | 7.9%(+9.64)#48 | 6.9%(+10.7)#1,701 |
| 49. | Twin Lakes | 17.3% | 7.9%(+9.40)#49 | 6.9%(+10.5)#1,752 |
| 50. | Clayton | 17.3% | 7.9%(+9.38)#50 | 6.9%(+10.4)#1,757 |
| 51. | Cotton City | 17.2% | 7.9%(+9.27)#51 | 6.9%(+10.3)#1,787 |
| 52. | Dixon | 17.0% | 7.9%(+9.06)#52 | 6.9%(+10.1)#1,835 |
| 53. | Church Rock | 17.0% | 7.9%(+9.03)#53 | 6.9%(+10.1)#1,843 |
| 54. | Hernandez | 16.5% | 7.9%(+8.54)#54 | 6.9%(+9.59)#1,962 |
| 55. | Crouch Mesa | 16.2% | 7.9%(+8.22)#55 | 6.9%(+9.28)#2,049 |
| 56. | Happy Valley | 16.0% | 7.9%(+8.05)#56 | 6.9%(+9.10)#2,106 |
| 57. | Ruidoso Downs | 16.0% | 7.9%(+8.04)#57 | 6.9%(+9.09)#2,112 |
| 58. | Cannon Afb | 15.8% | 7.9%(+7.91)#58 | 6.9%(+8.97)#2,156 |
| 59. | Livingston Wheeler | 15.7% | 7.9%(+7.78)#59 | 6.9%(+8.83)#2,193 |
| 60. | Santa Rosa | 15.4% | 7.9%(+7.43)#60 | 6.9%(+8.49)#2,313 |
| 61. | Fruitland | 15.3% | 7.9%(+7.41)#61 | 6.9%(+8.46)#2,318 |
| 62. | Lake Arthur | 15.3% | 7.9%(+7.34)#62 | 6.9%(+8.39)#2,341 |
| 63. | Santa Clara | 15.2% | 7.9%(+7.29)#63 | 6.9%(+8.34)#2,349 |
| 64. | Conejo | 14.8% | 7.9%(+6.86)#64 | 6.9%(+7.91)#2,523 |
| 65. | Nara Visa | 14.6% | 7.9%(+6.70)#65 | 6.9%(+7.75)#2,581 |
| 66. | Espanola | 14.6% | 7.9%(+6.68)#66 | 6.9%(+7.73)#2,587 |
| 67. | Napi Headquarters | 14.5% | 7.9%(+6.61)#67 | 6.9%(+7.66)#2,621 |
| 68. | Navajo | 14.4% | 7.9%(+6.51)#68 | 6.9%(+7.56)#2,660 |
| 69. | Iyanbito | 14.4% | 7.9%(+6.47)#69 | 6.9%(+7.52)#2,678 |
| 70. | Tyrone | 14.4% | 7.9%(+6.46)#70 | 6.9%(+7.52)#2,680 |
| 71. | Cimarron | 14.3% | 7.9%(+6.40)#71 | 6.9%(+7.45)#2,703 |
| 72. | Torreon Cdp Sandoval County | 14.3% | 7.9%(+6.35)#72 | 6.9%(+7.40)#2,717 |
| 73. | Tse Bonito | 14.3% | 7.9%(+6.35)#73 | 6.9%(+7.40)#2,729 |
| 74. | Springer | 13.9% | 7.9%(+6.01)#74 | 6.9%(+7.07)#2,868 |
| 75. | La Cienega | 13.9% | 7.9%(+6.00)#75 | 6.9%(+7.05)#2,875 |
| 76. | Mountainair | 13.9% | 7.9%(+5.99)#76 | 6.9%(+7.04)#2,879 |
| 77. | Tano Road | 13.8% | 7.9%(+5.83)#77 | 6.9%(+6.88)#2,963 |
| 78. | Sausal | 13.7% | 7.9%(+5.75)#78 | 6.9%(+6.80)#3,001 |
| 79. | Questa | 13.5% | 7.9%(+5.59)#79 | 6.9%(+6.64)#3,102 |
| 80. | Pojoaque | 13.5% | 7.9%(+5.58)#80 | 6.9%(+6.63)#3,114 |
| 81. | Nadine | 13.5% | 7.9%(+5.56)#81 | 6.9%(+6.62)#3,119 |
| 82. | Moriarty | 13.5% | 7.9%(+5.53)#82 | 6.9%(+6.58)#3,134 |
| 83. | Santa Cruz | 13.2% | 7.9%(+5.25)#83 | 6.9%(+6.31)#3,263 |
| 84. | Williamsburg | 13.2% | 7.9%(+5.23)#84 | 6.9%(+6.28)#3,269 |
| 85. | Deming | 13.1% | 7.9%(+5.17)#85 | 6.9%(+6.22)#3,318 |
| 86. | Truth Or Consequences | 13.1% | 7.9%(+5.12)#86 | 6.9%(+6.18)#3,338 |
| 87. | Jemez Springs | 12.9% | 7.9%(+5.01)#87 | 6.9%(+6.06)#3,399 |
| 88. | Fairacres | 12.9% | 7.9%(+4.98)#88 | 6.9%(+6.03)#3,412 |
| 89. | Kirtland | 12.8% | 7.9%(+4.83)#89 | 6.9%(+5.88)#3,503 |
| 90. | Canjilon | 12.5% | 7.9%(+4.57)#90 | 6.9%(+5.62)#3,683 |
| 91. | San Pablo | 12.3% | 7.9%(+4.40)#91 | 6.9%(+5.45)#3,791 |
| 92. | Mesita | 12.3% | 7.9%(+4.38)#92 | 6.9%(+5.43)#3,800 |
| 93. | Clovis | 12.3% | 7.9%(+4.35)#93 | 6.9%(+5.40)#3,828 |
| 94. | Los Luceros | 12.1% | 7.9%(+4.19)#94 | 6.9%(+5.24)#3,920 |
| 95. | Cuba | 12.0% | 7.9%(+4.10)#95 | 6.9%(+5.16)#3,979 |
| 96. | North Light Plant | 12.0% | 7.9%(+4.05)#96 | 6.9%(+5.11)#4,025 |
| 97. | Zia Pueblo | 11.8% | 7.9%(+3.91)#97 | 6.9%(+4.96)#4,128 |
| 98. | Yah Ta Hey | 11.8% | 7.9%(+3.86)#98 | 6.9%(+4.91)#4,153 |
| 99. | Maxwell | 11.8% | 7.9%(+3.83)#99 | 6.9%(+4.88)#4,178 |
| 100. | Bernalillo | 11.5% | 7.9%(+3.55)#100 | 6.9%(+4.61)#4,375 |
Common Questions
What are the Top 10 Cities with the Highest Percentage of Population Employed in Accommodation & Food Services in New Mexico?
Top 10 Cities with the Highest Percentage of Population Employed in Accommodation & Food Services in New Mexico are:
#1
100.0%
#2
100.0%
#3
100.0%
#4
100.0%
#5
68.1%
#6
58.0%
#7
51.9%
#8
51.4%
#9
48.0%
#10
42.1%
What city has the Highest Percentage of Population Employed in Accommodation & Food Services in New Mexico?
Pie Town has the Highest Percentage of Population Employed in Accommodation & Food Services in New Mexico with 100.0%.
What is the Percentage of Population Employed in Accommodation & Food Services in the State of New Mexico?
Percentage of Population Employed in Accommodation & Food Services in New Mexico is 7.9%.
What is the Percentage of Population Employed in Accommodation & Food Services in the United States?
Percentage of Population Employed in Accommodation & Food Services in the United States is 6.9%.