Cities with the Highest Percentage of Population Employed in Accommodation & Food Services in West Virginia
RELATED REPORTS & OPTIONS
Accommodation & Food Services
West Virginia
Compare Cities
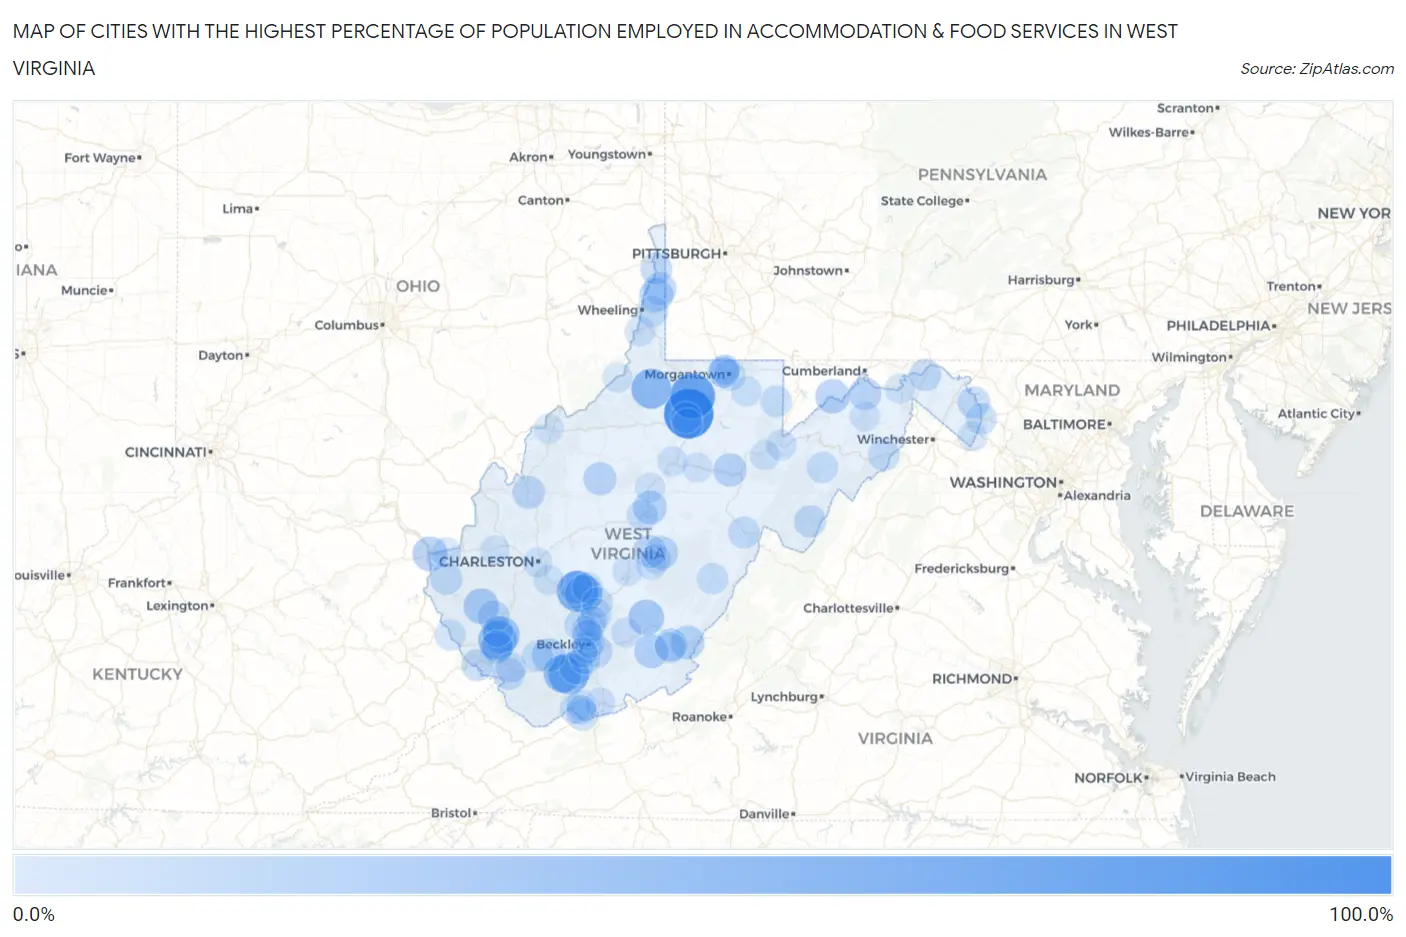
Map of Cities with the Highest Percentage of Population Employed in Accommodation & Food Services in West Virginia
0.0%
100.0%
Cities with the Highest Percentage of Population Employed in Accommodation & Food Services in West Virginia
| City | % Employed | vs State | vs National | |
| 1. | Gypsy | 100.0% | 7.1%(+92.9)#1 | 6.9%(+93.1)#20 |
| 2. | Carolina | 78.9% | 7.1%(+71.9)#2 | 6.9%(+72.1)#44 |
| 3. | Mount Carbon | 60.6% | 7.1%(+53.5)#3 | 6.9%(+53.7)#88 |
| 4. | Corinne | 58.8% | 7.1%(+51.7)#4 | 6.9%(+51.9)#99 |
| 5. | Jacksonburg | 54.3% | 7.1%(+47.2)#5 | 6.9%(+47.4)#121 |
| 6. | Rossmore | 48.3% | 7.1%(+41.2)#6 | 6.9%(+41.4)#185 |
| 7. | Charlton Heights | 44.3% | 7.1%(+37.2)#7 | 6.9%(+37.4)#221 |
| 8. | Itmann | 44.2% | 7.1%(+37.2)#8 | 6.9%(+37.3)#223 |
| 9. | Stollings | 41.6% | 7.1%(+34.5)#9 | 6.9%(+34.7)#248 |
| 10. | Rupert | 35.0% | 7.1%(+27.9)#10 | 6.9%(+28.1)#352 |
| 11. | Harts | 34.7% | 7.1%(+27.7)#11 | 6.9%(+27.9)#357 |
| 12. | Kenova | 31.7% | 7.1%(+24.6)#12 | 6.9%(+24.8)#426 |
| 13. | Piedmont | 28.9% | 7.1%(+21.9)#13 | 6.9%(+22.1)#515 |
| 14. | Alderson | 27.5% | 7.1%(+20.4)#14 | 6.9%(+20.6)#588 |
| 15. | West Liberty | 27.2% | 7.1%(+20.2)#15 | 6.9%(+20.4)#601 |
| 16. | White Sulphur Springs | 26.9% | 7.1%(+19.8)#16 | 6.9%(+20.0)#624 |
| 17. | Rhodell | 26.3% | 7.1%(+19.2)#17 | 6.9%(+19.4)#653 |
| 18. | Flatwoods | 26.0% | 7.1%(+18.9)#18 | 6.9%(+19.1)#669 |
| 19. | Glen Fork | 26.0% | 7.1%(+18.9)#19 | 6.9%(+19.1)#670 |
| 20. | Booth | 25.3% | 7.1%(+18.2)#20 | 6.9%(+18.4)#712 |
| 21. | Cowen | 25.2% | 7.1%(+18.1)#21 | 6.9%(+18.3)#716 |
| 22. | Junior | 24.4% | 7.1%(+17.3)#22 | 6.9%(+17.5)#779 |
| 23. | Grantsville | 23.6% | 7.1%(+16.5)#23 | 6.9%(+16.7)#851 |
| 24. | Smithers | 22.6% | 7.1%(+15.6)#24 | 6.9%(+15.8)#942 |
| 25. | Bethany | 22.6% | 7.1%(+15.5)#25 | 6.9%(+15.7)#946 |
| 26. | Fairlea | 22.5% | 7.1%(+15.4)#26 | 6.9%(+15.6)#954 |
| 27. | Omar | 22.4% | 7.1%(+15.4)#27 | 6.9%(+15.6)#957 |
| 28. | Tioga | 21.7% | 7.1%(+14.6)#28 | 6.9%(+14.8)#1,040 |
| 29. | Ripley | 21.5% | 7.1%(+14.5)#29 | 6.9%(+14.7)#1,055 |
| 30. | Fort Ashby | 21.4% | 7.1%(+14.4)#30 | 6.9%(+14.6)#1,060 |
| 31. | Daniels | 21.0% | 7.1%(+13.9)#31 | 6.9%(+14.1)#1,127 |
| 32. | Shepherdstown | 20.4% | 7.1%(+13.4)#32 | 6.9%(+13.5)#1,192 |
| 33. | Wayne | 19.6% | 7.1%(+12.5)#33 | 6.9%(+12.7)#1,304 |
| 34. | Bath Berkeley Springs | 19.4% | 7.1%(+12.3)#34 | 6.9%(+12.5)#1,354 |
| 35. | Follansbee | 19.2% | 7.1%(+12.1)#35 | 6.9%(+12.3)#1,386 |
| 36. | Matewan | 19.2% | 7.1%(+12.1)#36 | 6.9%(+12.3)#1,391 |
| 37. | Gilbert Creek | 19.2% | 7.1%(+12.1)#37 | 6.9%(+12.3)#1,396 |
| 38. | Chapmanville | 19.1% | 7.1%(+12.1)#38 | 6.9%(+12.3)#1,402 |
| 39. | Granville | 19.1% | 7.1%(+12.0)#39 | 6.9%(+12.2)#1,406 |
| 40. | Brandywine | 18.7% | 7.1%(+11.6)#40 | 6.9%(+11.8)#1,480 |
| 41. | Chauncey | 18.5% | 7.1%(+11.4)#41 | 6.9%(+11.6)#1,512 |
| 42. | Durbin | 18.3% | 7.1%(+11.2)#42 | 6.9%(+11.4)#1,547 |
| 43. | Wardensville | 17.0% | 7.1%(+9.93)#43 | 6.9%(+10.1)#1,832 |
| 44. | Marlinton | 16.8% | 7.1%(+9.73)#44 | 6.9%(+9.92)#1,876 |
| 45. | Brush Fork | 16.7% | 7.1%(+9.62)#45 | 6.9%(+9.82)#1,894 |
| 46. | Terra Alta | 16.5% | 7.1%(+9.39)#46 | 6.9%(+9.58)#1,964 |
| 47. | Harpers Ferry | 16.3% | 7.1%(+9.22)#47 | 6.9%(+9.42)#2,002 |
| 48. | Petersburg | 16.1% | 7.1%(+9.06)#48 | 6.9%(+9.26)#2,053 |
| 49. | Pax | 16.0% | 7.1%(+8.92)#49 | 6.9%(+9.12)#2,103 |
| 50. | Triadelphia | 15.9% | 7.1%(+8.86)#50 | 6.9%(+9.06)#2,121 |
| 51. | West Logan | 15.2% | 7.1%(+8.15)#51 | 6.9%(+8.35)#2,344 |
| 52. | Morgantown | 15.2% | 7.1%(+8.13)#52 | 6.9%(+8.33)#2,354 |
| 53. | Coal City | 15.2% | 7.1%(+8.08)#53 | 6.9%(+8.28)#2,373 |
| 54. | Institute | 15.2% | 7.1%(+8.07)#54 | 6.9%(+8.27)#2,375 |
| 55. | Macarthur | 15.0% | 7.1%(+7.89)#55 | 6.9%(+8.08)#2,458 |
| 56. | Oceana | 14.9% | 7.1%(+7.79)#56 | 6.9%(+7.98)#2,495 |
| 57. | Mount Hope | 14.7% | 7.1%(+7.66)#57 | 6.9%(+7.85)#2,540 |
| 58. | Sutton | 14.6% | 7.1%(+7.56)#58 | 6.9%(+7.75)#2,577 |
| 59. | Hepzibah | 14.3% | 7.1%(+7.21)#59 | 6.9%(+7.40)#2,721 |
| 60. | Kermit | 14.3% | 7.1%(+7.21)#60 | 6.9%(+7.40)#2,724 |
| 61. | Oak Hill | 14.3% | 7.1%(+7.20)#61 | 6.9%(+7.40)#2,750 |
| 62. | Beckley | 14.1% | 7.1%(+7.04)#62 | 6.9%(+7.24)#2,806 |
| 63. | Ronceverte | 14.1% | 7.1%(+7.02)#63 | 6.9%(+7.22)#2,817 |
| 64. | Newark | 13.7% | 7.1%(+6.63)#64 | 6.9%(+6.83)#2,989 |
| 65. | Gauley Bridge | 13.6% | 7.1%(+6.56)#65 | 6.9%(+6.76)#3,030 |
| 66. | Bradley | 13.3% | 7.1%(+6.24)#66 | 6.9%(+6.44)#3,206 |
| 67. | Bramwell | 13.0% | 7.1%(+5.97)#67 | 6.9%(+6.16)#3,348 |
| 68. | Moundsville | 12.9% | 7.1%(+5.81)#68 | 6.9%(+6.01)#3,434 |
| 69. | Fayetteville | 12.9% | 7.1%(+5.80)#69 | 6.9%(+5.99)#3,444 |
| 70. | Westover | 12.7% | 7.1%(+5.59)#70 | 6.9%(+5.78)#3,573 |
| 71. | Hilltop | 12.5% | 7.1%(+5.42)#71 | 6.9%(+5.62)#3,665 |
| 72. | Clarksburg | 12.4% | 7.1%(+5.34)#72 | 6.9%(+5.54)#3,732 |
| 73. | Gilbert | 12.4% | 7.1%(+5.33)#73 | 6.9%(+5.52)#3,740 |
| 74. | Prosperity | 12.3% | 7.1%(+5.24)#74 | 6.9%(+5.43)#3,799 |
| 75. | Meadow Bridge | 12.2% | 7.1%(+5.08)#75 | 6.9%(+5.28)#3,897 |
| 76. | Thomas | 12.1% | 7.1%(+5.07)#76 | 6.9%(+5.26)#3,913 |
| 77. | Craigsville | 12.1% | 7.1%(+5.04)#77 | 6.9%(+5.24)#3,930 |
| 78. | Huntington | 12.0% | 7.1%(+4.95)#78 | 6.9%(+5.14)#3,986 |
| 79. | Ranson Corporation | 11.5% | 7.1%(+4.39)#79 | 6.9%(+4.59)#4,389 |
| 80. | Princeton | 11.5% | 7.1%(+4.37)#80 | 6.9%(+4.57)#4,405 |
| 81. | Reedsville | 11.3% | 7.1%(+4.24)#81 | 6.9%(+4.44)#4,502 |
| 82. | Camden On Gauley | 11.3% | 7.1%(+4.24)#82 | 6.9%(+4.44)#4,505 |
| 83. | Sophia | 11.3% | 7.1%(+4.21)#83 | 6.9%(+4.41)#4,529 |
| 84. | Montcalm | 11.3% | 7.1%(+4.21)#84 | 6.9%(+4.40)#4,540 |
| 85. | Weston | 10.9% | 7.1%(+3.85)#85 | 6.9%(+4.05)#4,849 |
| 86. | Romney | 10.7% | 7.1%(+3.66)#86 | 6.9%(+3.85)#5,012 |
| 87. | Chesapeake | 10.7% | 7.1%(+3.64)#87 | 6.9%(+3.83)#5,026 |
| 88. | Buckhannon | 10.7% | 7.1%(+3.63)#88 | 6.9%(+3.83)#5,037 |
| 89. | Paden City | 10.7% | 7.1%(+3.60)#89 | 6.9%(+3.79)#5,064 |
| 90. | Hambleton | 10.6% | 7.1%(+3.53)#90 | 6.9%(+3.73)#5,122 |
| 91. | Star City | 10.6% | 7.1%(+3.52)#91 | 6.9%(+3.72)#5,131 |
| 92. | Shannondale | 10.5% | 7.1%(+3.38)#92 | 6.9%(+3.57)#5,268 |
| 93. | Dupont | 10.3% | 7.1%(+3.23)#93 | 6.9%(+3.43)#5,428 |
| 94. | Paw Paw | 10.3% | 7.1%(+3.21)#94 | 6.9%(+3.40)#5,463 |
| 95. | Hurricane | 10.3% | 7.1%(+3.20)#95 | 6.9%(+3.40)#5,475 |
| 96. | Summersville | 10.3% | 7.1%(+3.18)#96 | 6.9%(+3.38)#5,494 |
| 97. | Burnsville | 10.3% | 7.1%(+3.18)#97 | 6.9%(+3.38)#5,502 |
| 98. | Parkersburg | 10.2% | 7.1%(+3.15)#98 | 6.9%(+3.35)#5,528 |
| 99. | Charleston | 10.2% | 7.1%(+3.15)#99 | 6.9%(+3.34)#5,530 |
| 100. | Bluewell | 10.1% | 7.1%(+3.05)#100 | 6.9%(+3.24)#5,649 |
Common Questions
What are the Top 10 Cities with the Highest Percentage of Population Employed in Accommodation & Food Services in West Virginia?
Top 10 Cities with the Highest Percentage of Population Employed in Accommodation & Food Services in West Virginia are:
#1
100.0%
#2
78.9%
#3
60.6%
#4
58.8%
#5
54.3%
#6
48.3%
#7
44.3%
#8
44.2%
#9
41.6%
#10
35.0%
What city has the Highest Percentage of Population Employed in Accommodation & Food Services in West Virginia?
Gypsy has the Highest Percentage of Population Employed in Accommodation & Food Services in West Virginia with 100.0%.
What is the Percentage of Population Employed in Accommodation & Food Services in the State of West Virginia?
Percentage of Population Employed in Accommodation & Food Services in West Virginia is 7.1%.
What is the Percentage of Population Employed in Accommodation & Food Services in the United States?
Percentage of Population Employed in Accommodation & Food Services in the United States is 6.9%.