Zip Codes with the Highest Percentage of Population Employed in Accommodation & Food Services in Whittier, CA
RELATED REPORTS & OPTIONS
Accommodation & Food Services
Whittier
Compare Zip Codes
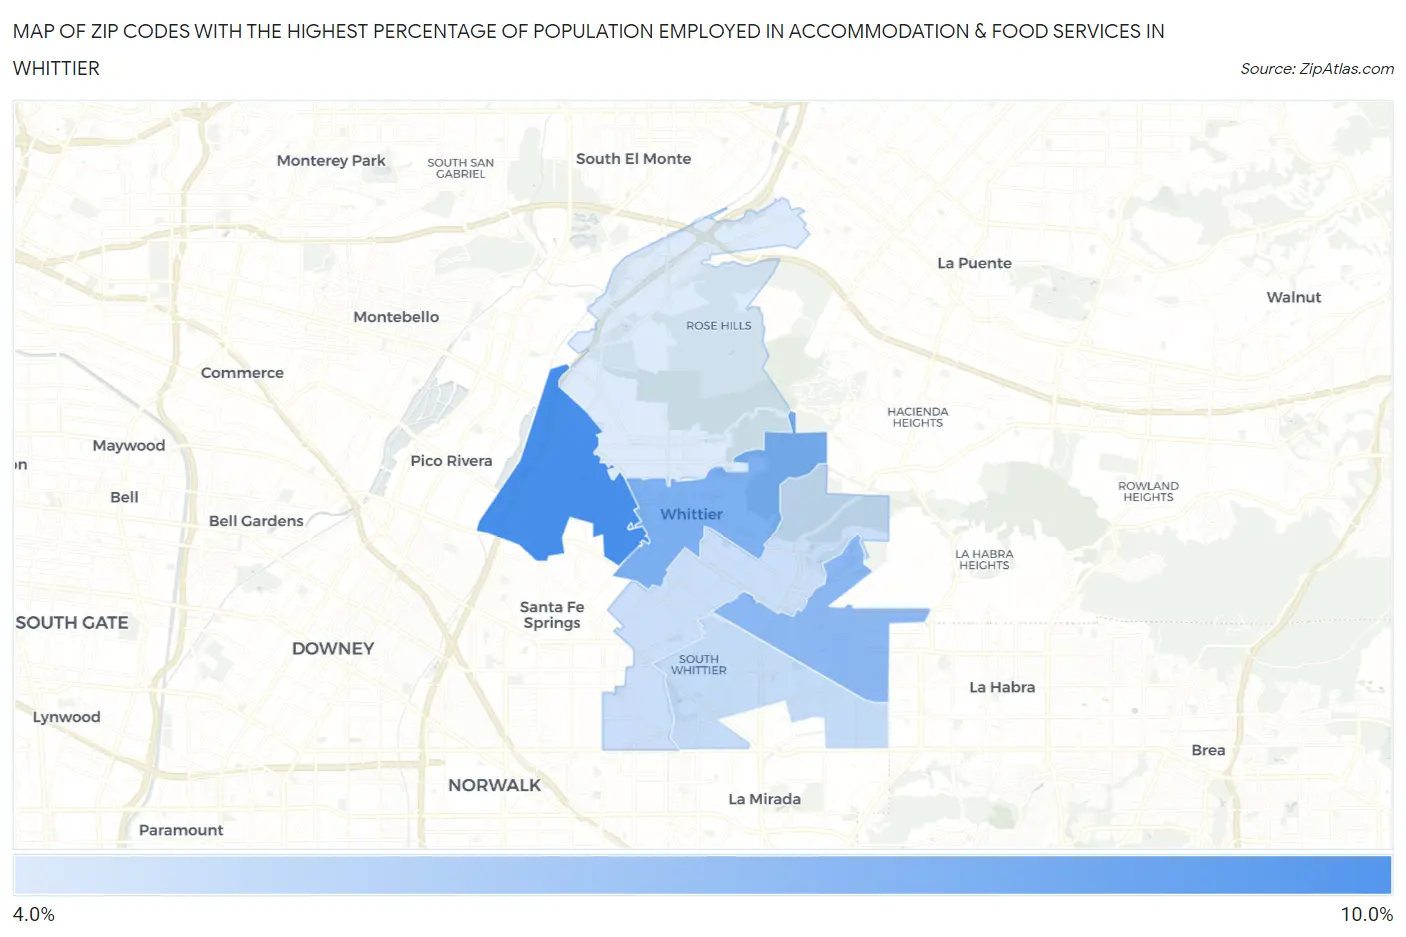
Map of Zip Codes with the Highest Percentage of Population Employed in Accommodation & Food Services in Whittier
4.9%
8.1%
Zip Codes with the Highest Percentage of Population Employed in Accommodation & Food Services in Whittier, CA
| Zip Code | % Employed | vs State | vs National | |
| 1. | 90606 | 8.1% | 7.2%(+0.926)#511 | 6.9%(+1.22)#7,631 |
| 2. | 90602 | 6.9% | 7.2%(-0.243)#733 | 6.9%(+0.047)#10,529 |
| 3. | 90603 | 6.6% | 7.2%(-0.542)#792 | 6.9%(-0.252)#11,423 |
| 4. | 90604 | 5.4% | 7.2%(-1.78)#1,044 | 6.9%(-1.49)#15,442 |
| 5. | 90605 | 5.2% | 7.2%(-1.93)#1,080 | 6.9%(-1.64)#15,978 |
| 6. | 90601 | 4.9% | 7.2%(-2.31)#1,147 | 6.9%(-2.02)#17,299 |
1
Common Questions
What are the Top 5 Zip Codes with the Highest Percentage of Population Employed in Accommodation & Food Services in Whittier, CA?
Top 5 Zip Codes with the Highest Percentage of Population Employed in Accommodation & Food Services in Whittier, CA are:
What zip code has the Highest Percentage of Population Employed in Accommodation & Food Services in Whittier, CA?
90606 has the Highest Percentage of Population Employed in Accommodation & Food Services in Whittier, CA with 8.1%.
What is the Percentage of Population Employed in Accommodation & Food Services in Whittier, CA?
Percentage of Population Employed in Accommodation & Food Services in Whittier is 5.9%.
What is the Percentage of Population Employed in Accommodation & Food Services in California?
Percentage of Population Employed in Accommodation & Food Services in California is 7.2%.
What is the Percentage of Population Employed in Accommodation & Food Services in the United States?
Percentage of Population Employed in Accommodation & Food Services in the United States is 6.9%.