Cities with the Highest Percentage of Population Employed in Accommodation & Food Services in Michigan
RELATED REPORTS & OPTIONS
Accommodation & Food Services
Michigan
Compare Cities
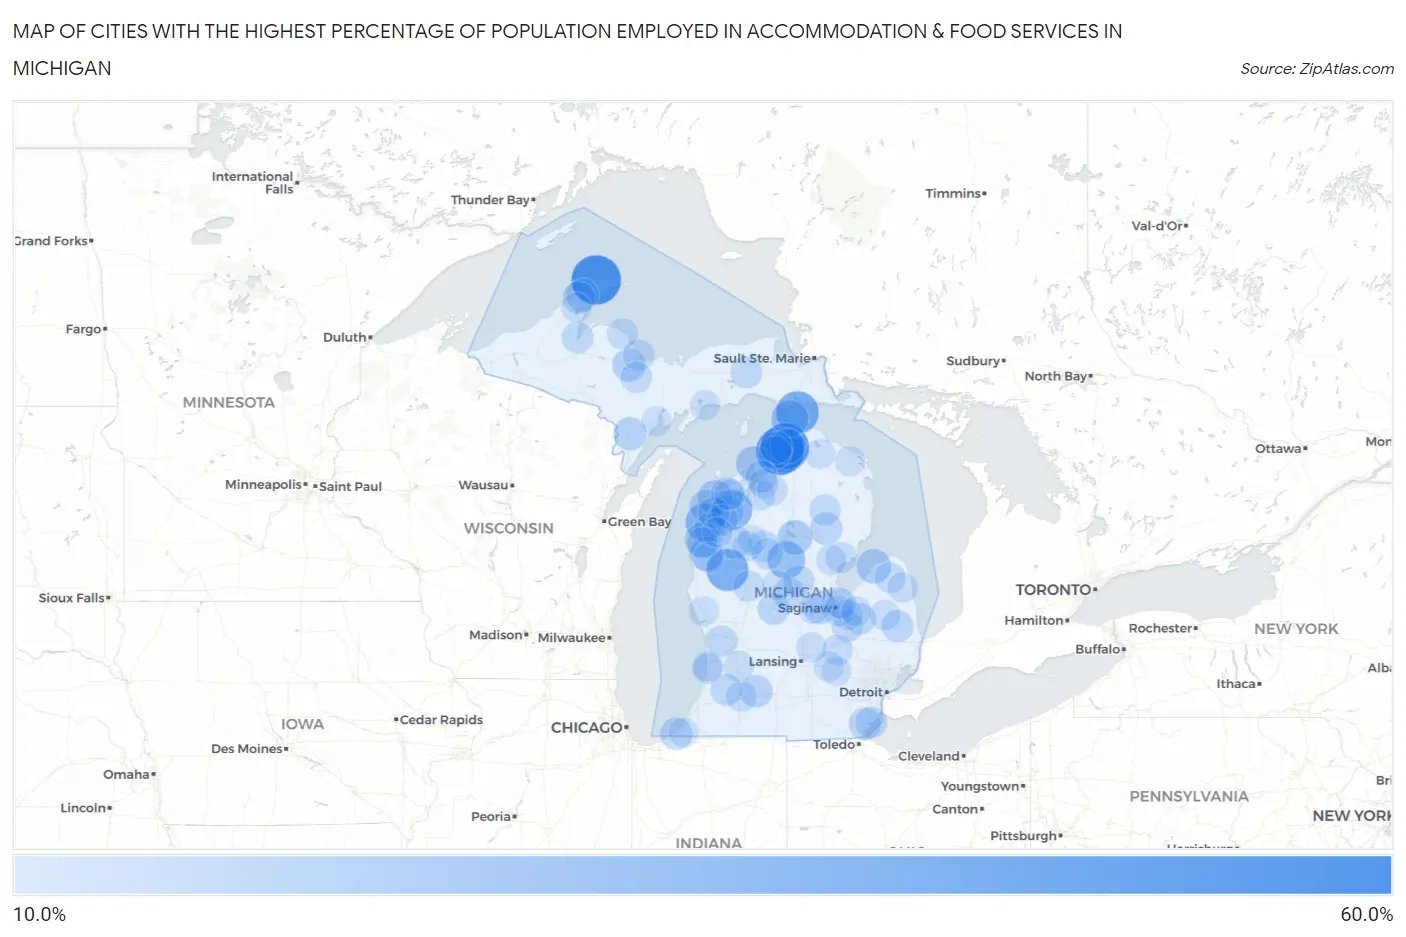
Map of Cities with the Highest Percentage of Population Employed in Accommodation & Food Services in Michigan
0.0%
60.0%
Cities with the Highest Percentage of Population Employed in Accommodation & Food Services in Michigan
| City | % Employed | vs State | vs National | |
| 1. | Eagle Harbor | 54.5% | 7.1%(+47.5)#1 | 6.9%(+47.7)#117 |
| 2. | Oden | 51.4% | 7.1%(+44.3)#2 | 6.9%(+44.5)#139 |
| 3. | Bay View | 50.9% | 7.1%(+43.9)#3 | 6.9%(+44.1)#144 |
| 4. | Mackinac Island | 39.7% | 7.1%(+32.6)#4 | 6.9%(+32.8)#270 |
| 5. | Baldwin | 38.0% | 7.1%(+30.9)#5 | 6.9%(+31.1)#295 |
| 6. | Ponshewaing | 37.3% | 7.1%(+30.2)#6 | 6.9%(+30.4)#308 |
| 7. | Riverdale | 35.7% | 7.1%(+28.6)#7 | 6.9%(+28.8)#338 |
| 8. | Covington | 34.7% | 7.1%(+27.6)#8 | 6.9%(+27.8)#359 |
| 9. | Interlochen | 33.3% | 7.1%(+26.2)#9 | 6.9%(+26.5)#379 |
| 10. | Arcadia | 31.8% | 7.1%(+24.7)#10 | 6.9%(+24.9)#421 |
| 11. | Harrison | 29.3% | 7.1%(+22.2)#11 | 6.9%(+22.4)#505 |
| 12. | Mackinaw City | 27.7% | 7.1%(+20.6)#12 | 6.9%(+20.9)#579 |
| 13. | Bergland | 27.7% | 7.1%(+20.6)#13 | 6.9%(+20.8)#581 |
| 14. | Norwood | 24.4% | 7.1%(+17.4)#14 | 6.9%(+17.6)#777 |
| 15. | Parkdale | 23.9% | 7.1%(+16.8)#15 | 6.9%(+17.0)#822 |
| 16. | Alanson | 23.1% | 7.1%(+16.0)#16 | 6.9%(+16.2)#892 |
| 17. | Empire | 23.0% | 7.1%(+15.9)#17 | 6.9%(+16.1)#911 |
| 18. | Prudenville | 22.7% | 7.1%(+15.6)#18 | 6.9%(+15.8)#935 |
| 19. | Caseville | 22.3% | 7.1%(+15.2)#19 | 6.9%(+15.4)#965 |
| 20. | Free Soil | 21.4% | 7.1%(+14.3)#20 | 6.9%(+14.5)#1,063 |
| 21. | Crystal Downs Country Club | 20.0% | 7.1%(+12.9)#21 | 6.9%(+13.1)#1,254 |
| 22. | Hemlock | 19.8% | 7.1%(+12.7)#22 | 6.9%(+12.9)#1,286 |
| 23. | Palmer | 19.6% | 7.1%(+12.5)#23 | 6.9%(+12.7)#1,312 |
| 24. | Carney | 19.6% | 7.1%(+12.5)#24 | 6.9%(+12.7)#1,313 |
| 25. | Caberfae | 19.4% | 7.1%(+12.4)#25 | 6.9%(+12.6)#1,335 |
| 26. | Petoskey | 19.2% | 7.1%(+12.1)#26 | 6.9%(+12.3)#1,395 |
| 27. | Augusta | 19.0% | 7.1%(+12.0)#27 | 6.9%(+12.2)#1,410 |
| 28. | Bendon | 18.5% | 7.1%(+11.4)#28 | 6.9%(+11.6)#1,515 |
| 29. | Maple City | 18.5% | 7.1%(+11.4)#29 | 6.9%(+11.6)#1,516 |
| 30. | Copper City | 18.5% | 7.1%(+11.4)#30 | 6.9%(+11.6)#1,520 |
| 31. | New Buffalo | 18.3% | 7.1%(+11.2)#31 | 6.9%(+11.4)#1,559 |
| 32. | Rose City | 18.1% | 7.1%(+11.0)#32 | 6.9%(+11.2)#1,612 |
| 33. | Harbor Springs | 18.0% | 7.1%(+11.0)#33 | 6.9%(+11.2)#1,613 |
| 34. | Pittsford | 18.0% | 7.1%(+10.9)#34 | 6.9%(+11.1)#1,617 |
| 35. | West Monroe | 17.9% | 7.1%(+10.8)#35 | 6.9%(+11.0)#1,641 |
| 36. | Calumet | 17.8% | 7.1%(+10.8)#36 | 6.9%(+11.0)#1,650 |
| 37. | Grand Marais | 17.8% | 7.1%(+10.7)#37 | 6.9%(+10.9)#1,658 |
| 38. | Mount Pleasant | 17.6% | 7.1%(+10.5)#38 | 6.9%(+10.7)#1,700 |
| 39. | Edmore | 17.4% | 7.1%(+10.3)#39 | 6.9%(+10.5)#1,744 |
| 40. | Melvin | 17.1% | 7.1%(+10.0)#40 | 6.9%(+10.2)#1,806 |
| 41. | Central Lake | 17.1% | 7.1%(+9.99)#41 | 6.9%(+10.2)#1,814 |
| 42. | Bear Lake | 17.0% | 7.1%(+9.90)#42 | 6.9%(+10.1)#1,839 |
| 43. | Coleman | 17.0% | 7.1%(+9.87)#43 | 6.9%(+10.1)#1,847 |
| 44. | Newberry | 16.9% | 7.1%(+9.77)#44 | 6.9%(+9.97)#1,865 |
| 45. | Woodland Beach | 16.8% | 7.1%(+9.74)#45 | 6.9%(+9.94)#1,873 |
| 46. | Tower | 16.8% | 7.1%(+9.72)#46 | 6.9%(+9.92)#1,877 |
| 47. | Millington | 16.7% | 7.1%(+9.62)#47 | 6.9%(+9.82)#1,895 |
| 48. | Allendale | 16.6% | 7.1%(+9.55)#48 | 6.9%(+9.76)#1,921 |
| 49. | Gobles | 16.5% | 7.1%(+9.40)#49 | 6.9%(+9.60)#1,960 |
| 50. | Baraga | 16.5% | 7.1%(+9.39)#50 | 6.9%(+9.59)#1,963 |
| 51. | Marquette | 16.3% | 7.1%(+9.23)#51 | 6.9%(+9.44)#1,995 |
| 52. | Mcbain | 16.2% | 7.1%(+9.07)#52 | 6.9%(+9.28)#2,047 |
| 53. | Benzonia | 16.2% | 7.1%(+9.07)#53 | 6.9%(+9.28)#2,048 |
| 54. | Marion | 16.1% | 7.1%(+9.00)#54 | 6.9%(+9.20)#2,077 |
| 55. | Big Rapids | 16.0% | 7.1%(+8.89)#55 | 6.9%(+9.09)#2,110 |
| 56. | Clio | 15.9% | 7.1%(+8.82)#56 | 6.9%(+9.02)#2,137 |
| 57. | Mio | 15.8% | 7.1%(+8.69)#57 | 6.9%(+8.89)#2,180 |
| 58. | Gwinn | 15.8% | 7.1%(+8.68)#58 | 6.9%(+8.89)#2,182 |
| 59. | Omer | 15.6% | 7.1%(+8.54)#59 | 6.9%(+8.74)#2,224 |
| 60. | Zilwaukee | 15.6% | 7.1%(+8.50)#60 | 6.9%(+8.71)#2,242 |
| 61. | Kalamazoo | 15.4% | 7.1%(+8.34)#61 | 6.9%(+8.54)#2,290 |
| 62. | Big Bay | 15.2% | 7.1%(+8.13)#62 | 6.9%(+8.34)#2,351 |
| 63. | Thompsonville | 15.2% | 7.1%(+8.13)#63 | 6.9%(+8.34)#2,352 |
| 64. | Eastlake | 15.1% | 7.1%(+8.00)#64 | 6.9%(+8.20)#2,410 |
| 65. | Bad Axe | 15.1% | 7.1%(+7.98)#65 | 6.9%(+8.19)#2,417 |
| 66. | Rapid City | 15.0% | 7.1%(+7.96)#66 | 6.9%(+8.16)#2,427 |
| 67. | Cedar | 15.0% | 7.1%(+7.92)#67 | 6.9%(+8.12)#2,452 |
| 68. | Gaines | 14.9% | 7.1%(+7.81)#68 | 6.9%(+8.01)#2,487 |
| 69. | Fountain | 14.9% | 7.1%(+7.78)#69 | 6.9%(+7.98)#2,497 |
| 70. | Wayland | 14.6% | 7.1%(+7.53)#70 | 6.9%(+7.73)#2,586 |
| 71. | Frankenmuth | 14.6% | 7.1%(+7.51)#71 | 6.9%(+7.71)#2,597 |
| 72. | Minden City | 14.6% | 7.1%(+7.50)#72 | 6.9%(+7.70)#2,604 |
| 73. | Bridgeport | 14.6% | 7.1%(+7.48)#73 | 6.9%(+7.68)#2,616 |
| 74. | Douglas | 14.4% | 7.1%(+7.29)#74 | 6.9%(+7.49)#2,690 |
| 75. | Marlette | 14.3% | 7.1%(+7.26)#75 | 6.9%(+7.46)#2,696 |
| 76. | Lake Victoria | 14.3% | 7.1%(+7.20)#76 | 6.9%(+7.40)#2,712 |
| 77. | Sterling | 14.3% | 7.1%(+7.20)#77 | 6.9%(+7.40)#2,719 |
| 78. | Wedgewood | 14.3% | 7.1%(+7.20)#78 | 6.9%(+7.40)#2,723 |
| 79. | Lake Gogebic | 14.3% | 7.1%(+7.20)#79 | 6.9%(+7.40)#2,734 |
| 80. | Mancelona | 14.3% | 7.1%(+7.18)#80 | 6.9%(+7.39)#2,752 |
| 81. | Merrill | 14.2% | 7.1%(+7.15)#81 | 6.9%(+7.35)#2,765 |
| 82. | Fowlerville | 14.2% | 7.1%(+7.11)#82 | 6.9%(+7.31)#2,780 |
| 83. | Posen | 14.1% | 7.1%(+7.03)#83 | 6.9%(+7.24)#2,811 |
| 84. | Robin Glen Indiantown | 14.0% | 7.1%(+6.88)#84 | 6.9%(+7.08)#2,863 |
| 85. | Saugatuck | 13.9% | 7.1%(+6.78)#85 | 6.9%(+6.98)#2,912 |
| 86. | Weidman | 13.9% | 7.1%(+6.78)#86 | 6.9%(+6.98)#2,913 |
| 87. | Shaftsburg | 13.9% | 7.1%(+6.77)#87 | 6.9%(+6.97)#2,917 |
| 88. | Lakewood Club | 13.8% | 7.1%(+6.71)#88 | 6.9%(+6.92)#2,940 |
| 89. | Onaway | 13.8% | 7.1%(+6.70)#89 | 6.9%(+6.90)#2,954 |
| 90. | Manistique | 13.8% | 7.1%(+6.69)#90 | 6.9%(+6.89)#2,957 |
| 91. | Kaleva | 13.8% | 7.1%(+6.68)#91 | 6.9%(+6.89)#2,962 |
| 92. | Dollar Bay | 13.6% | 7.1%(+6.54)#92 | 6.9%(+6.75)#3,049 |
| 93. | Vassar | 13.6% | 7.1%(+6.54)#93 | 6.9%(+6.74)#3,051 |
| 94. | Atlantic Mine | 13.6% | 7.1%(+6.54)#94 | 6.9%(+6.74)#3,052 |
| 95. | Escanaba | 13.5% | 7.1%(+6.46)#95 | 6.9%(+6.66)#3,086 |
| 96. | Haring | 13.5% | 7.1%(+6.38)#96 | 6.9%(+6.58)#3,135 |
| 97. | Howell | 13.4% | 7.1%(+6.34)#97 | 6.9%(+6.54)#3,150 |
| 98. | Rapid River | 13.4% | 7.1%(+6.30)#98 | 6.9%(+6.50)#3,173 |
| 99. | Three Oaks | 13.3% | 7.1%(+6.26)#99 | 6.9%(+6.46)#3,187 |
| 100. | Bellaire | 13.3% | 7.1%(+6.17)#100 | 6.9%(+6.37)#3,233 |
Common Questions
What are the Top 10 Cities with the Highest Percentage of Population Employed in Accommodation & Food Services in Michigan?
Top 10 Cities with the Highest Percentage of Population Employed in Accommodation & Food Services in Michigan are:
#1
54.5%
#2
51.4%
#3
50.9%
#4
39.7%
#5
38.0%
#6
37.3%
#7
33.3%
#8
31.8%
#9
29.3%
#10
27.7%
What city has the Highest Percentage of Population Employed in Accommodation & Food Services in Michigan?
Eagle Harbor has the Highest Percentage of Population Employed in Accommodation & Food Services in Michigan with 54.5%.
What is the Percentage of Population Employed in Accommodation & Food Services in the State of Michigan?
Percentage of Population Employed in Accommodation & Food Services in Michigan is 7.1%.
What is the Percentage of Population Employed in Accommodation & Food Services in the United States?
Percentage of Population Employed in Accommodation & Food Services in the United States is 6.9%.