Zip Codes with the Highest Percentage of Population with a Degree in Liberal Arts and History in Yorba Linda, CA
RELATED REPORTS & OPTIONS
Liberal Arts and History
Yorba Linda
Compare Zip Codes
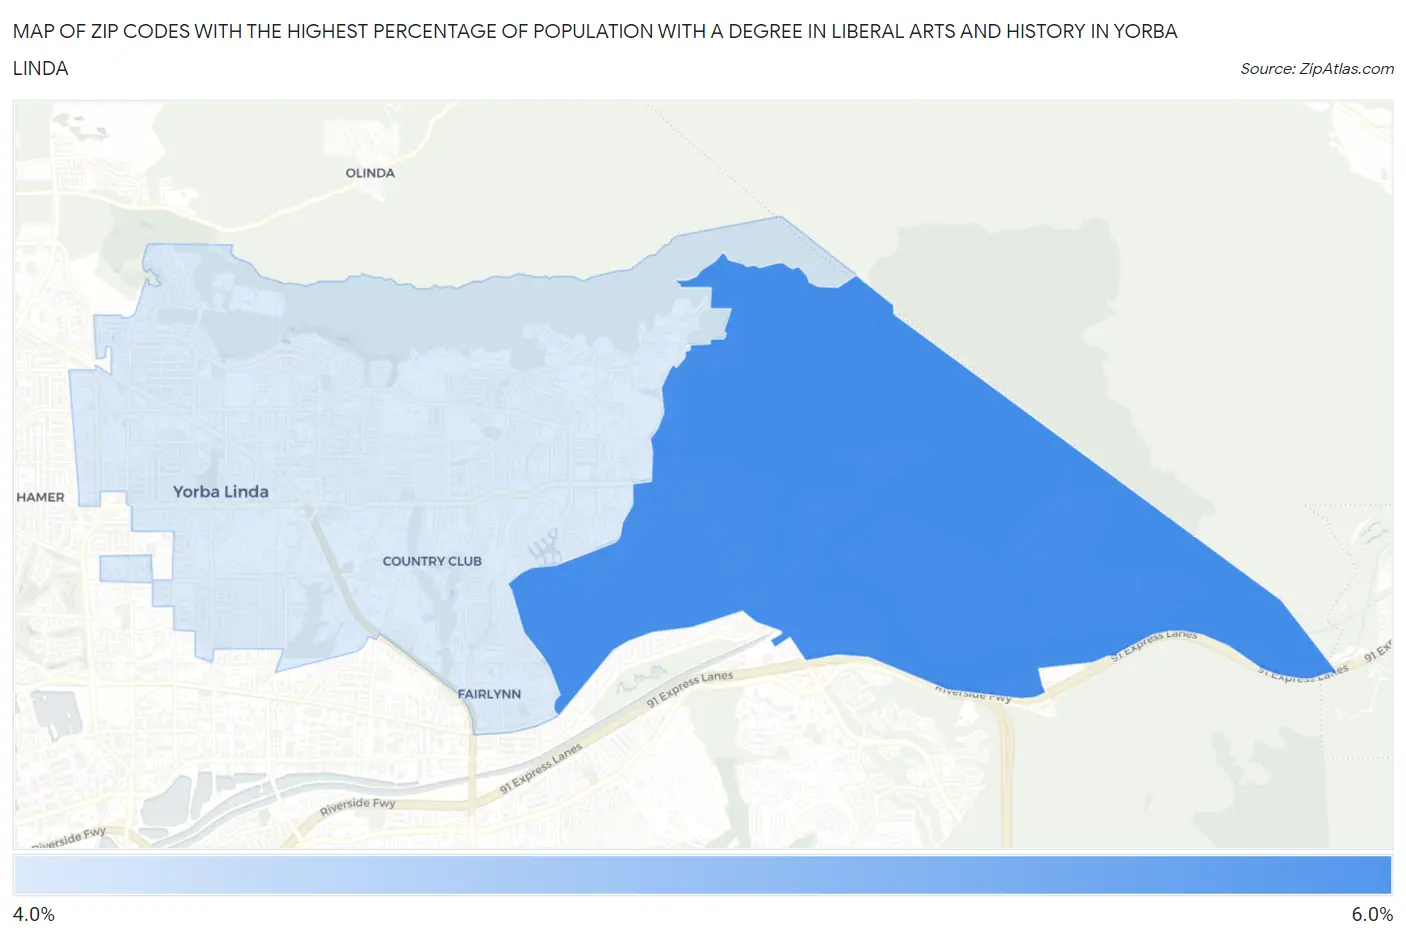
Map of Zip Codes with the Highest Percentage of Population with a Degree in Liberal Arts and History in Yorba Linda
4.3%
5.4%
Zip Codes with the Highest Percentage of Population with a Degree in Liberal Arts and History in Yorba Linda, CA
| Zip Code | % Graduates | vs State | vs National | |
| 1. | 92887 | 5.4% | 5.5%(-0.135)#894 | 4.9%(+0.489)#10,238 |
| 2. | 92886 | 4.3% | 5.5%(-1.24)#1,134 | 4.9%(-0.618)#13,809 |
1
Common Questions
What are the Top Zip Codes with the Highest Percentage of Population with a Degree in Liberal Arts and History in Yorba Linda, CA?
Top Zip Codes with the Highest Percentage of Population with a Degree in Liberal Arts and History in Yorba Linda, CA are:
What zip code has the Highest Percentage of Population with a Degree in Liberal Arts and History in Yorba Linda, CA?
92887 has the Highest Percentage of Population with a Degree in Liberal Arts and History in Yorba Linda, CA with 5.4%.
What is the Percentage of Population with a Degree in Liberal Arts and History in Yorba Linda, CA?
Percentage of Population with a Degree in Liberal Arts and History in Yorba Linda is 4.7%.
What is the Percentage of Population with a Degree in Liberal Arts and History in California?
Percentage of Population with a Degree in Liberal Arts and History in California is 5.5%.
What is the Percentage of Population with a Degree in Liberal Arts and History in the United States?
Percentage of Population with a Degree in Liberal Arts and History in the United States is 4.9%.