Zip Codes with the Highest Percentage of Population with a Degree in Liberal Arts and History in Alameda, CA
RELATED REPORTS & OPTIONS
Liberal Arts and History
Alameda
Compare Zip Codes
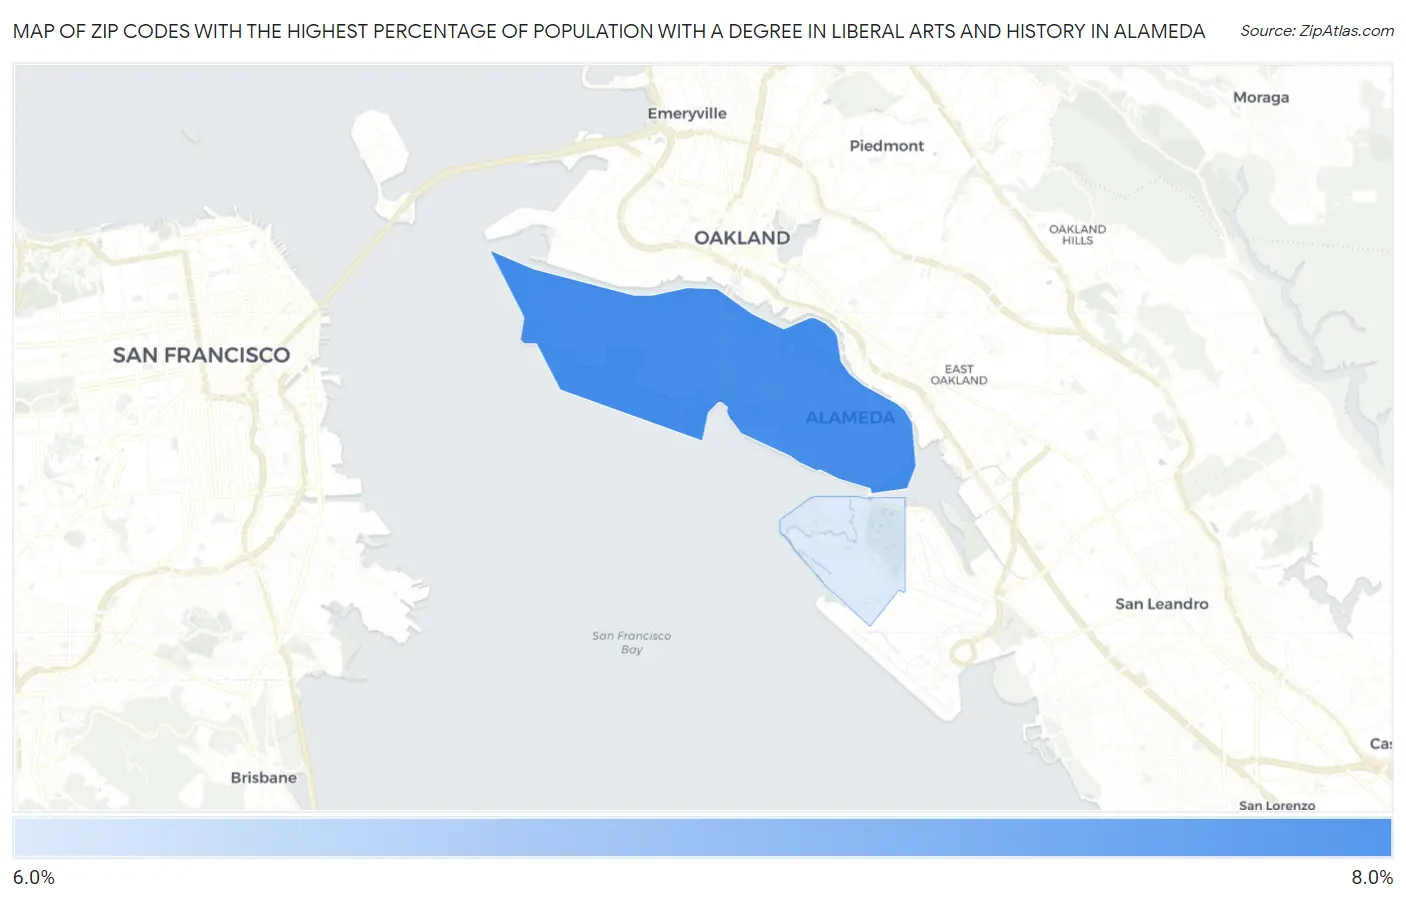
Map of Zip Codes with the Highest Percentage of Population with a Degree in Liberal Arts and History in Alameda
6.1%
6.3%
Zip Codes with the Highest Percentage of Population with a Degree in Liberal Arts and History in Alameda, CA
| Zip Code | % Graduates | vs State | vs National | |
| 1. | 94501 | 6.3% | 5.5%(+0.766)#672 | 4.9%(+1.39)#7,871 |
| 2. | 94502 | 6.1% | 5.5%(+0.592)#722 | 4.9%(+1.22)#8,292 |
1
Common Questions
What are the Top Zip Codes with the Highest Percentage of Population with a Degree in Liberal Arts and History in Alameda, CA?
Top Zip Codes with the Highest Percentage of Population with a Degree in Liberal Arts and History in Alameda, CA are:
What zip code has the Highest Percentage of Population with a Degree in Liberal Arts and History in Alameda, CA?
94501 has the Highest Percentage of Population with a Degree in Liberal Arts and History in Alameda, CA with 6.3%.
What is the Percentage of Population with a Degree in Liberal Arts and History in Alameda, CA?
Percentage of Population with a Degree in Liberal Arts and History in Alameda is 6.2%.
What is the Percentage of Population with a Degree in Liberal Arts and History in California?
Percentage of Population with a Degree in Liberal Arts and History in California is 5.5%.
What is the Percentage of Population with a Degree in Liberal Arts and History in the United States?
Percentage of Population with a Degree in Liberal Arts and History in the United States is 4.9%.