Zip Codes with the Highest Percentage of Population with a Degree in Liberal Arts and History in Garden Grove, CA
RELATED REPORTS & OPTIONS
Liberal Arts and History
Garden Grove
Compare Zip Codes
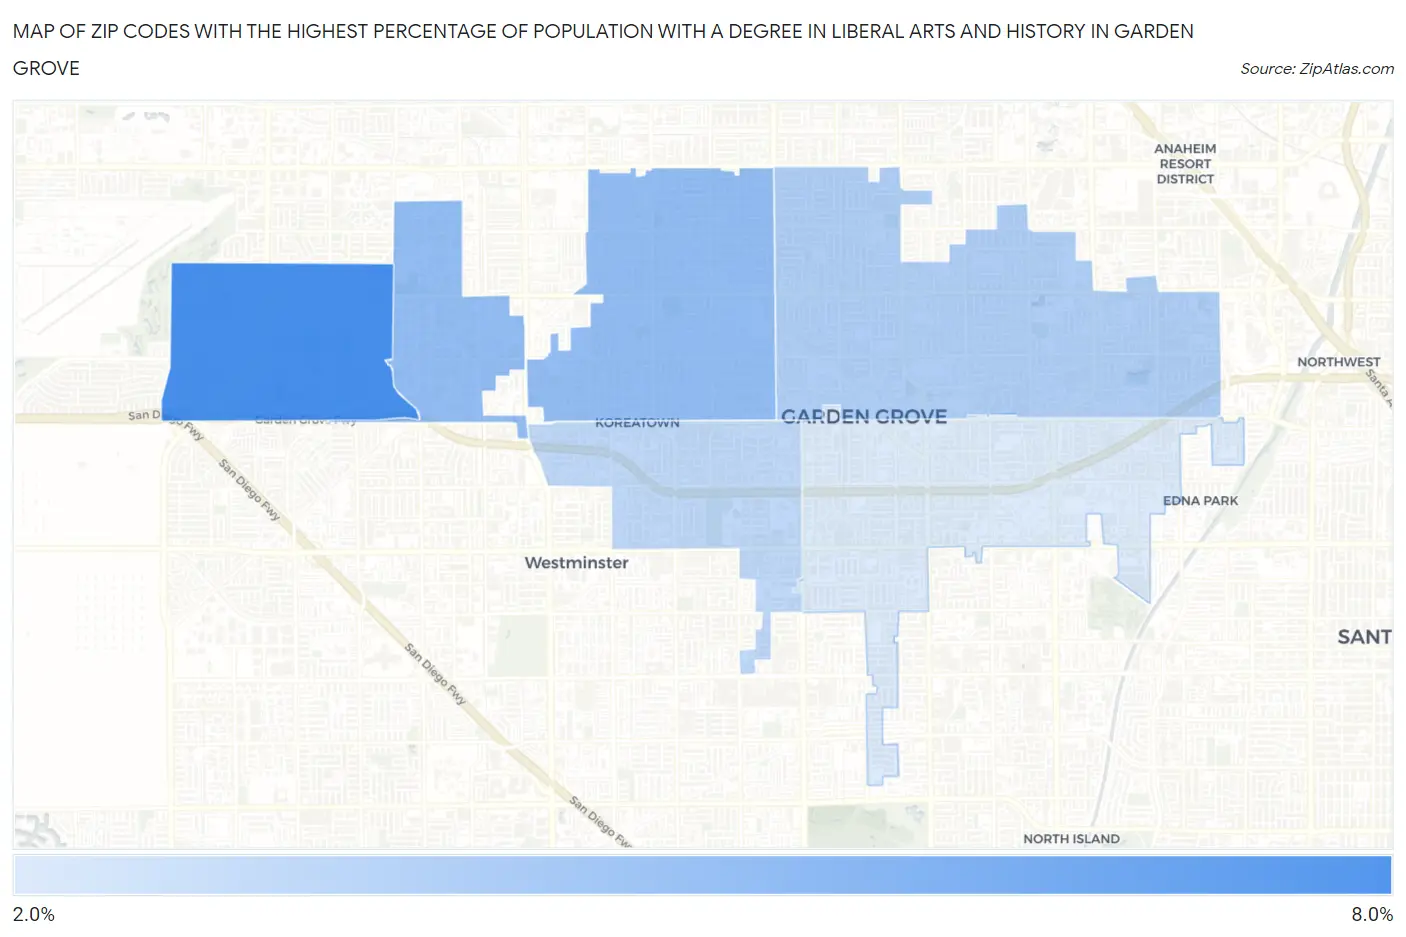
Map of Zip Codes with the Highest Percentage of Population with a Degree in Liberal Arts and History in Garden Grove
2.3%
6.3%
Zip Codes with the Highest Percentage of Population with a Degree in Liberal Arts and History in Garden Grove, CA
| Zip Code | % Graduates | vs State | vs National | |
| 1. | 92845 | 6.3% | 5.5%(+0.842)#652 | 4.9%(+1.47)#7,685 |
| 2. | 92841 | 4.3% | 5.5%(-1.23)#1,132 | 4.9%(-0.610)#13,769 |
| 3. | 92840 | 3.5% | 5.5%(-1.96)#1,264 | 4.9%(-1.33)#16,448 |
| 4. | 92844 | 3.1% | 5.5%(-2.39)#1,336 | 4.9%(-1.76)#17,973 |
| 5. | 92843 | 2.3% | 5.5%(-3.15)#1,408 | 4.9%(-2.53)#20,433 |
1
Common Questions
What are the Top 3 Zip Codes with the Highest Percentage of Population with a Degree in Liberal Arts and History in Garden Grove, CA?
Top 3 Zip Codes with the Highest Percentage of Population with a Degree in Liberal Arts and History in Garden Grove, CA are:
What zip code has the Highest Percentage of Population with a Degree in Liberal Arts and History in Garden Grove, CA?
92845 has the Highest Percentage of Population with a Degree in Liberal Arts and History in Garden Grove, CA with 6.3%.
What is the Percentage of Population with a Degree in Liberal Arts and History in Garden Grove, CA?
Percentage of Population with a Degree in Liberal Arts and History in Garden Grove is 3.8%.
What is the Percentage of Population with a Degree in Liberal Arts and History in California?
Percentage of Population with a Degree in Liberal Arts and History in California is 5.5%.
What is the Percentage of Population with a Degree in Liberal Arts and History in the United States?
Percentage of Population with a Degree in Liberal Arts and History in the United States is 4.9%.