Keswick, CA Map & Demographics
Keswick Map
Keswick Overview
$18,262
PER CAPITA INCOME
$39,375
AVG FAMILY INCOME
$39,167
AVG HOUSEHOLD INCOME
0.29
INEQUALITY / GINI INDEX
138
TOTAL POPULATION
84
MALE POPULATION
54
FEMALE POPULATION
155.56
MALES / 100 FEMALES
64.29
FEMALES / 100 MALES
50.9
MEDIAN AGE
3.1
AVG FAMILY SIZE
2.8
AVG HOUSEHOLD SIZE
30
LABOR FORCE [ PEOPLE ]
27.0%
PERCENT IN LABOR FORCE
20.0%
UNEMPLOYMENT RATE
Income in Keswick
Income Overview in Keswick
Per Capita Income in Keswick is $18,262, while median incomes of families and households are $39,375 and $39,167 respectively.
| Characteristic | Number | Measure |
| Per Capita Income | 138 | $18,262 |
| Median Family Income | 41 | $39,375 |
| Mean Family Income | 41 | $48,993 |
| Median Household Income | 50 | $39,167 |
| Mean Household Income | 50 | $49,242 |
| Income Deficit | 41 | $0 |
| Wage / Income Gap (%) | 138 | 0.00% |
| Wage / Income Gap ($) | 138 | 100.00¢ per $1 |
| Gini / Inequality Index | 138 | 0.29 |
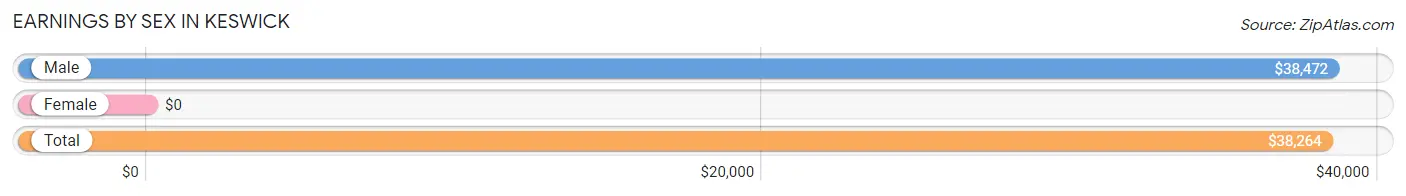
Earnings by Sex in Keswick
| Sex | Number | Average Earnings |
| Male | 28 (90.3%) | $38,472 |
| Female | 3 (9.7%) | $0 |
| Total | 31 (100.0%) | $38,264 |
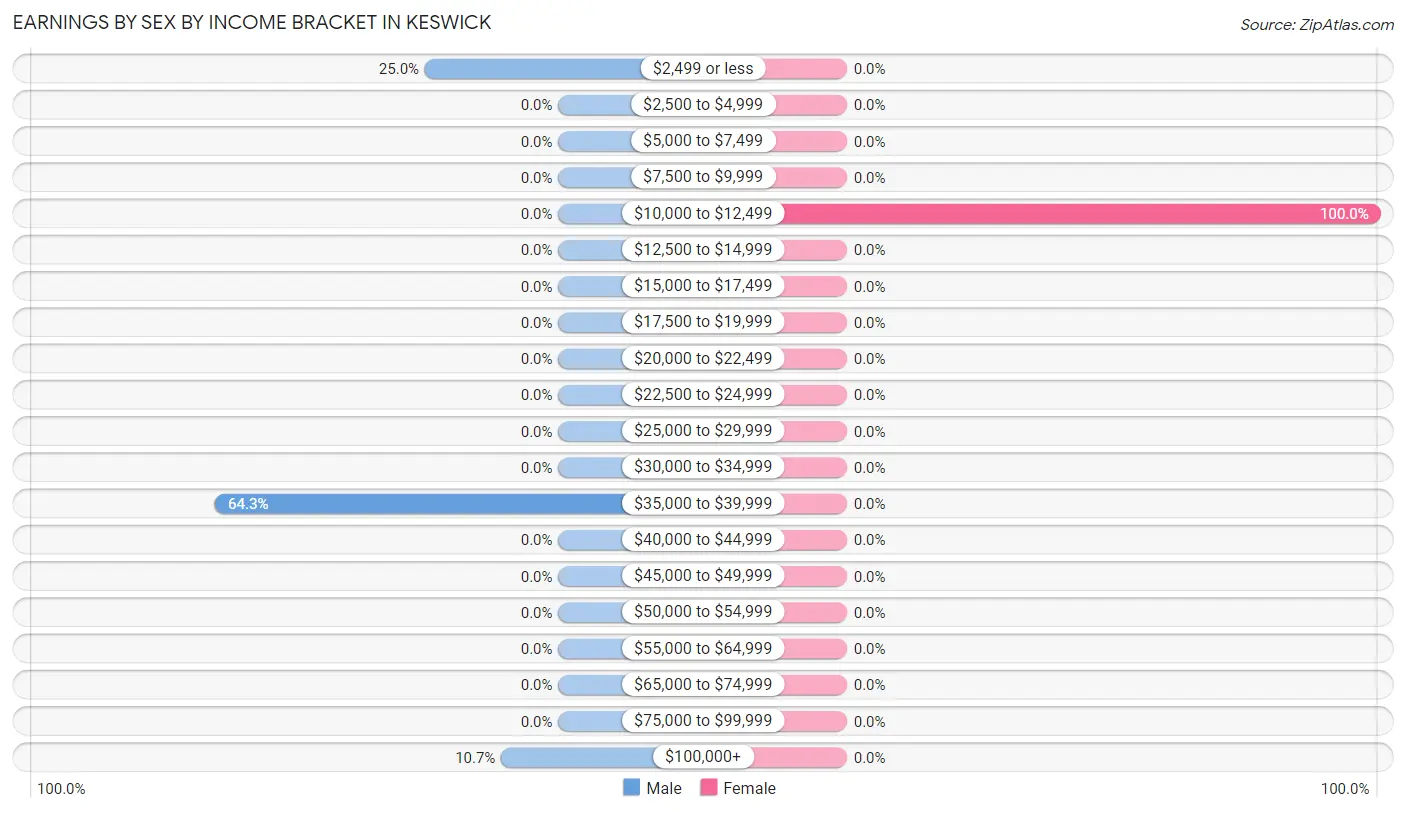
Earnings by Sex by Income Bracket in Keswick
The most common earnings brackets in Keswick are $35,000 to $39,999 for men (18 | 64.3%) and $10,000 to $12,499 for women (3 | 100.0%).
| Income | Male | Female |
| $2,499 or less | 7 (25.0%) | 0 (0.0%) |
| $2,500 to $4,999 | 0 (0.0%) | 0 (0.0%) |
| $5,000 to $7,499 | 0 (0.0%) | 0 (0.0%) |
| $7,500 to $9,999 | 0 (0.0%) | 0 (0.0%) |
| $10,000 to $12,499 | 0 (0.0%) | 3 (100.0%) |
| $12,500 to $14,999 | 0 (0.0%) | 0 (0.0%) |
| $15,000 to $17,499 | 0 (0.0%) | 0 (0.0%) |
| $17,500 to $19,999 | 0 (0.0%) | 0 (0.0%) |
| $20,000 to $22,499 | 0 (0.0%) | 0 (0.0%) |
| $22,500 to $24,999 | 0 (0.0%) | 0 (0.0%) |
| $25,000 to $29,999 | 0 (0.0%) | 0 (0.0%) |
| $30,000 to $34,999 | 0 (0.0%) | 0 (0.0%) |
| $35,000 to $39,999 | 18 (64.3%) | 0 (0.0%) |
| $40,000 to $44,999 | 0 (0.0%) | 0 (0.0%) |
| $45,000 to $49,999 | 0 (0.0%) | 0 (0.0%) |
| $50,000 to $54,999 | 0 (0.0%) | 0 (0.0%) |
| $55,000 to $64,999 | 0 (0.0%) | 0 (0.0%) |
| $65,000 to $74,999 | 0 (0.0%) | 0 (0.0%) |
| $75,000 to $99,999 | 0 (0.0%) | 0 (0.0%) |
| $100,000+ | 3 (10.7%) | 0 (0.0%) |
| Total | 28 (100.0%) | 3 (100.0%) |
Earnings by Sex by Educational Attainment in Keswick
| Educational Attainment | Male Income | Female Income |
| Less than High School | - | - |
| High School Diploma | - | - |
| College or Associate's Degree | - | - |
| Bachelor's Degree | - | - |
| Graduate Degree | - | - |
| Total | $38,472 | $0 |
Family Income in Keswick
Family Income Brackets in Keswick
According to the Keswick family income data, there are 18 families falling into the $35,000 to $49,999 income range, which is the most common income bracket and makes up 43.9% of all families.
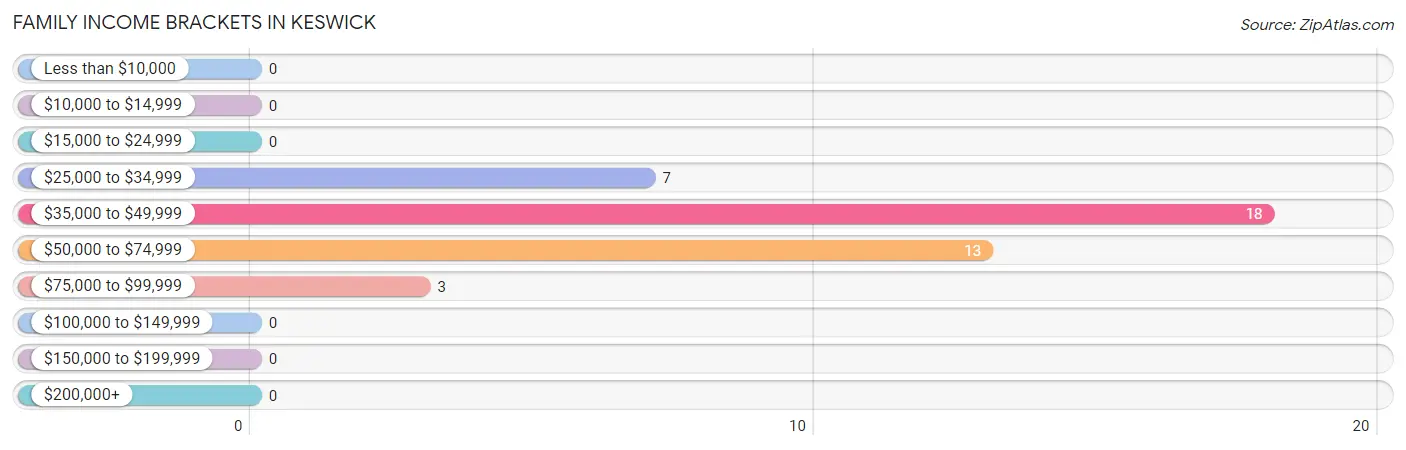
| Income Bracket | # Families | % Families |
| Less than $10,000 | 0 | 0.0% |
| $10,000 to $14,999 | 0 | 0.0% |
| $15,000 to $24,999 | 0 | 0.0% |
| $25,000 to $34,999 | 7 | 17.1% |
| $35,000 to $49,999 | 18 | 43.9% |
| $50,000 to $74,999 | 13 | 31.7% |
| $75,000 to $99,999 | 3 | 7.3% |
| $100,000 to $149,999 | 0 | 0.0% |
| $150,000 to $199,999 | 0 | 0.0% |
| $200,000+ | 0 | 0.0% |
Family Income by Famaliy Size in Keswick
| Income Bracket | # Families | Median Income |
| 2-Person Families | 16 (39.0%) | $0 |
| 3-Person Families | 18 (43.9%) | $0 |
| 4-Person Families | 0 (0.0%) | $0 |
| 5-Person Families | 7 (17.1%) | $0 |
| 6-Person Families | 0 (0.0%) | $0 |
| 7+ Person Families | 0 (0.0%) | $0 |
| Total | 41 (100.0%) | $39,375 |
Family Income by Number of Earners in Keswick
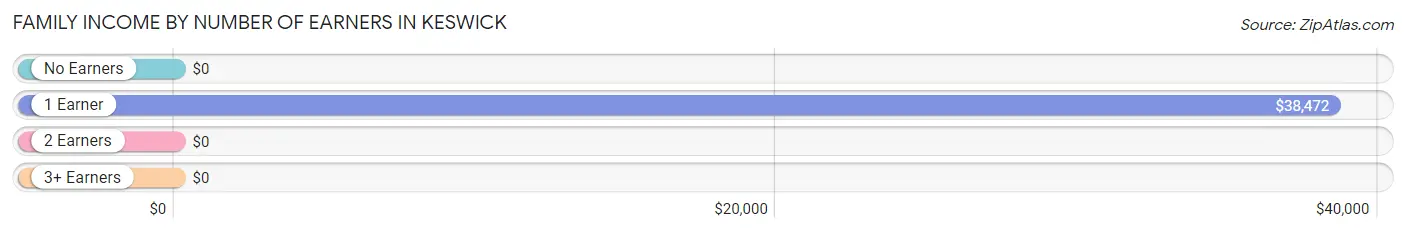
| Number of Earners | # Families | Median Income |
| No Earners | 13 (31.7%) | $0 |
| 1 Earner | 28 (68.3%) | $38,472 |
| 2 Earners | 0 (0.0%) | $0 |
| 3+ Earners | 0 (0.0%) | $0 |
| Total | 41 (100.0%) | $39,375 |
Household Income in Keswick
Household Income Brackets in Keswick
With 18 households falling in the category, the $35,000 to $49,999 income range is the most frequent in Keswick, accounting for 36.0% of all households.
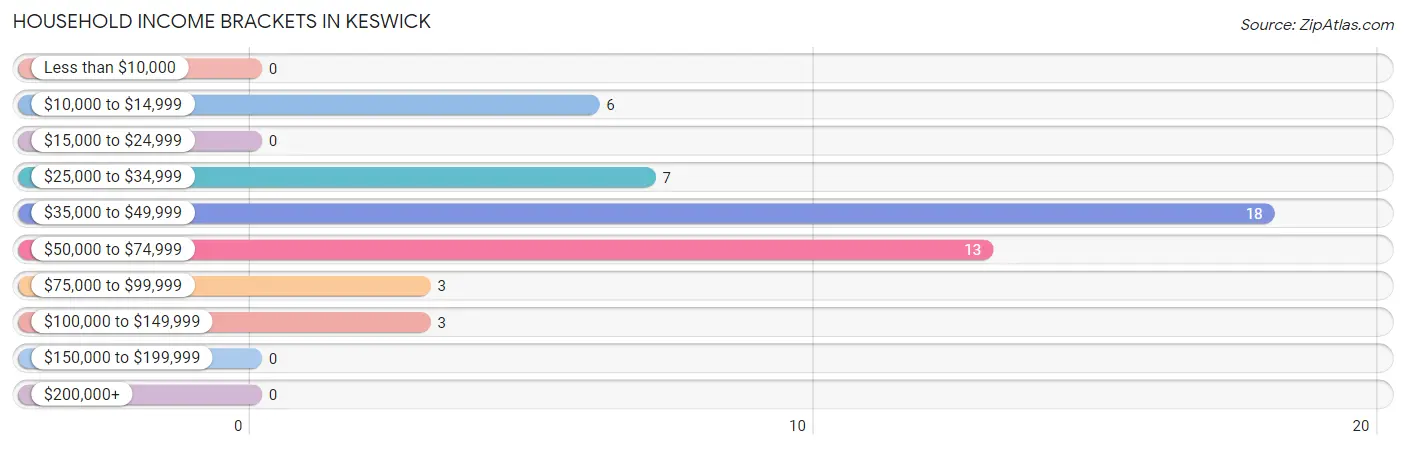
| Income Bracket | # Households | % Households |
| Less than $10,000 | 0 | 0.0% |
| $10,000 to $14,999 | 6 | 12.0% |
| $15,000 to $24,999 | 0 | 0.0% |
| $25,000 to $34,999 | 7 | 14.0% |
| $35,000 to $49,999 | 18 | 36.0% |
| $50,000 to $74,999 | 13 | 26.0% |
| $75,000 to $99,999 | 3 | 6.0% |
| $100,000 to $149,999 | 3 | 6.0% |
| $150,000 to $199,999 | 0 | 0.0% |
| $200,000+ | 0 | 0.0% |
Household Income by Householder Age in Keswick
The median household income in Keswick is $39,167, with the highest median household income of $38,750 found in the 45 to 64 years age bracket for the primary householder. A total of 30 households (60.0%) fall into this category.
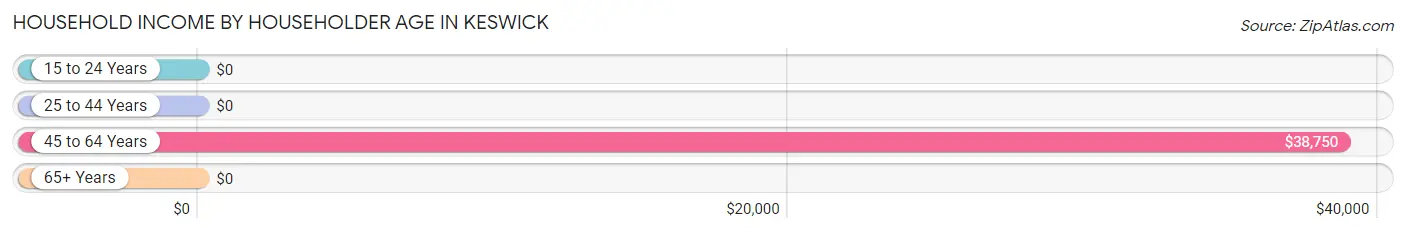
| Income Bracket | # Households | Median Income |
| 15 to 24 Years | 0 (0.0%) | $0 |
| 25 to 44 Years | 0 (0.0%) | $0 |
| 45 to 64 Years | 30 (60.0%) | $38,750 |
| 65+ Years | 20 (40.0%) | $0 |
| Total | 50 (100.0%) | $39,167 |
Poverty in Keswick
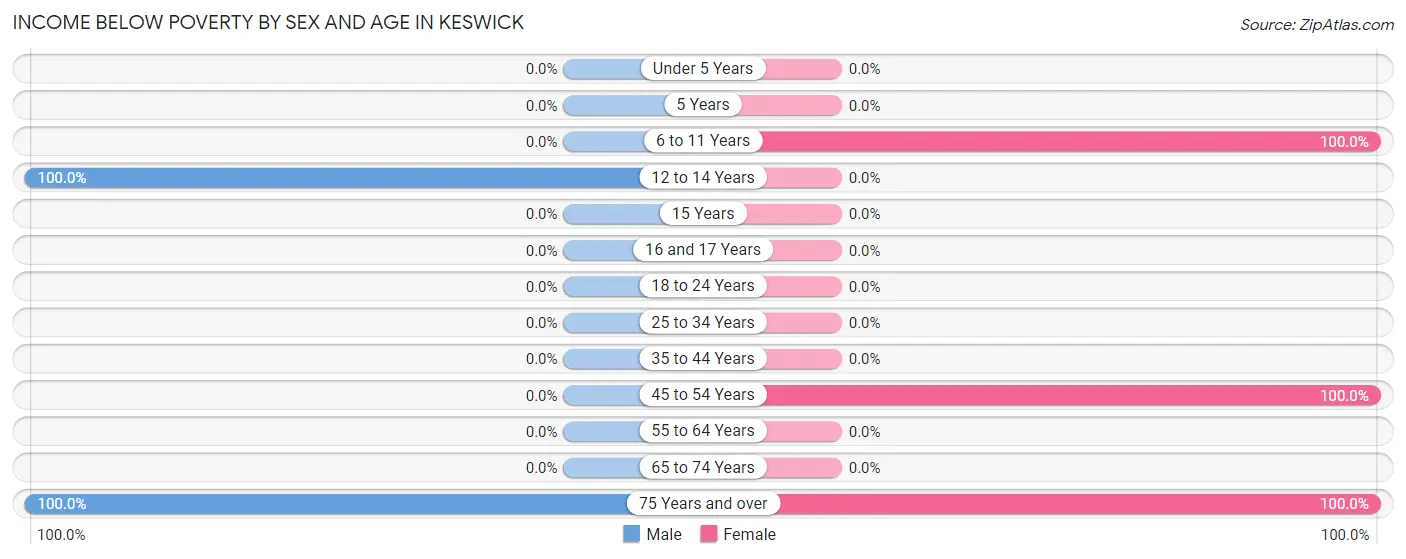
Income Below Poverty by Sex and Age in Keswick
With 29.8% poverty level for males and 40.7% for females among the residents of Keswick, 12 to 14 year old males and 6 to 11 year old females are the most vulnerable to poverty, with 18 males (100.0%) and 9 females (100.0%) in their respective age groups living below the poverty level.
| Age Bracket | Male | Female |
| Under 5 Years | 0 (0.0%) | 0 (0.0%) |
| 5 Years | 0 (0.0%) | 0 (0.0%) |
| 6 to 11 Years | 0 (0.0%) | 9 (100.0%) |
| 12 to 14 Years | 18 (100.0%) | 0 (0.0%) |
| 15 Years | 0 (0.0%) | 0 (0.0%) |
| 16 and 17 Years | 0 (0.0%) | 0 (0.0%) |
| 18 to 24 Years | 0 (0.0%) | 0 (0.0%) |
| 25 to 34 Years | 0 (0.0%) | 0 (0.0%) |
| 35 to 44 Years | 0 (0.0%) | 0 (0.0%) |
| 45 to 54 Years | 0 (0.0%) | 6 (100.0%) |
| 55 to 64 Years | 0 (0.0%) | 0 (0.0%) |
| 65 to 74 Years | 0 (0.0%) | 0 (0.0%) |
| 75 Years and over | 7 (100.0%) | 7 (100.0%) |
| Total | 25 (29.8%) | 22 (40.7%) |
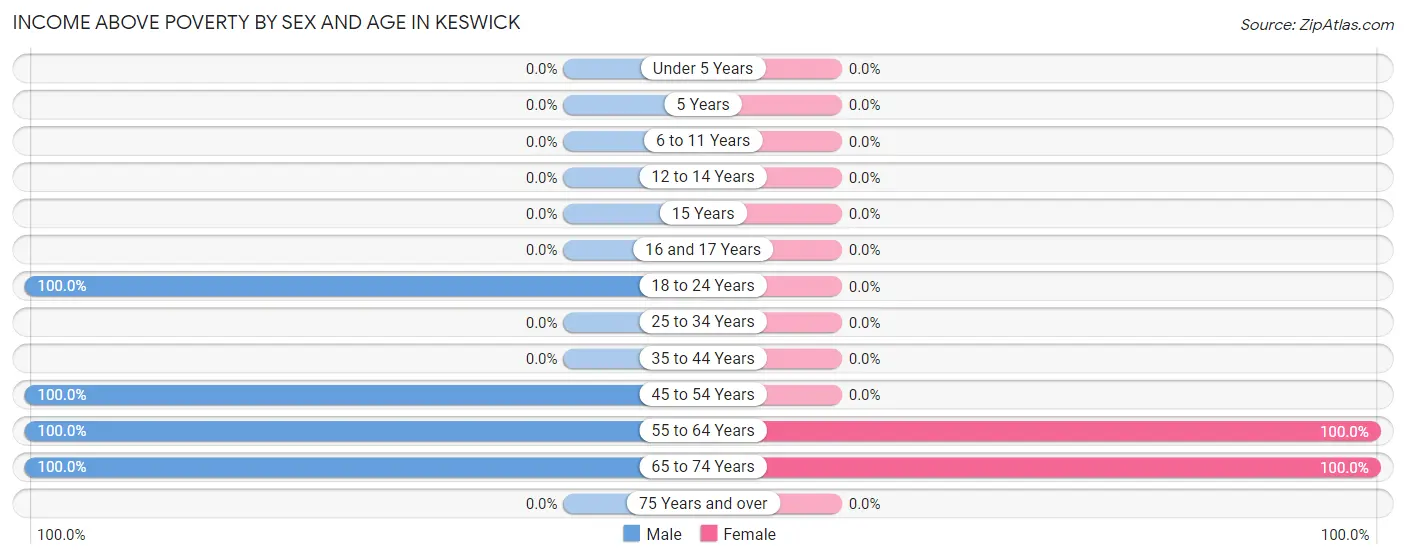
Income Above Poverty by Sex and Age in Keswick
According to the poverty statistics in Keswick, males aged 18 to 24 years and females aged 55 to 64 years are the age groups that are most secure financially, with 100.0% of males and 100.0% of females in these age groups living above the poverty line.
| Age Bracket | Male | Female |
| Under 5 Years | 0 (0.0%) | 0 (0.0%) |
| 5 Years | 0 (0.0%) | 0 (0.0%) |
| 6 to 11 Years | 0 (0.0%) | 0 (0.0%) |
| 12 to 14 Years | 0 (0.0%) | 0 (0.0%) |
| 15 Years | 0 (0.0%) | 0 (0.0%) |
| 16 and 17 Years | 0 (0.0%) | 0 (0.0%) |
| 18 to 24 Years | 20 (100.0%) | 0 (0.0%) |
| 25 to 34 Years | 0 (0.0%) | 0 (0.0%) |
| 35 to 44 Years | 0 (0.0%) | 0 (0.0%) |
| 45 to 54 Years | 18 (100.0%) | 0 (0.0%) |
| 55 to 64 Years | 6 (100.0%) | 19 (100.0%) |
| 65 to 74 Years | 15 (100.0%) | 13 (100.0%) |
| 75 Years and over | 0 (0.0%) | 0 (0.0%) |
| Total | 59 (70.2%) | 32 (59.3%) |
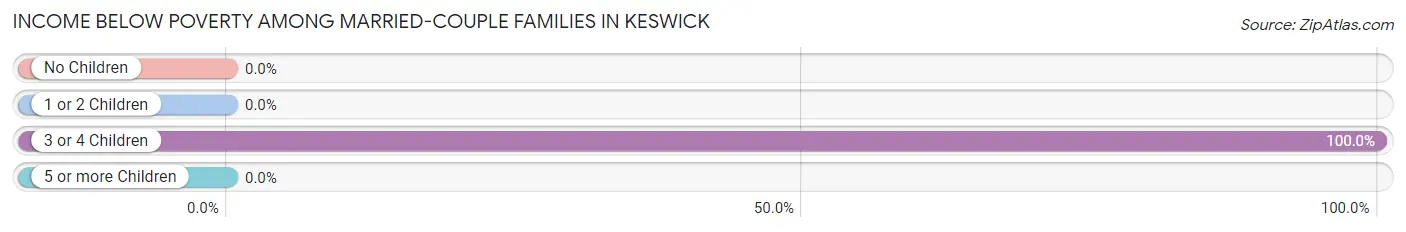
Income Below Poverty Among Married-Couple Families in Keswick
The poverty statistics for married-couple families in Keswick show that 17.1% or 7 of the total 41 families live below the poverty line. Families with 3 or 4 children have the highest poverty rate of 100.0%, comprising of 7 families. On the other hand, families with no children have the lowest poverty rate of 0.0%, which includes 0 families.
| Children | Above Poverty | Below Poverty |
| No Children | 34 (100.0%) | 0 (0.0%) |
| 1 or 2 Children | 0 (0.0%) | 0 (0.0%) |
| 3 or 4 Children | 0 (0.0%) | 7 (100.0%) |
| 5 or more Children | 0 (0.0%) | 0 (0.0%) |
| Total | 34 (82.9%) | 7 (17.1%) |
Income Below Poverty Among Single-Parent Households in Keswick
| Children | Single Father | Single Mother |
| No Children | 0 (0.0%) | 0 (0.0%) |
| 1 or 2 Children | 0 (0.0%) | 0 (0.0%) |
| 3 or 4 Children | 0 (0.0%) | 0 (0.0%) |
| 5 or more Children | 0 (0.0%) | 0 (0.0%) |
| Total | 0 (0.0%) | 0 (0.0%) |
Income Below Poverty Among Married-Couple vs Single-Parent Households in Keswick
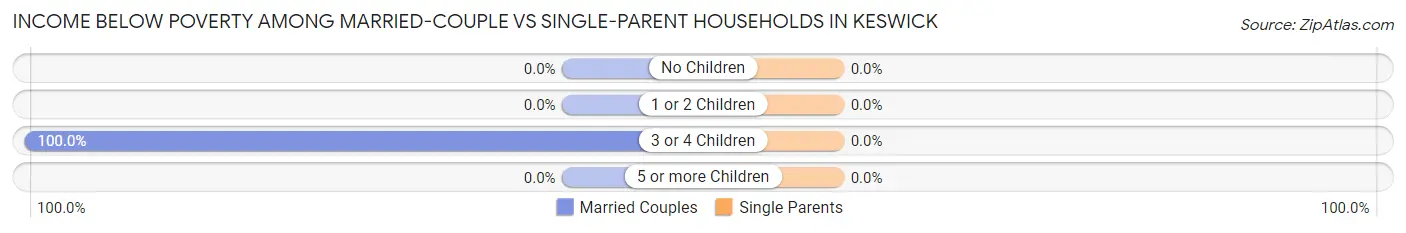
| Children | Married-Couple Families | Single-Parent Households |
| No Children | 0 (0.0%) | 0 (0.0%) |
| 1 or 2 Children | 0 (0.0%) | 0 (0.0%) |
| 3 or 4 Children | 7 (100.0%) | 0 (0.0%) |
| 5 or more Children | 0 (0.0%) | 0 (0.0%) |
| Total | 7 (17.1%) | 0 (0.0%) |
Race in Keswick
The most populous races in Keswick are , and White / Caucasian (138 | 100.0%).
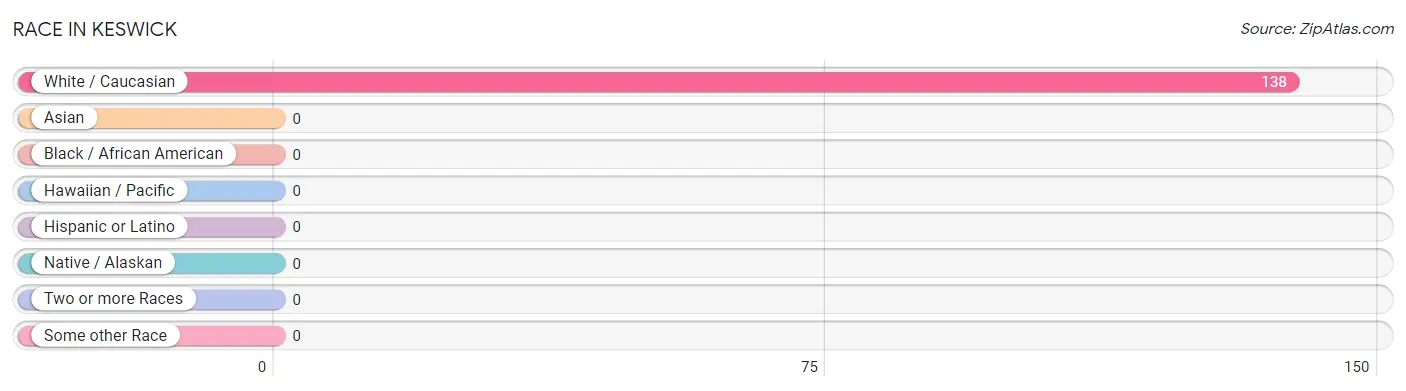
| Race | # Population | % Population |
| Asian | 0 | 0.0% |
| Black / African American | 0 | 0.0% |
| Hawaiian / Pacific | 0 | 0.0% |
| Hispanic or Latino | 0 | 0.0% |
| Native / Alaskan | 0 | 0.0% |
| White / Caucasian | 138 | 100.0% |
| Two or more Races | 0 | 0.0% |
| Some other Race | 0 | 0.0% |
| Total | 138 | 100.0% |
Ancestry in Keswick
The most populous ancestries reported in Keswick are Irish (69 | 50.0%), German (13 | 9.4%), American (6 | 4.3%), Norwegian (6 | 4.3%), and English (3 | 2.2%), together accounting for 70.3% of all Keswick residents.
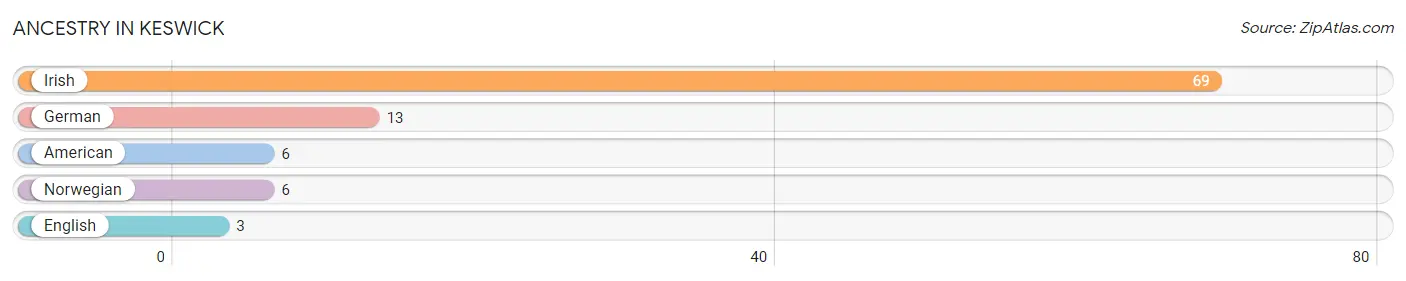
| Ancestry | # Population | % Population |
| American | 6 | 4.3% |
| English | 3 | 2.2% |
| German | 13 | 9.4% |
| Irish | 69 | 50.0% |
| Norwegian | 6 | 4.3% | View All 5 Rows |
Immigrants in Keswick

| Immigration Origin | # Population | % Population | View All 0 Rows |
Sex and Age in Keswick
Sex and Age in Keswick
The most populous age groups in Keswick are 20 to 24 Years (20 | 23.8%) for men and 55 to 59 Years (16 | 29.6%) for women.
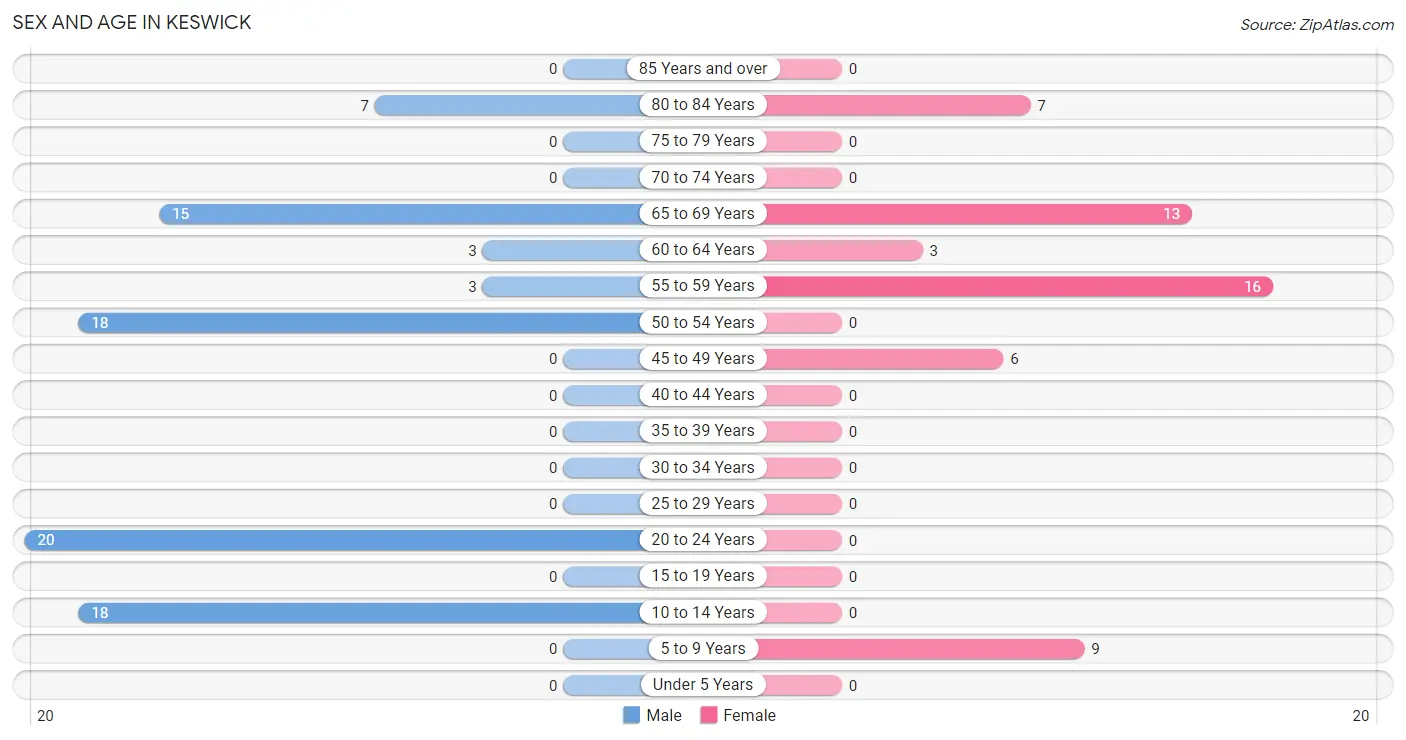
| Age Bracket | Male | Female |
| Under 5 Years | 0 (0.0%) | 0 (0.0%) |
| 5 to 9 Years | 0 (0.0%) | 9 (16.7%) |
| 10 to 14 Years | 18 (21.4%) | 0 (0.0%) |
| 15 to 19 Years | 0 (0.0%) | 0 (0.0%) |
| 20 to 24 Years | 20 (23.8%) | 0 (0.0%) |
| 25 to 29 Years | 0 (0.0%) | 0 (0.0%) |
| 30 to 34 Years | 0 (0.0%) | 0 (0.0%) |
| 35 to 39 Years | 0 (0.0%) | 0 (0.0%) |
| 40 to 44 Years | 0 (0.0%) | 0 (0.0%) |
| 45 to 49 Years | 0 (0.0%) | 6 (11.1%) |
| 50 to 54 Years | 18 (21.4%) | 0 (0.0%) |
| 55 to 59 Years | 3 (3.6%) | 16 (29.6%) |
| 60 to 64 Years | 3 (3.6%) | 3 (5.6%) |
| 65 to 69 Years | 15 (17.9%) | 13 (24.1%) |
| 70 to 74 Years | 0 (0.0%) | 0 (0.0%) |
| 75 to 79 Years | 0 (0.0%) | 0 (0.0%) |
| 80 to 84 Years | 7 (8.3%) | 7 (13.0%) |
| 85 Years and over | 0 (0.0%) | 0 (0.0%) |
| Total | 84 (100.0%) | 54 (100.0%) |
Families and Households in Keswick
Median Family Size in Keswick
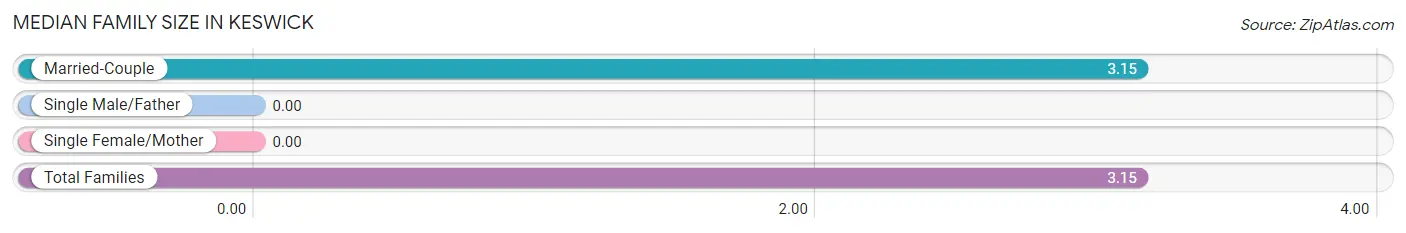
| Family Type | # Families | Family Size |
| Married-Couple | 41 (100.0%) | 3.15 |
| Single Male/Father | 0 (0.0%) | - |
| Single Female/Mother | 0 (0.0%) | - |
| Total Families | 41 (100.0%) | 3.15 |
Median Household Size in Keswick
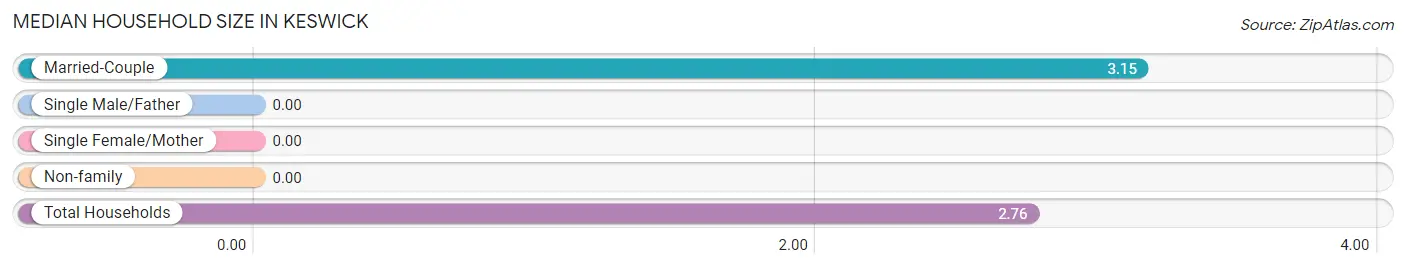
| Household Type | # Households | Household Size |
| Married-Couple | 41 (82.0%) | 3.15 |
| Single Male/Father | 0 (0.0%) | - |
| Single Female/Mother | 0 (0.0%) | - |
| Non-family | 9 (18.0%) | - |
| Total Households | 50 (100.0%) | 2.76 |
Household Size by Marriage Status in Keswick
Out of a total of 50 households in Keswick, 41 (82.0%) are family households, while 9 (18.0%) are nonfamily households. The most numerous type of family households are 3-person households, comprising 18, and the most common type of nonfamily households are 1-person households, comprising 9.
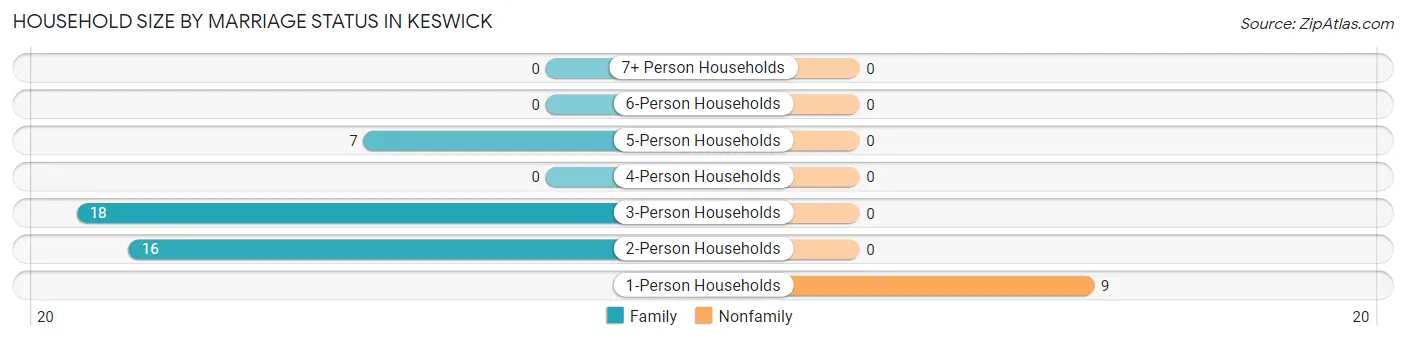
| Household Size | Family Households | Nonfamily Households |
| 1-Person Households | - | 9 (18.0%) |
| 2-Person Households | 16 (32.0%) | 0 (0.0%) |
| 3-Person Households | 18 (36.0%) | 0 (0.0%) |
| 4-Person Households | 0 (0.0%) | 0 (0.0%) |
| 5-Person Households | 7 (14.0%) | 0 (0.0%) |
| 6-Person Households | 0 (0.0%) | 0 (0.0%) |
| 7+ Person Households | 0 (0.0%) | 0 (0.0%) |
| Total | 41 (82.0%) | 9 (18.0%) |
Female Fertility in Keswick
Fertility by Age in Keswick
| Age Bracket | Women with Births | Births / 1,000 Women |
| 15 to 19 years | 0 (0.0%) | 0.0 |
| 20 to 34 years | 0 (0.0%) | 0.0 |
| 35 to 50 years | 0 (0.0%) | 0.0 |
| Total | 0 (0.0%) | 0.0 |
Fertility by Age by Marriage Status in Keswick
| Age Bracket | Married | Unmarried |
| 15 to 19 years | 0 (0.0%) | 0 (0.0%) |
| 20 to 34 years | 0 (0.0%) | 0 (0.0%) |
| 35 to 50 years | 0 (0.0%) | 0 (0.0%) |
| Total | 0 (0.0%) | 0 (0.0%) |
Fertility by Education in Keswick
| Educational Attainment | Women with Births | Births / 1,000 Women |
| Less than High School | 0 (0.0%) | 0.0 |
| High School Diploma | 0 (0.0%) | 0.0 |
| College or Associate's Degree | 0 (0.0%) | 0.0 |
| Bachelor's Degree | 0 (0.0%) | 0.0 |
| Graduate Degree | 0 (0.0%) | 0.0 |
| Total | 0 (0.0%) | 0.0 |
Fertility by Education by Marriage Status in Keswick
| Educational Attainment | Married | Unmarried |
| Less than High School | 0 (0.0%) | 0 (0.0%) |
| High School Diploma | 0 (0.0%) | 0 (0.0%) |
| College or Associate's Degree | 0 (0.0%) | 0 (0.0%) |
| Bachelor's Degree | 0 (0.0%) | 0 (0.0%) |
| Graduate Degree | 0 (0.0%) | 0 (0.0%) |
| Total | 0 (0.0%) | 0 (0.0%) |
Employment Characteristics in Keswick
Employment by Class of Employer in Keswick
Among the 21 employed individuals in Keswick, private company employees (18 | 85.7%), and local government employees (3 | 14.3%) make up the most common classes of employment.
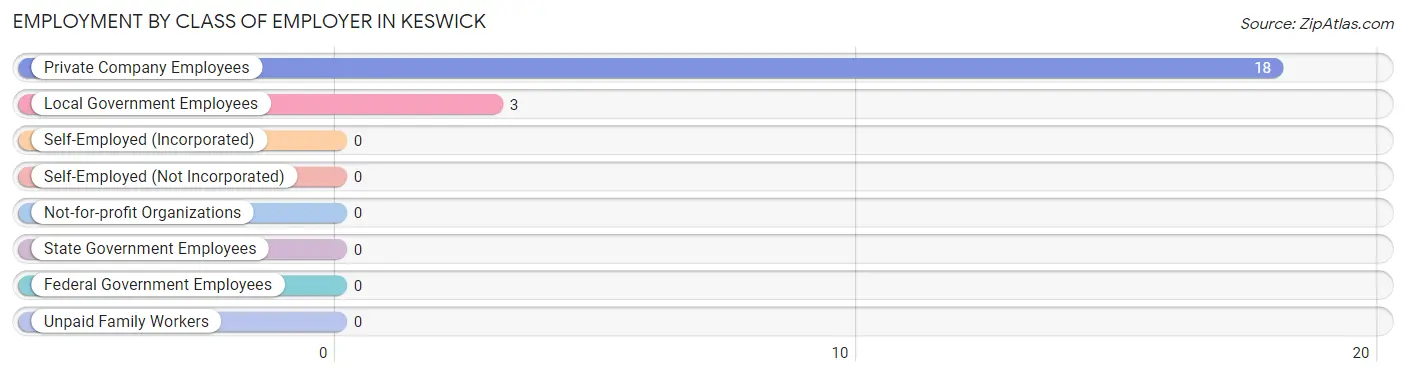
| Employer Class | # Employees | % Employees |
| Private Company Employees | 18 | 85.7% |
| Self-Employed (Incorporated) | 0 | 0.0% |
| Self-Employed (Not Incorporated) | 0 | 0.0% |
| Not-for-profit Organizations | 0 | 0.0% |
| Local Government Employees | 3 | 14.3% |
| State Government Employees | 0 | 0.0% |
| Federal Government Employees | 0 | 0.0% |
| Unpaid Family Workers | 0 | 0.0% |
| Total | 21 | 100.0% |
Employment Status by Age in Keswick
According to the labor force statistics for Keswick, out of the total population over 16 years of age (111), 27.0% or 30 individuals are in the labor force, with 20.0% or 6 of them unemployed. The age group with the highest labor force participation rate is 45 to 54 years, with 100.0% or 24 individuals in the labor force. Within the labor force, the 45 to 54 years age range has the highest percentage of unemployed individuals, with 25.0% or 6 of them being unemployed.
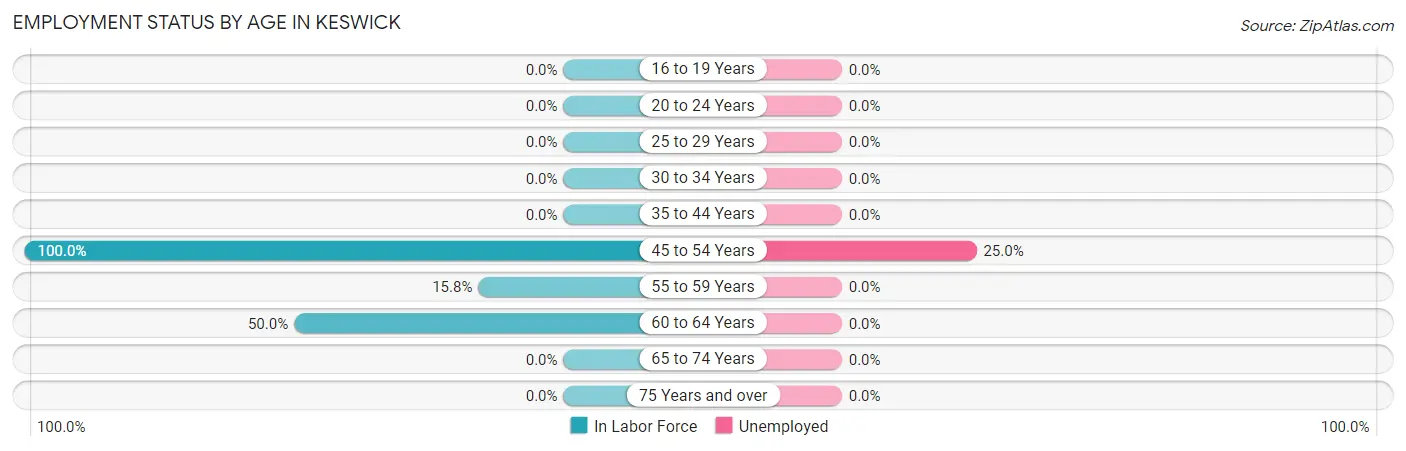
| Age Bracket | In Labor Force | Unemployed |
| 16 to 19 Years | 0 (0.0%) | 0 (0.0%) |
| 20 to 24 Years | 0 (0.0%) | 0 (0.0%) |
| 25 to 29 Years | 0 (0.0%) | 0 (0.0%) |
| 30 to 34 Years | 0 (0.0%) | 0 (0.0%) |
| 35 to 44 Years | 0 (0.0%) | 0 (0.0%) |
| 45 to 54 Years | 24 (100.0%) | 6 (25.0%) |
| 55 to 59 Years | 3 (15.8%) | 0 (0.0%) |
| 60 to 64 Years | 3 (50.0%) | 0 (0.0%) |
| 65 to 74 Years | 0 (0.0%) | 0 (0.0%) |
| 75 Years and over | 0 (0.0%) | 0 (0.0%) |
| Total | 30 (27.0%) | 6 (20.0%) |
Employment Status by Educational Attainment in Keswick
According to labor force statistics for Keswick, 61.2% of individuals (30) out of the total population between 25 and 64 years of age (49) are in the labor force, with 20.0% or 6 of them being unemployed. The group with the highest labor force participation rate are those with the educational attainment of bachelor's degree or higher, with 100.0% or 3 individuals in the labor force. Within the labor force, individuals with high school diploma education have the highest percentage of unemployment, with 22.2% or 6 of them being unemployed.
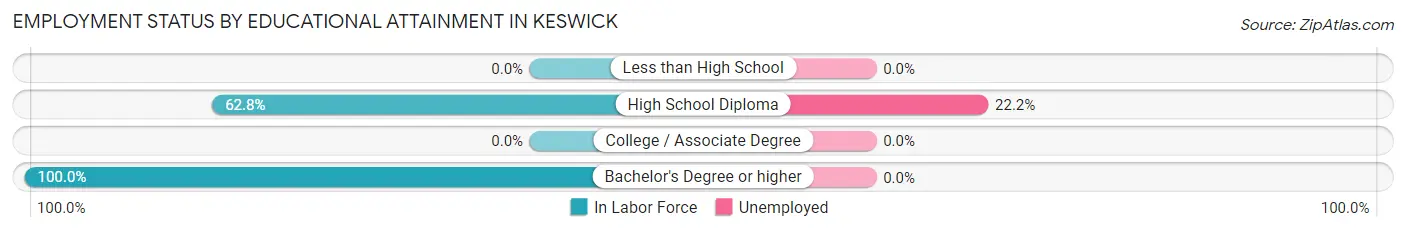
| Educational Attainment | In Labor Force | Unemployed |
| Less than High School | 0 (0.0%) | 0 (0.0%) |
| High School Diploma | 27 (62.8%) | 10 (22.2%) |
| College / Associate Degree | 0 (0.0%) | 0 (0.0%) |
| Bachelor's Degree or higher | 3 (100.0%) | 0 (0.0%) |
| Total | 30 (61.2%) | 10 (20.0%) |
Employment Occupations by Sex in Keswick
Management, Business, Science and Arts Occupations
The most common Management, Business, Science and Arts occupations in Keswick are Community & Social Service (3 | 12.5%), and Education, Arts & Media (3 | 12.5%).
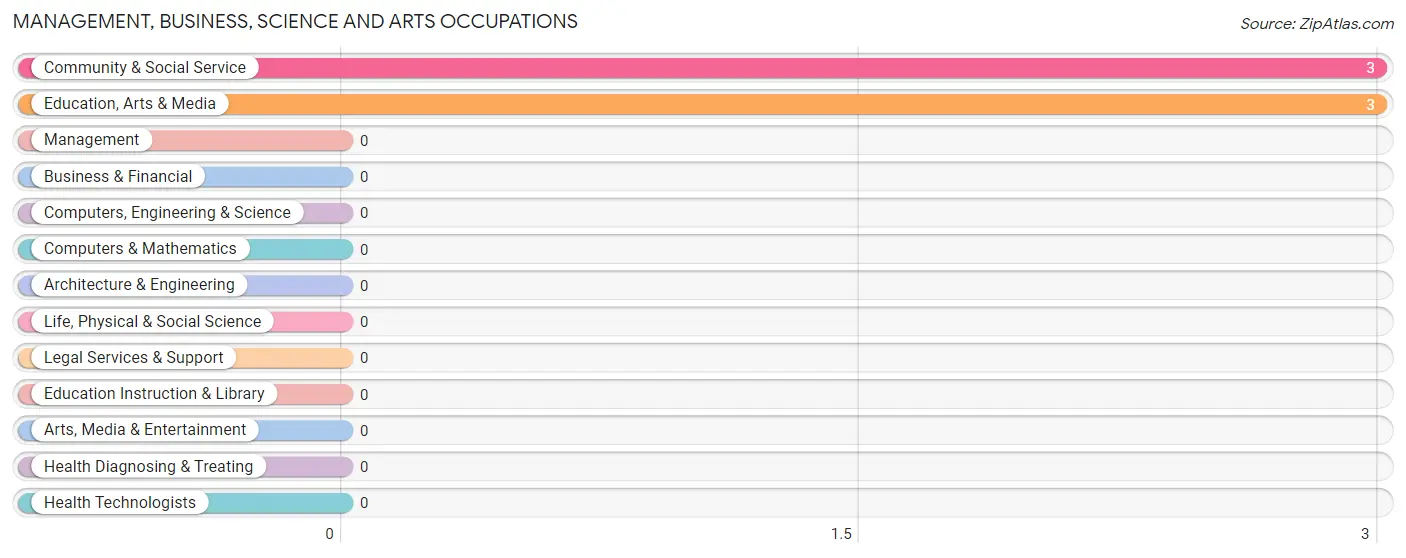
Management, Business, Science and Arts Occupations by Sex
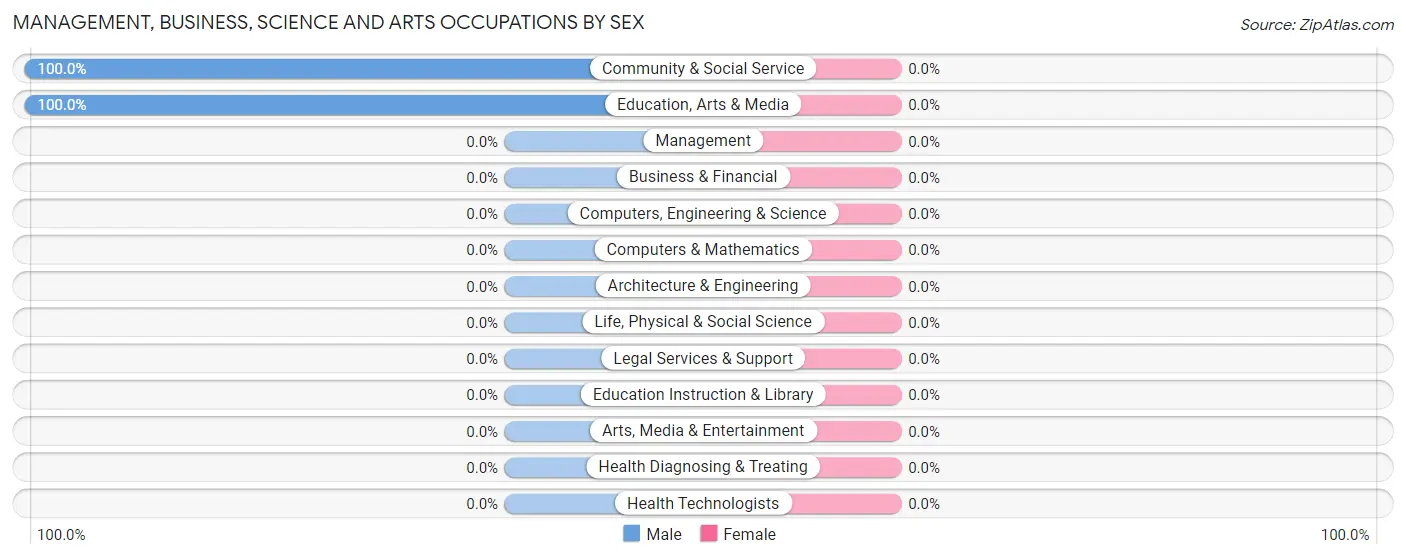
| Occupation | Male | Female |
| Management | 0 (0.0%) | 0 (0.0%) |
| Business & Financial | 0 (0.0%) | 0 (0.0%) |
| Computers, Engineering & Science | 0 (0.0%) | 0 (0.0%) |
| Computers & Mathematics | 0 (0.0%) | 0 (0.0%) |
| Architecture & Engineering | 0 (0.0%) | 0 (0.0%) |
| Life, Physical & Social Science | 0 (0.0%) | 0 (0.0%) |
| Community & Social Service | 3 (100.0%) | 0 (0.0%) |
| Education, Arts & Media | 3 (100.0%) | 0 (0.0%) |
| Legal Services & Support | 0 (0.0%) | 0 (0.0%) |
| Education Instruction & Library | 0 (0.0%) | 0 (0.0%) |
| Arts, Media & Entertainment | 0 (0.0%) | 0 (0.0%) |
| Health Diagnosing & Treating | 0 (0.0%) | 0 (0.0%) |
| Health Technologists | 0 (0.0%) | 0 (0.0%) |
| Total (Category) | 3 (100.0%) | 0 (0.0%) |
| Total (Overall) | 21 (87.5%) | 3 (12.5%) |
Services Occupations
The most common Services occupations in Keswick are , and Cleaning & Maintenance (18 | 75.0%).
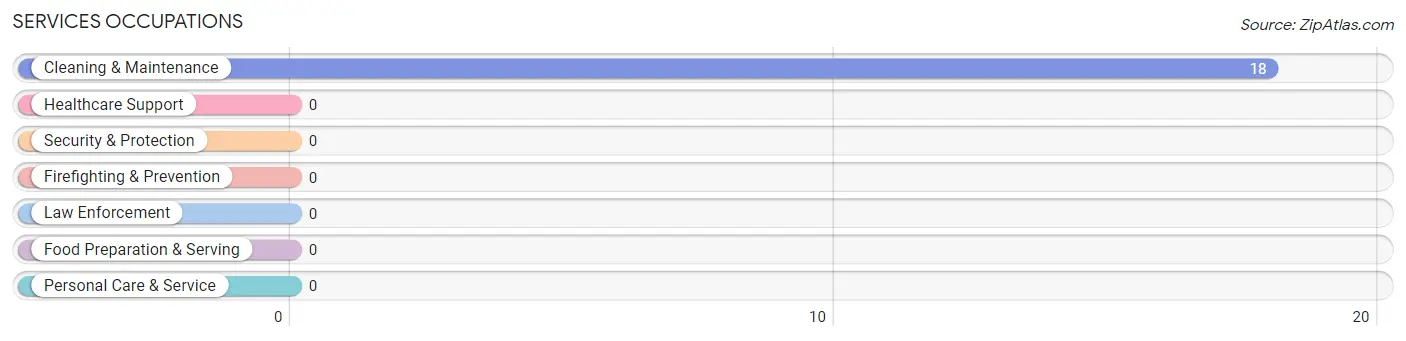
Services Occupations by Sex
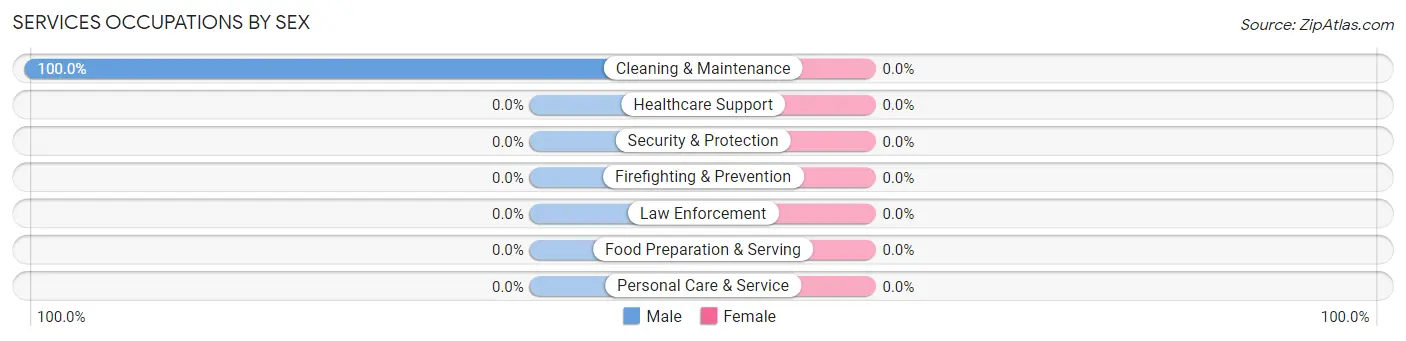
| Occupation | Male | Female |
| Healthcare Support | 0 (0.0%) | 0 (0.0%) |
| Security & Protection | 0 (0.0%) | 0 (0.0%) |
| Firefighting & Prevention | 0 (0.0%) | 0 (0.0%) |
| Law Enforcement | 0 (0.0%) | 0 (0.0%) |
| Food Preparation & Serving | 0 (0.0%) | 0 (0.0%) |
| Cleaning & Maintenance | 18 (100.0%) | 0 (0.0%) |
| Personal Care & Service | 0 (0.0%) | 0 (0.0%) |
| Total (Category) | 18 (100.0%) | 0 (0.0%) |
| Total (Overall) | 21 (87.5%) | 3 (12.5%) |
Sales and Office Occupations
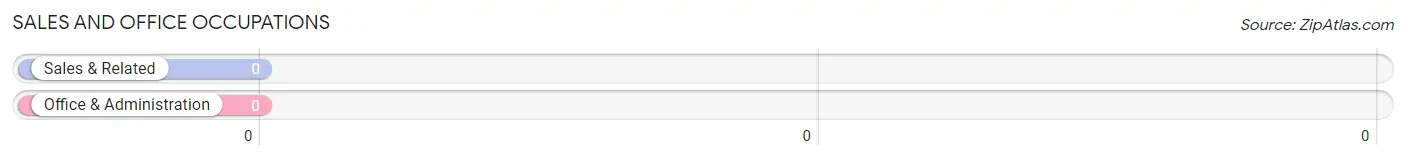
Sales and Office Occupations by Sex
| Occupation | Male | Female |
| Sales & Related | 0 (0.0%) | 0 (0.0%) |
| Office & Administration | 0 (0.0%) | 0 (0.0%) |
| Total (Category) | 0 (0.0%) | 0 (0.0%) |
| Total (Overall) | 21 (87.5%) | 3 (12.5%) |
Natural Resources, Construction and Maintenance Occupations
Natural Resources, Construction and Maintenance Occupations by Sex
| Occupation | Male | Female |
| Farming, Fishing & Forestry | 0 (0.0%) | 0 (0.0%) |
| Construction & Extraction | 0 (0.0%) | 0 (0.0%) |
| Installation, Maintenance & Repair | 0 (0.0%) | 0 (0.0%) |
| Total (Category) | 0 (0.0%) | 0 (0.0%) |
| Total (Overall) | 21 (87.5%) | 3 (12.5%) |
Production, Transportation and Moving Occupations
The most common Production, Transportation and Moving occupations in Keswick are , and Transportation (3 | 12.5%).
Production, Transportation and Moving Occupations by Sex
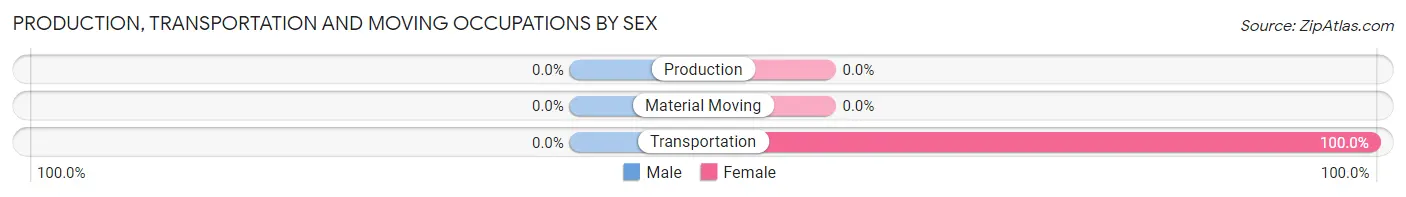
| Occupation | Male | Female |
| Production | 0 (0.0%) | 0 (0.0%) |
| Transportation | 0 (0.0%) | 3 (100.0%) |
| Material Moving | 0 (0.0%) | 0 (0.0%) |
| Total (Category) | 0 (0.0%) | 3 (100.0%) |
| Total (Overall) | 21 (87.5%) | 3 (12.5%) |
Employment Industries by Sex in Keswick
Employment Industries in Keswick
The major employment industries in Keswick include Administrative & Support (18 | 75.0%), Educational Services (3 | 12.5%), and Public Administration (3 | 12.5%).
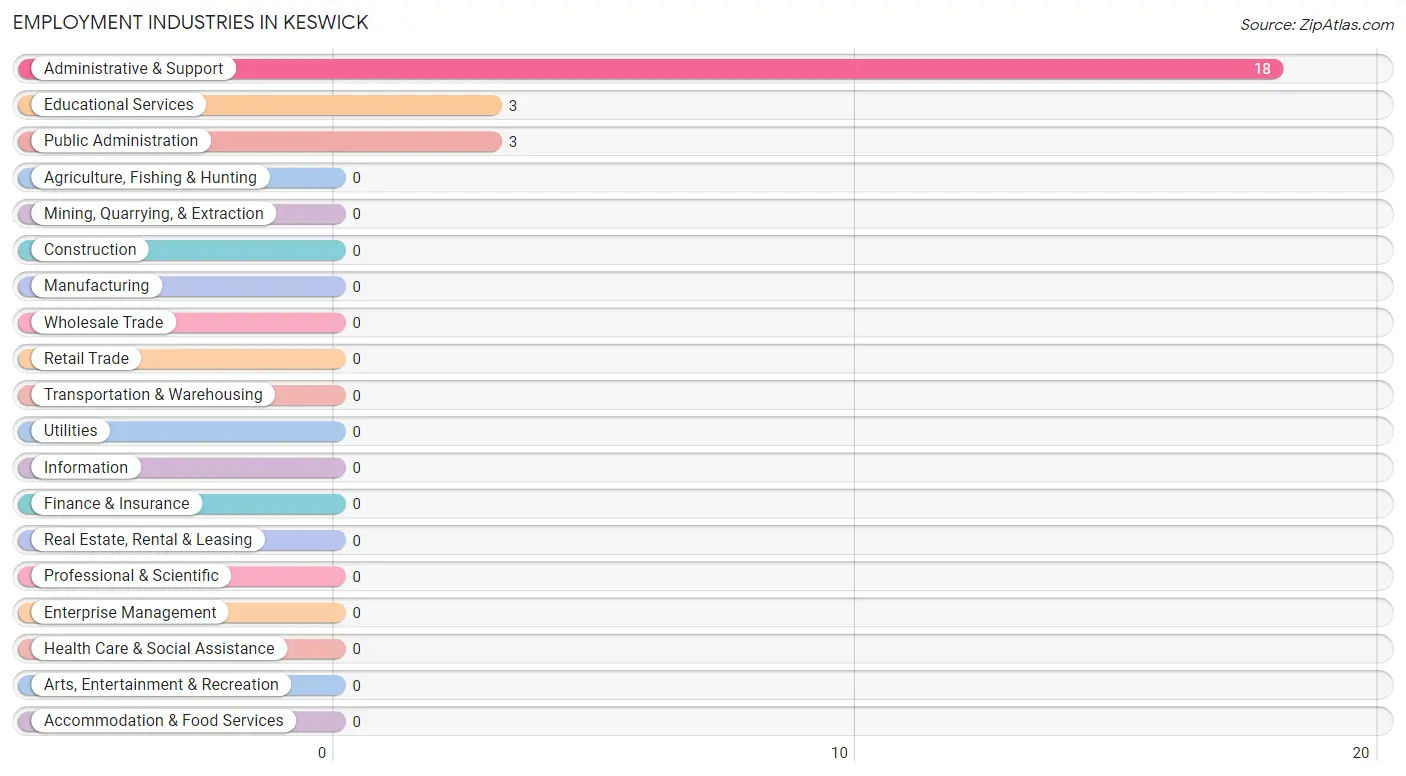
Employment Industries by Sex in Keswick
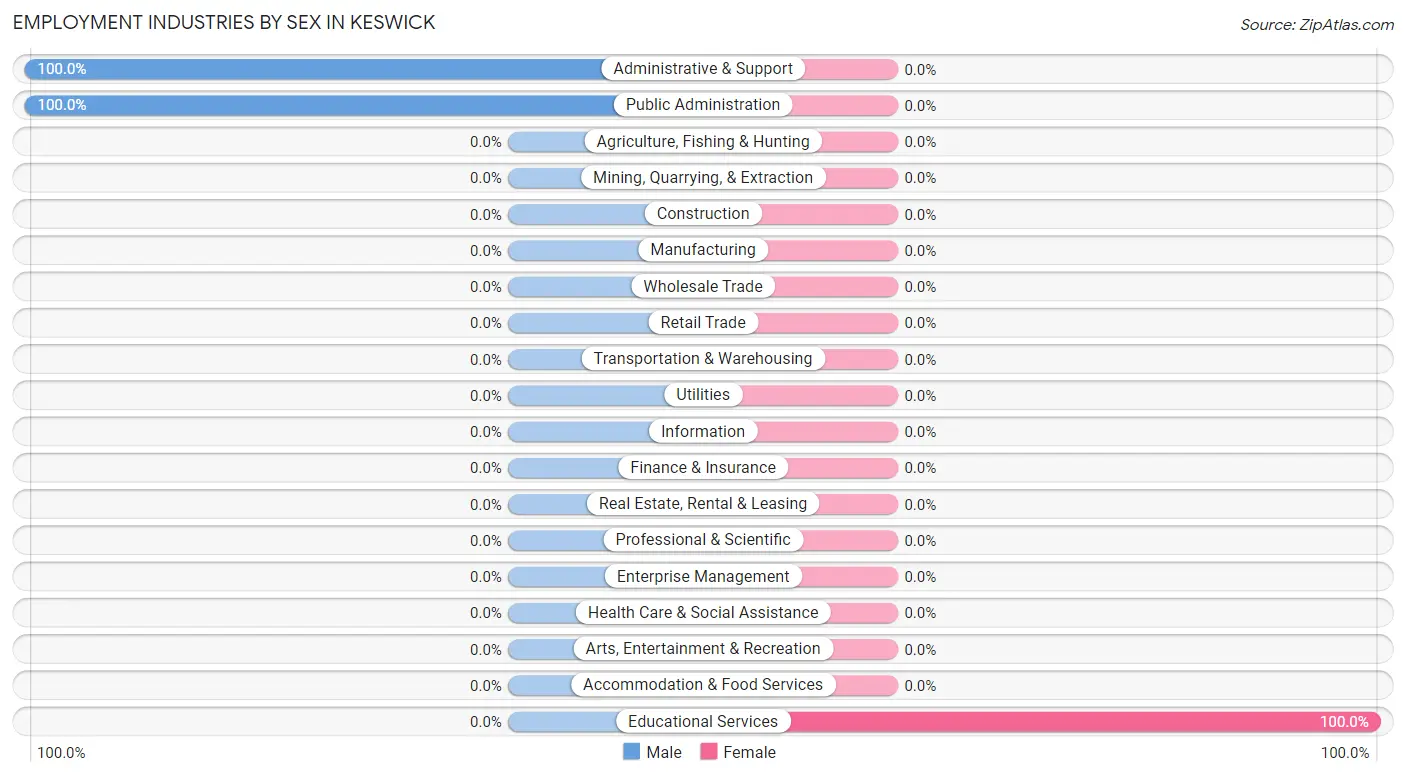
| Industry | Male | Female |
| Agriculture, Fishing & Hunting | 0 (0.0%) | 0 (0.0%) |
| Mining, Quarrying, & Extraction | 0 (0.0%) | 0 (0.0%) |
| Construction | 0 (0.0%) | 0 (0.0%) |
| Manufacturing | 0 (0.0%) | 0 (0.0%) |
| Wholesale Trade | 0 (0.0%) | 0 (0.0%) |
| Retail Trade | 0 (0.0%) | 0 (0.0%) |
| Transportation & Warehousing | 0 (0.0%) | 0 (0.0%) |
| Utilities | 0 (0.0%) | 0 (0.0%) |
| Information | 0 (0.0%) | 0 (0.0%) |
| Finance & Insurance | 0 (0.0%) | 0 (0.0%) |
| Real Estate, Rental & Leasing | 0 (0.0%) | 0 (0.0%) |
| Professional & Scientific | 0 (0.0%) | 0 (0.0%) |
| Enterprise Management | 0 (0.0%) | 0 (0.0%) |
| Administrative & Support | 18 (100.0%) | 0 (0.0%) |
| Educational Services | 0 (0.0%) | 3 (100.0%) |
| Health Care & Social Assistance | 0 (0.0%) | 0 (0.0%) |
| Arts, Entertainment & Recreation | 0 (0.0%) | 0 (0.0%) |
| Accommodation & Food Services | 0 (0.0%) | 0 (0.0%) |
| Public Administration | 3 (100.0%) | 0 (0.0%) |
| Total | 21 (87.5%) | 3 (12.5%) |
Education in Keswick
School Enrollment in Keswick
The most common levels of schooling among the 27 students in Keswick are middle school (18 | 66.7%), and elementary school (9 | 33.3%).
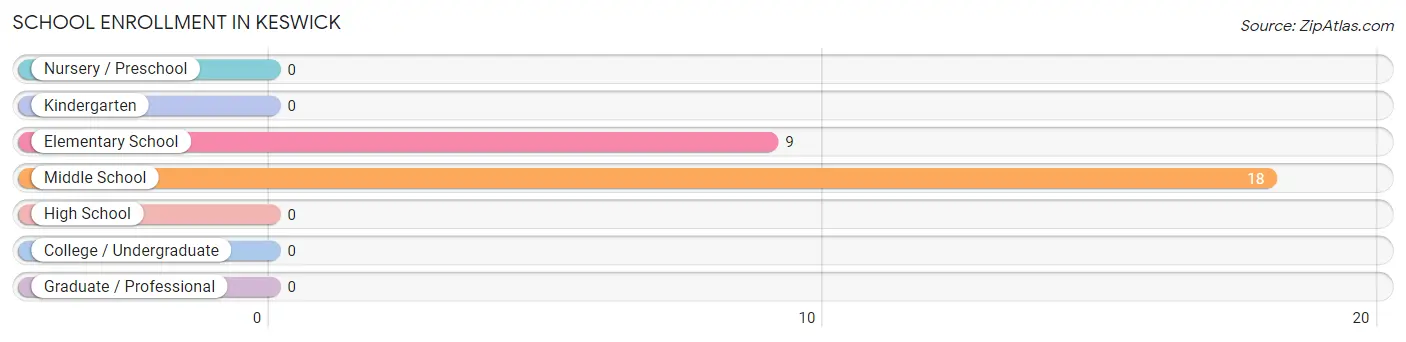
| School Level | # Students | % Students |
| Nursery / Preschool | 0 | 0.0% |
| Kindergarten | 0 | 0.0% |
| Elementary School | 9 | 33.3% |
| Middle School | 18 | 66.7% |
| High School | 0 | 0.0% |
| College / Undergraduate | 0 | 0.0% |
| Graduate / Professional | 0 | 0.0% |
| Total | 27 | 100.0% |
School Enrollment by Age by Funding Source in Keswick
Out of a total of 27 students who are enrolled in schools in Keswick, 18 (66.7%) attend a private institution, while the remaining 9 (33.3%) are enrolled in public schools. The age group of 5 to 9 year old has the highest likelihood of being enrolled in private schools, with 9 (100.0% in the age bracket) enrolled. Conversely, the age group of 10 to 14 year olds has the lowest likelihood of being enrolled in a private school, with 9 (50.0% in the age bracket) attending a public institution.
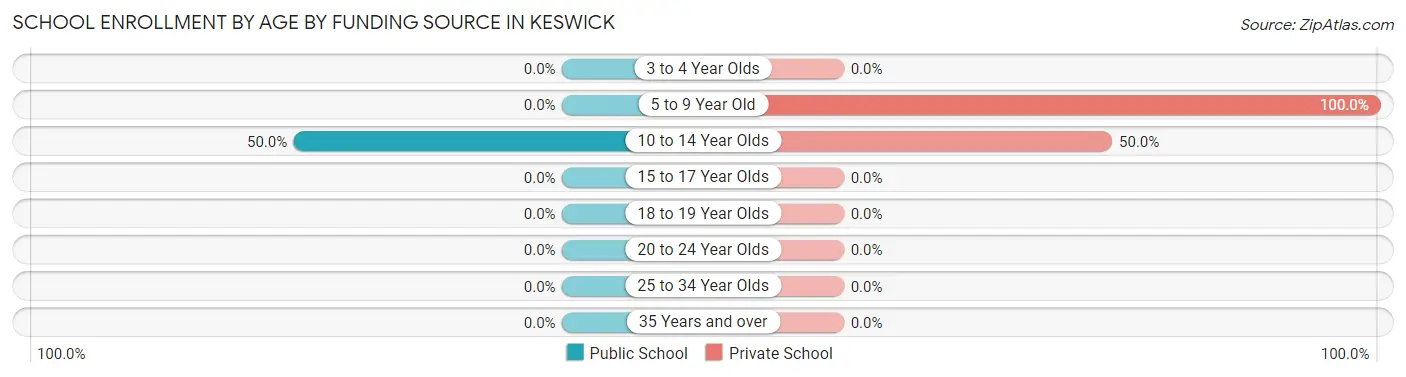
| Age Bracket | Public School | Private School |
| 3 to 4 Year Olds | 0 (0.0%) | 0 (0.0%) |
| 5 to 9 Year Old | 0 (0.0%) | 9 (100.0%) |
| 10 to 14 Year Olds | 9 (50.0%) | 9 (50.0%) |
| 15 to 17 Year Olds | 0 (0.0%) | 0 (0.0%) |
| 18 to 19 Year Olds | 0 (0.0%) | 0 (0.0%) |
| 20 to 24 Year Olds | 0 (0.0%) | 0 (0.0%) |
| 25 to 34 Year Olds | 0 (0.0%) | 0 (0.0%) |
| 35 Years and over | 0 (0.0%) | 0 (0.0%) |
| Total | 9 (33.3%) | 18 (66.7%) |
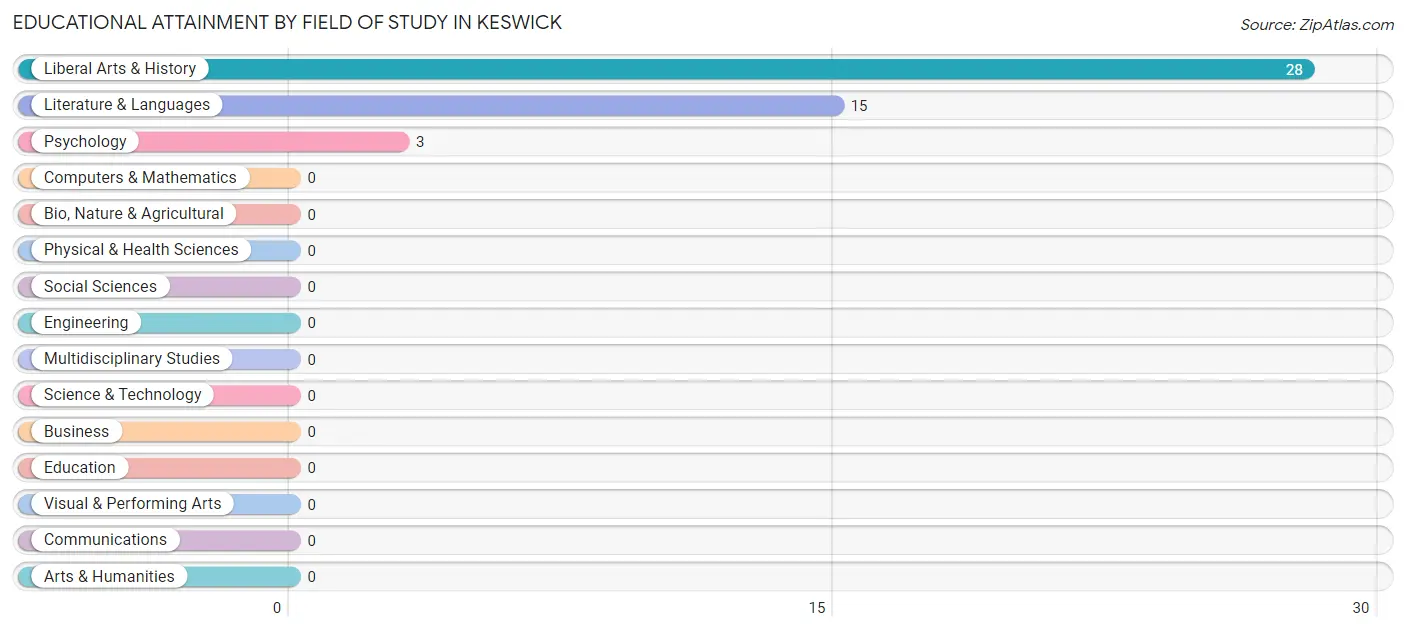
Educational Attainment by Field of Study in Keswick
Liberal arts & history (28 | 60.9%), literature & languages (15 | 32.6%), and psychology (3 | 6.5%) are the most common fields of study among 46 individuals in Keswick who have obtained a bachelor's degree or higher.
| Field of Study | # Graduates | % Graduates |
| Computers & Mathematics | 0 | 0.0% |
| Bio, Nature & Agricultural | 0 | 0.0% |
| Physical & Health Sciences | 0 | 0.0% |
| Psychology | 3 | 6.5% |
| Social Sciences | 0 | 0.0% |
| Engineering | 0 | 0.0% |
| Multidisciplinary Studies | 0 | 0.0% |
| Science & Technology | 0 | 0.0% |
| Business | 0 | 0.0% |
| Education | 0 | 0.0% |
| Literature & Languages | 15 | 32.6% |
| Liberal Arts & History | 28 | 60.9% |
| Visual & Performing Arts | 0 | 0.0% |
| Communications | 0 | 0.0% |
| Arts & Humanities | 0 | 0.0% |
| Total | 46 | 100.0% |
Transportation & Commute in Keswick
Vehicle Availability by Sex in Keswick
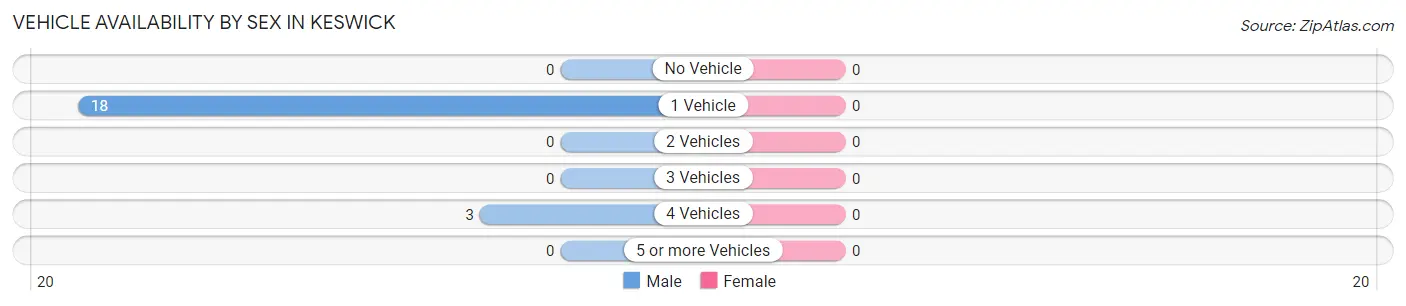
| Vehicles Available | Male | Female |
| No Vehicle | 0 (0.0%) | 0 (0.0%) |
| 1 Vehicle | 18 (85.7%) | 0 (0.0%) |
| 2 Vehicles | 0 (0.0%) | 0 (0.0%) |
| 3 Vehicles | 0 (0.0%) | 0 (0.0%) |
| 4 Vehicles | 3 (14.3%) | 0 (0.0%) |
| 5 or more Vehicles | 0 (0.0%) | 0 (0.0%) |
| Total | 21 (100.0%) | 0 (0.0%) |
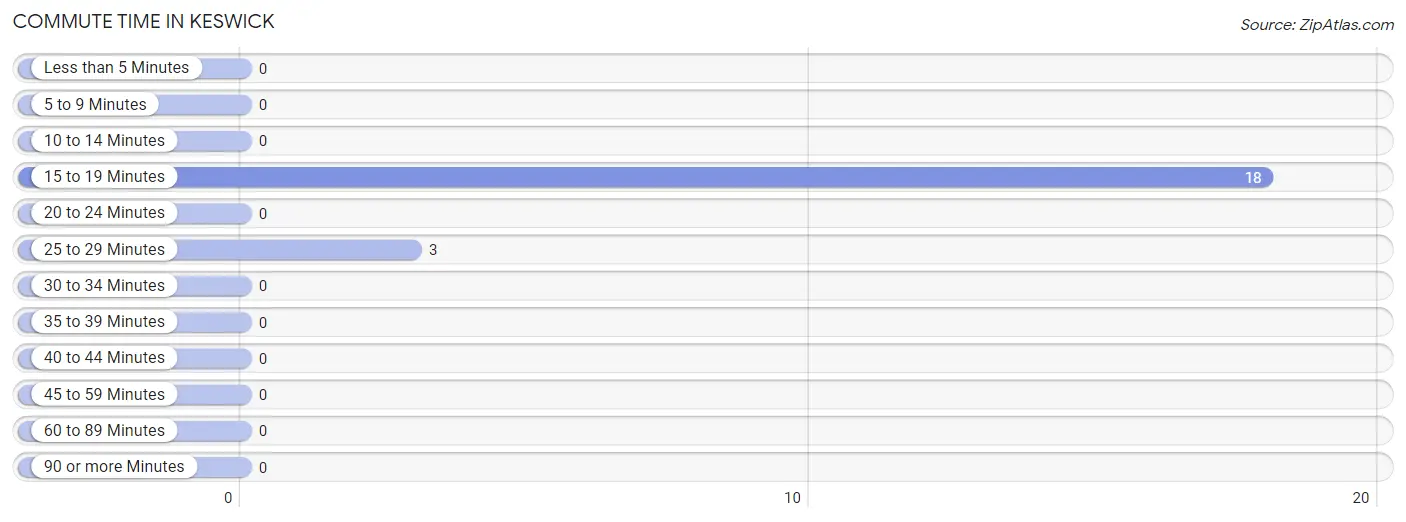
Commute Time in Keswick
The most frequently occuring commute durations in Keswick are 15 to 19 minutes (18 commuters, 85.7%), 25 to 29 minutes (3 commuters, 14.3%), and less than 5 minutes (0 commuters, 0.0%).
| Commute Time | # Commuters | % Commuters |
| Less than 5 Minutes | 0 | 0.0% |
| 5 to 9 Minutes | 0 | 0.0% |
| 10 to 14 Minutes | 0 | 0.0% |
| 15 to 19 Minutes | 18 | 85.7% |
| 20 to 24 Minutes | 0 | 0.0% |
| 25 to 29 Minutes | 3 | 14.3% |
| 30 to 34 Minutes | 0 | 0.0% |
| 35 to 39 Minutes | 0 | 0.0% |
| 40 to 44 Minutes | 0 | 0.0% |
| 45 to 59 Minutes | 0 | 0.0% |
| 60 to 89 Minutes | 0 | 0.0% |
| 90 or more Minutes | 0 | 0.0% |
Commute Time by Sex in Keswick
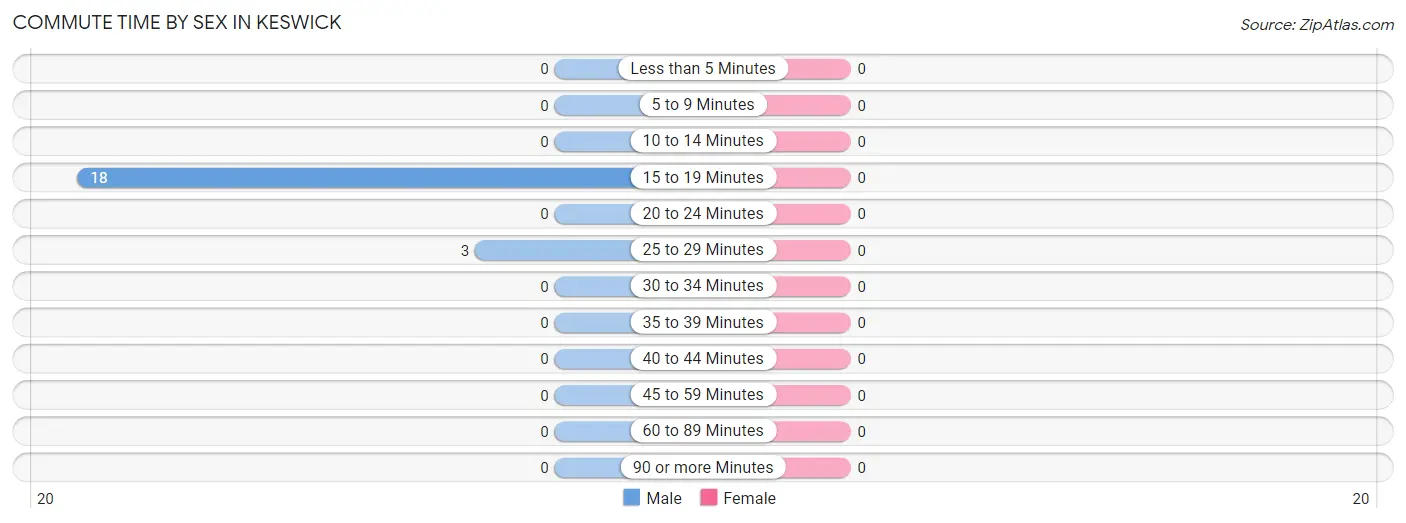
| Commute Time | Male | Female |
| Less than 5 Minutes | 0 (0.0%) | 0 (0.0%) |
| 5 to 9 Minutes | 0 (0.0%) | 0 (0.0%) |
| 10 to 14 Minutes | 0 (0.0%) | 0 (0.0%) |
| 15 to 19 Minutes | 18 (85.7%) | 0 (0.0%) |
| 20 to 24 Minutes | 0 (0.0%) | 0 (0.0%) |
| 25 to 29 Minutes | 3 (14.3%) | 0 (0.0%) |
| 30 to 34 Minutes | 0 (0.0%) | 0 (0.0%) |
| 35 to 39 Minutes | 0 (0.0%) | 0 (0.0%) |
| 40 to 44 Minutes | 0 (0.0%) | 0 (0.0%) |
| 45 to 59 Minutes | 0 (0.0%) | 0 (0.0%) |
| 60 to 89 Minutes | 0 (0.0%) | 0 (0.0%) |
| 90 or more Minutes | 0 (0.0%) | 0 (0.0%) |
Time of Departure to Work by Sex in Keswick
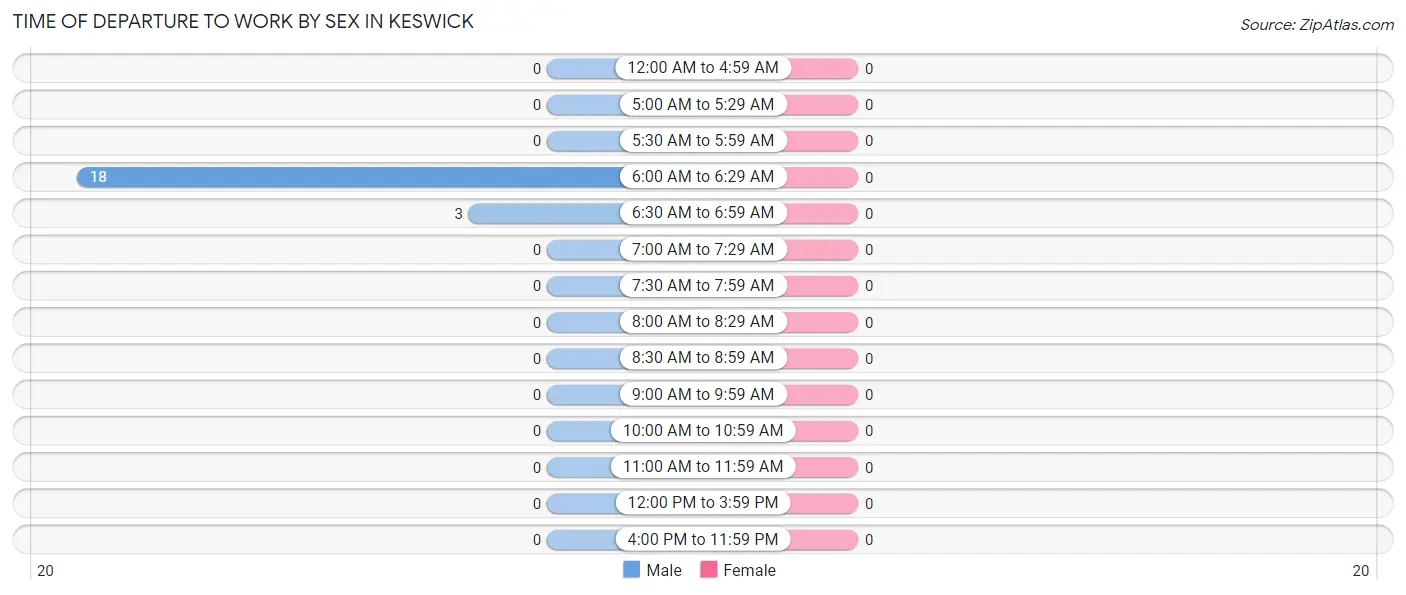
| Time of Departure | Male | Female |
| 12:00 AM to 4:59 AM | 0 (0.0%) | 0 (0.0%) |
| 5:00 AM to 5:29 AM | 0 (0.0%) | 0 (0.0%) |
| 5:30 AM to 5:59 AM | 0 (0.0%) | 0 (0.0%) |
| 6:00 AM to 6:29 AM | 18 (85.7%) | 0 (0.0%) |
| 6:30 AM to 6:59 AM | 3 (14.3%) | 0 (0.0%) |
| 7:00 AM to 7:29 AM | 0 (0.0%) | 0 (0.0%) |
| 7:30 AM to 7:59 AM | 0 (0.0%) | 0 (0.0%) |
| 8:00 AM to 8:29 AM | 0 (0.0%) | 0 (0.0%) |
| 8:30 AM to 8:59 AM | 0 (0.0%) | 0 (0.0%) |
| 9:00 AM to 9:59 AM | 0 (0.0%) | 0 (0.0%) |
| 10:00 AM to 10:59 AM | 0 (0.0%) | 0 (0.0%) |
| 11:00 AM to 11:59 AM | 0 (0.0%) | 0 (0.0%) |
| 12:00 PM to 3:59 PM | 0 (0.0%) | 0 (0.0%) |
| 4:00 PM to 11:59 PM | 0 (0.0%) | 0 (0.0%) |
| Total | 21 (100.0%) | 0 (0.0%) |
Housing Occupancy in Keswick
Occupancy by Ownership in Keswick
Of the total 50 dwellings in Keswick, owner-occupied units account for 32 (64.0%), while renter-occupied units make up 18 (36.0%).
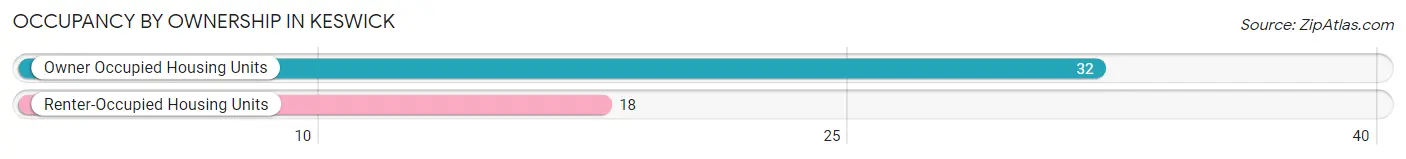
| Occupancy | # Housing Units | % Housing Units |
| Owner Occupied Housing Units | 32 | 64.0% |
| Renter-Occupied Housing Units | 18 | 36.0% |
| Total Occupied Housing Units | 50 | 100.0% |
Occupancy by Household Size in Keswick
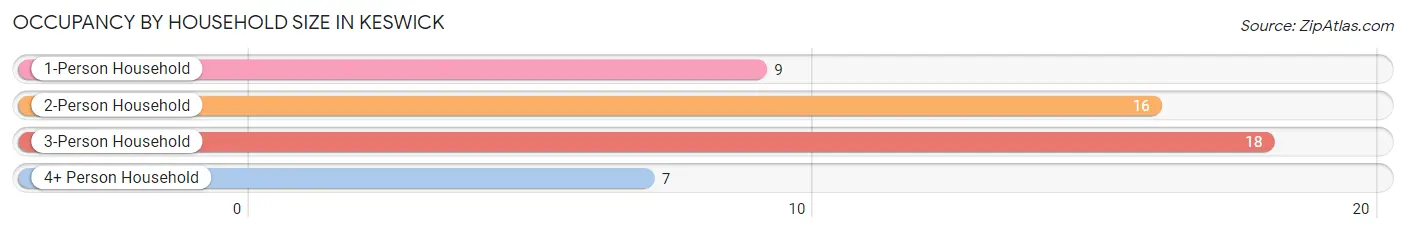
| Household Size | # Housing Units | % Housing Units |
| 1-Person Household | 9 | 18.0% |
| 2-Person Household | 16 | 32.0% |
| 3-Person Household | 18 | 36.0% |
| 4+ Person Household | 7 | 14.0% |
| Total Housing Units | 50 | 100.0% |
Occupancy by Ownership by Household Size in Keswick
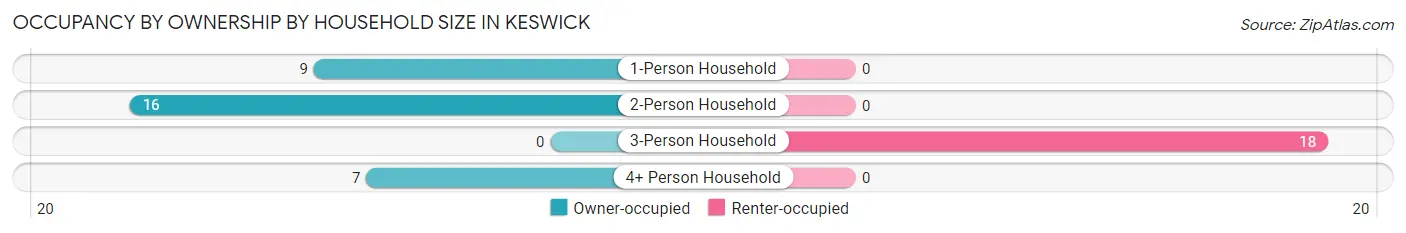
| Household Size | Owner-occupied | Renter-occupied |
| 1-Person Household | 9 (100.0%) | 0 (0.0%) |
| 2-Person Household | 16 (100.0%) | 0 (0.0%) |
| 3-Person Household | 0 (0.0%) | 18 (100.0%) |
| 4+ Person Household | 7 (100.0%) | 0 (0.0%) |
| Total Housing Units | 32 (64.0%) | 18 (36.0%) |
Occupancy by Educational Attainment in Keswick
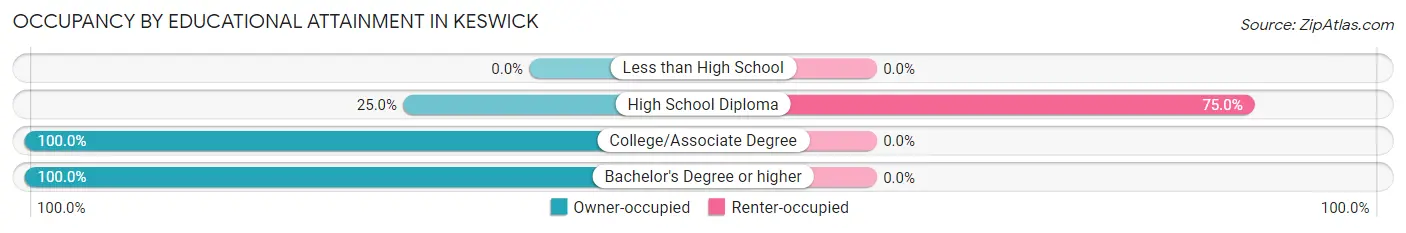
| Household Size | Owner-occupied | Renter-occupied |
| Less than High School | 0 (0.0%) | 0 (0.0%) |
| High School Diploma | 6 (25.0%) | 18 (75.0%) |
| College/Associate Degree | 10 (100.0%) | 0 (0.0%) |
| Bachelor's Degree or higher | 16 (100.0%) | 0 (0.0%) |
Occupancy by Age of Householder in Keswick
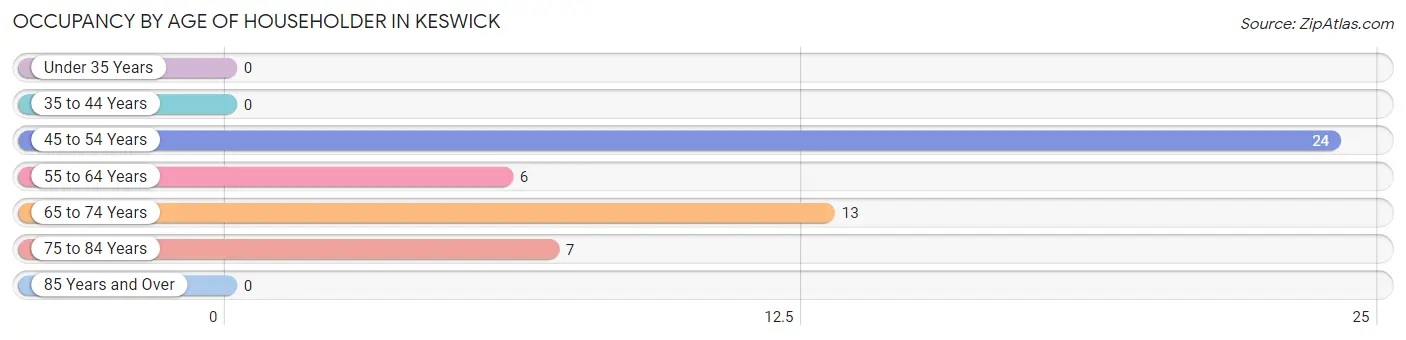
| Age Bracket | # Households | % Households |
| Under 35 Years | 0 | 0.0% |
| 35 to 44 Years | 0 | 0.0% |
| 45 to 54 Years | 24 | 48.0% |
| 55 to 64 Years | 6 | 12.0% |
| 65 to 74 Years | 13 | 26.0% |
| 75 to 84 Years | 7 | 14.0% |
| 85 Years and Over | 0 | 0.0% |
| Total | 50 | 100.0% |
Housing Finances in Keswick
Median Income by Occupancy in Keswick
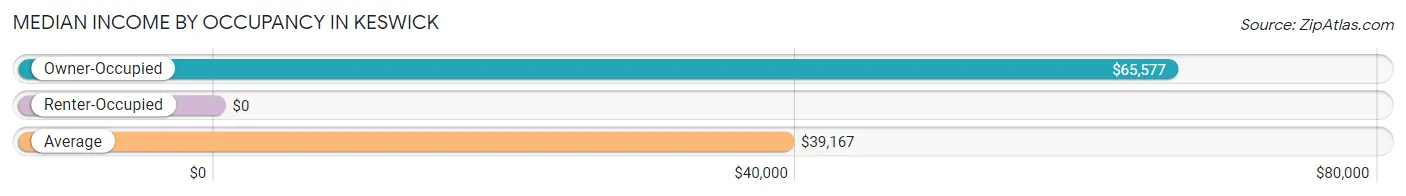
| Occupancy Type | # Households | Median Income |
| Owner-Occupied | 32 (64.0%) | $65,577 |
| Renter-Occupied | 18 (36.0%) | $0 |
| Average | 50 (100.0%) | $39,167 |
Occupancy by Householder Income Bracket in Keswick
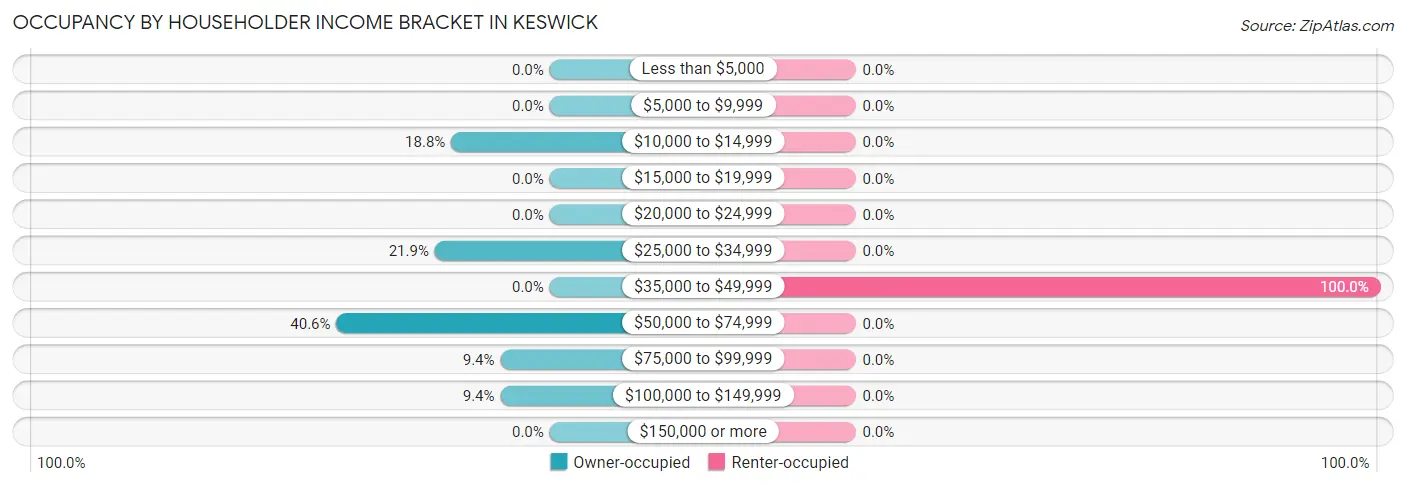
| Income Bracket | Owner-occupied | Renter-occupied |
| Less than $5,000 | 0 (0.0%) | 0 (0.0%) |
| $5,000 to $9,999 | 0 (0.0%) | 0 (0.0%) |
| $10,000 to $14,999 | 6 (18.8%) | 0 (0.0%) |
| $15,000 to $19,999 | 0 (0.0%) | 0 (0.0%) |
| $20,000 to $24,999 | 0 (0.0%) | 0 (0.0%) |
| $25,000 to $34,999 | 7 (21.9%) | 0 (0.0%) |
| $35,000 to $49,999 | 0 (0.0%) | 18 (100.0%) |
| $50,000 to $74,999 | 13 (40.6%) | 0 (0.0%) |
| $75,000 to $99,999 | 3 (9.4%) | 0 (0.0%) |
| $100,000 to $149,999 | 3 (9.4%) | 0 (0.0%) |
| $150,000 or more | 0 (0.0%) | 0 (0.0%) |
| Total | 32 (100.0%) | 18 (100.0%) |
Monthly Housing Cost Tiers in Keswick
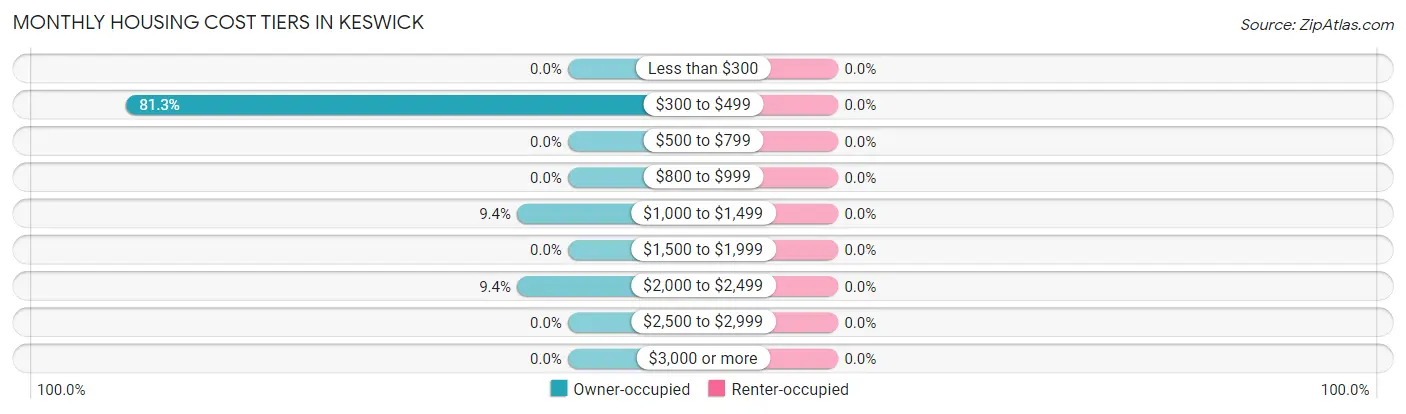
| Monthly Cost | Owner-occupied | Renter-occupied |
| Less than $300 | 0 (0.0%) | 0 (0.0%) |
| $300 to $499 | 26 (81.2%) | 0 (0.0%) |
| $500 to $799 | 0 (0.0%) | 0 (0.0%) |
| $800 to $999 | 0 (0.0%) | 0 (0.0%) |
| $1,000 to $1,499 | 3 (9.4%) | 0 (0.0%) |
| $1,500 to $1,999 | 0 (0.0%) | 0 (0.0%) |
| $2,000 to $2,499 | 3 (9.4%) | 0 (0.0%) |
| $2,500 to $2,999 | 0 (0.0%) | 0 (0.0%) |
| $3,000 or more | 0 (0.0%) | 0 (0.0%) |
| Total | 32 (100.0%) | 18 (100.0%) |
Physical Housing Characteristics in Keswick
Housing Structures in Keswick
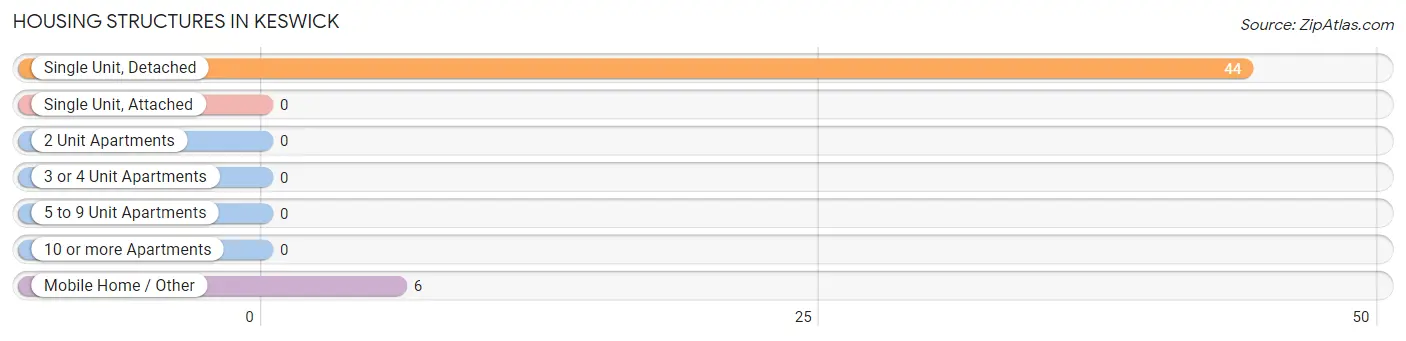
| Structure Type | # Housing Units | % Housing Units |
| Single Unit, Detached | 44 | 88.0% |
| Single Unit, Attached | 0 | 0.0% |
| 2 Unit Apartments | 0 | 0.0% |
| 3 or 4 Unit Apartments | 0 | 0.0% |
| 5 to 9 Unit Apartments | 0 | 0.0% |
| 10 or more Apartments | 0 | 0.0% |
| Mobile Home / Other | 6 | 12.0% |
| Total | 50 | 100.0% |
Housing Structures by Occupancy in Keswick
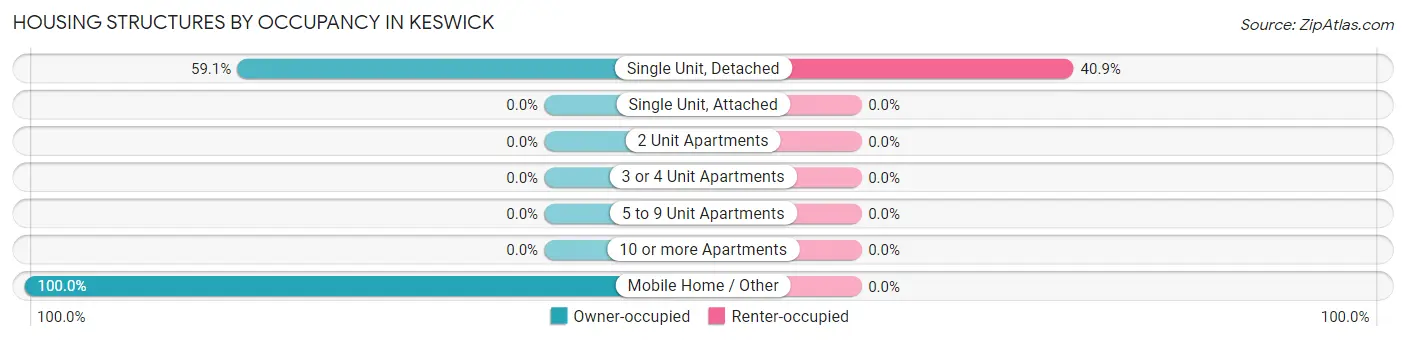
| Structure Type | Owner-occupied | Renter-occupied |
| Single Unit, Detached | 26 (59.1%) | 18 (40.9%) |
| Single Unit, Attached | 0 (0.0%) | 0 (0.0%) |
| 2 Unit Apartments | 0 (0.0%) | 0 (0.0%) |
| 3 or 4 Unit Apartments | 0 (0.0%) | 0 (0.0%) |
| 5 to 9 Unit Apartments | 0 (0.0%) | 0 (0.0%) |
| 10 or more Apartments | 0 (0.0%) | 0 (0.0%) |
| Mobile Home / Other | 6 (100.0%) | 0 (0.0%) |
| Total | 32 (64.0%) | 18 (36.0%) |
Housing Structures by Number of Rooms in Keswick
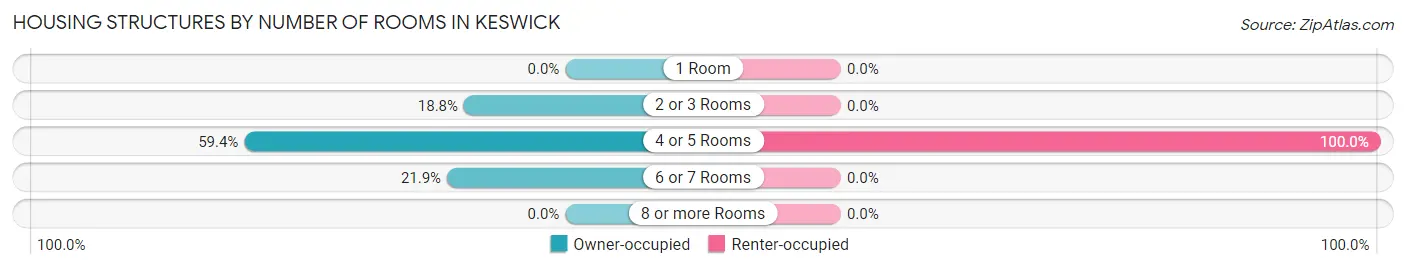
| Number of Rooms | Owner-occupied | Renter-occupied |
| 1 Room | 0 (0.0%) | 0 (0.0%) |
| 2 or 3 Rooms | 6 (18.8%) | 0 (0.0%) |
| 4 or 5 Rooms | 19 (59.4%) | 18 (100.0%) |
| 6 or 7 Rooms | 7 (21.9%) | 0 (0.0%) |
| 8 or more Rooms | 0 (0.0%) | 0 (0.0%) |
| Total | 32 (100.0%) | 18 (100.0%) |
Housing Structure by Heating Type in Keswick
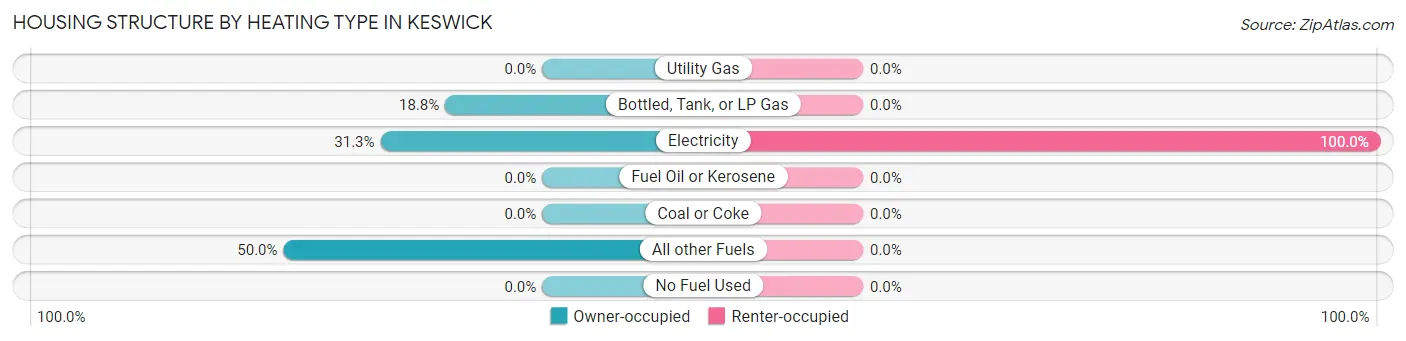
| Heating Type | Owner-occupied | Renter-occupied |
| Utility Gas | 0 (0.0%) | 0 (0.0%) |
| Bottled, Tank, or LP Gas | 6 (18.8%) | 0 (0.0%) |
| Electricity | 10 (31.2%) | 18 (100.0%) |
| Fuel Oil or Kerosene | 0 (0.0%) | 0 (0.0%) |
| Coal or Coke | 0 (0.0%) | 0 (0.0%) |
| All other Fuels | 16 (50.0%) | 0 (0.0%) |
| No Fuel Used | 0 (0.0%) | 0 (0.0%) |
| Total | 32 (100.0%) | 18 (100.0%) |
Household Vehicle Usage in Keswick
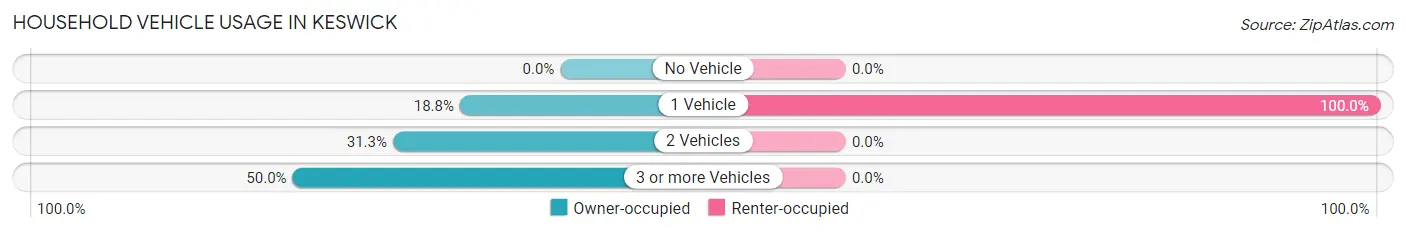
| Vehicles per Household | Owner-occupied | Renter-occupied |
| No Vehicle | 0 (0.0%) | 0 (0.0%) |
| 1 Vehicle | 6 (18.8%) | 18 (100.0%) |
| 2 Vehicles | 10 (31.2%) | 0 (0.0%) |
| 3 or more Vehicles | 16 (50.0%) | 0 (0.0%) |
| Total | 32 (100.0%) | 18 (100.0%) |
Real Estate & Mortgages in Keswick
Real Estate and Mortgage Overview in Keswick
| Characteristic | Without Mortgage | With Mortgage |
| Housing Units | 26 | 6 |
| Median Property Value | $353,800 | $0 |
| Median Household Income | - | - |
| Monthly Housing Costs | - | - |
| Real Estate Taxes | $2,000 | $0 |
Property Value by Mortgage Status in Keswick
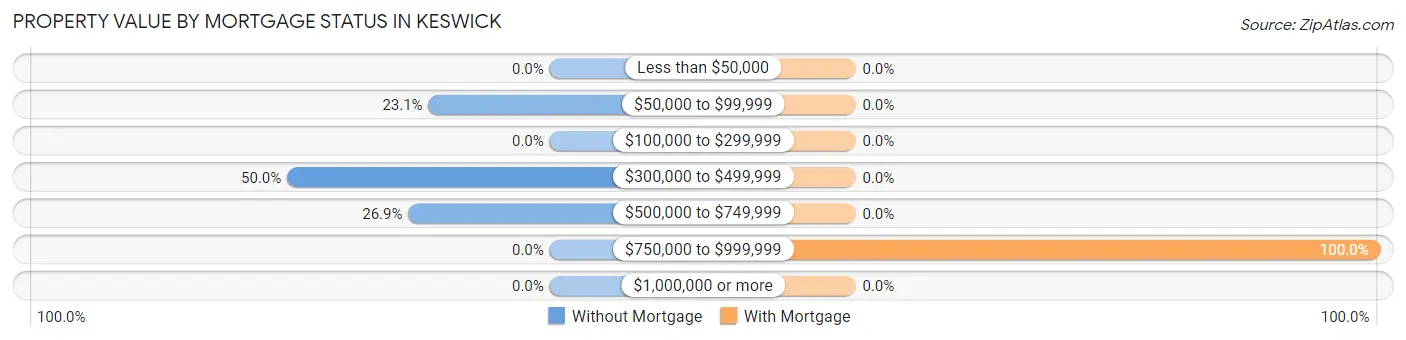
| Property Value | Without Mortgage | With Mortgage |
| Less than $50,000 | 0 (0.0%) | 0 (0.0%) |
| $50,000 to $99,999 | 6 (23.1%) | 0 (0.0%) |
| $100,000 to $299,999 | 0 (0.0%) | 0 (0.0%) |
| $300,000 to $499,999 | 13 (50.0%) | 0 (0.0%) |
| $500,000 to $749,999 | 7 (26.9%) | 0 (0.0%) |
| $750,000 to $999,999 | 0 (0.0%) | 6 (100.0%) |
| $1,000,000 or more | 0 (0.0%) | 0 (0.0%) |
| Total | 26 (100.0%) | 6 (100.0%) |
Household Income by Mortgage Status in Keswick
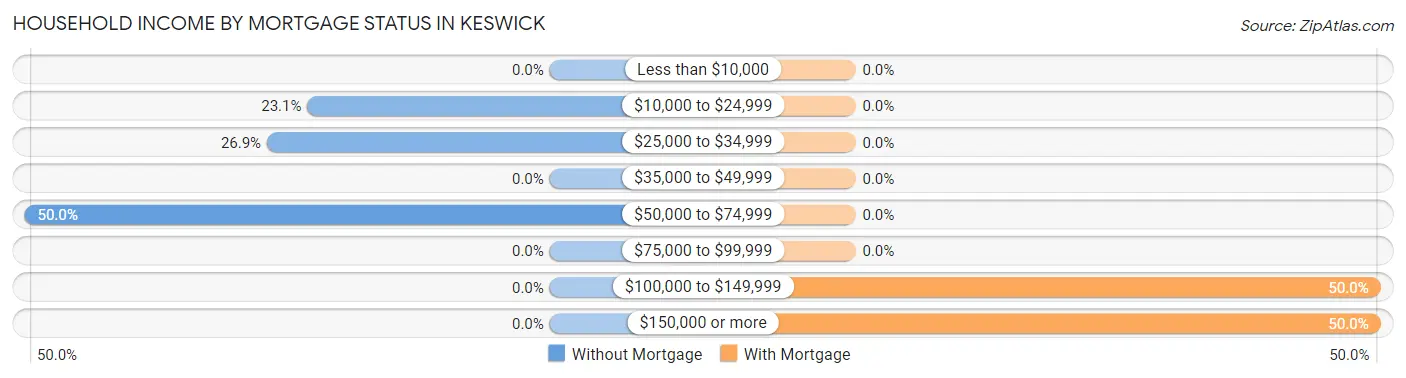
| Household Income | Without Mortgage | With Mortgage |
| Less than $10,000 | 0 (0.0%) | 0 (0.0%) |
| $10,000 to $24,999 | 6 (23.1%) | 0 (0.0%) |
| $25,000 to $34,999 | 7 (26.9%) | 0 (0.0%) |
| $35,000 to $49,999 | 0 (0.0%) | 0 (0.0%) |
| $50,000 to $74,999 | 13 (50.0%) | 0 (0.0%) |
| $75,000 to $99,999 | 0 (0.0%) | 0 (0.0%) |
| $100,000 to $149,999 | 0 (0.0%) | 3 (50.0%) |
| $150,000 or more | 0 (0.0%) | 3 (50.0%) |
| Total | 26 (100.0%) | 6 (100.0%) |
Property Value to Household Income Ratio in Keswick
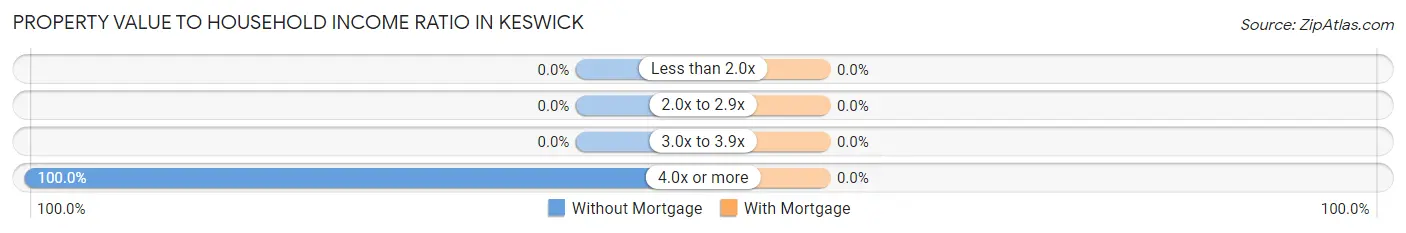
| Value-to-Income Ratio | Without Mortgage | With Mortgage |
| Less than 2.0x | 0 (0.0%) | 0 (0.0%) |
| 2.0x to 2.9x | 0 (0.0%) | 0 (0.0%) |
| 3.0x to 3.9x | 0 (0.0%) | 0 (0.0%) |
| 4.0x or more | 26 (100.0%) | 0 (0.0%) |
| Total | 26 (100.0%) | 6 (100.0%) |
Real Estate Taxes by Mortgage Status in Keswick
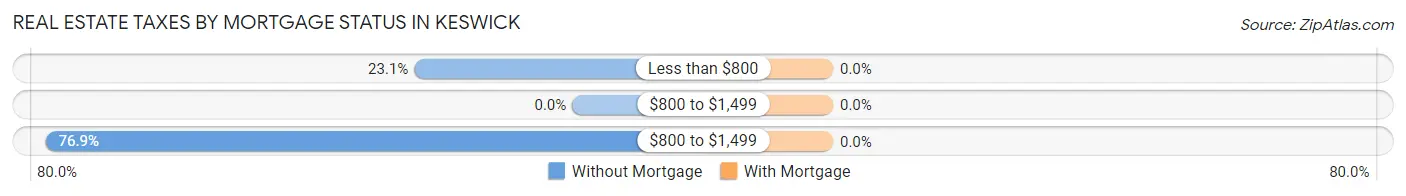
| Property Taxes | Without Mortgage | With Mortgage |
| Less than $800 | 6 (23.1%) | 0 (0.0%) |
| $800 to $1,499 | 0 (0.0%) | 0 (0.0%) |
| $800 to $1,499 | 20 (76.9%) | 0 (0.0%) |
| Total | 26 (100.0%) | 6 (100.0%) |
Health & Disability in Keswick
Health Insurance Coverage by Age in Keswick
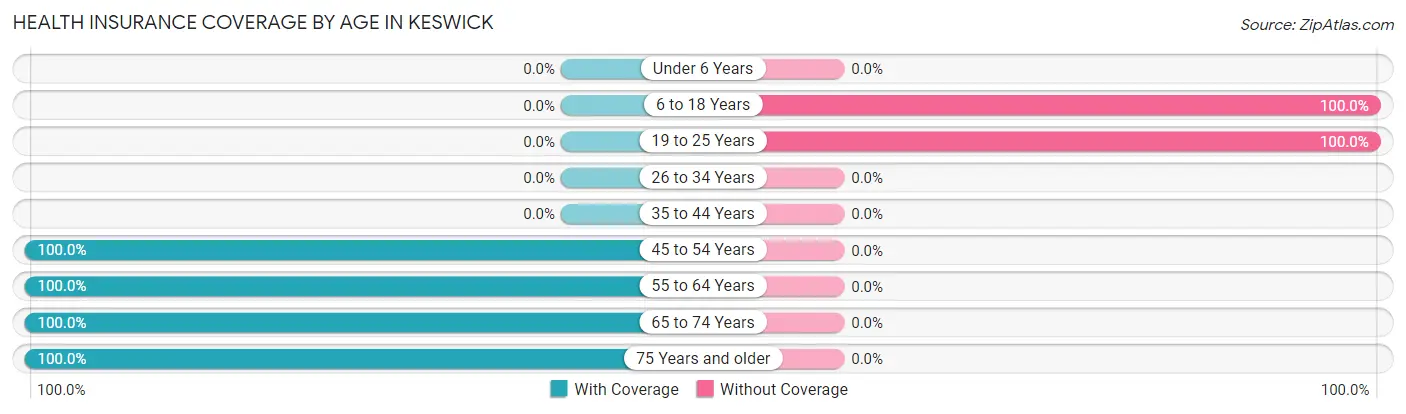
| Age Bracket | With Coverage | Without Coverage |
| Under 6 Years | 0 (0.0%) | 0 (0.0%) |
| 6 to 18 Years | 0 (0.0%) | 27 (100.0%) |
| 19 to 25 Years | 0 (0.0%) | 20 (100.0%) |
| 26 to 34 Years | 0 (0.0%) | 0 (0.0%) |
| 35 to 44 Years | 0 (0.0%) | 0 (0.0%) |
| 45 to 54 Years | 24 (100.0%) | 0 (0.0%) |
| 55 to 64 Years | 25 (100.0%) | 0 (0.0%) |
| 65 to 74 Years | 28 (100.0%) | 0 (0.0%) |
| 75 Years and older | 14 (100.0%) | 0 (0.0%) |
| Total | 91 (65.9%) | 47 (34.1%) |
Health Insurance Coverage by Citizenship Status in Keswick
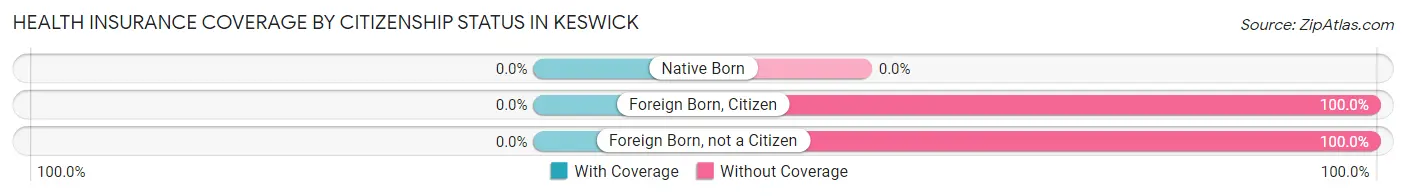
| Citizenship Status | With Coverage | Without Coverage |
| Native Born | 0 (0.0%) | 0 (0.0%) |
| Foreign Born, Citizen | 0 (0.0%) | 27 (100.0%) |
| Foreign Born, not a Citizen | 0 (0.0%) | 20 (100.0%) |
Health Insurance Coverage by Household Income in Keswick
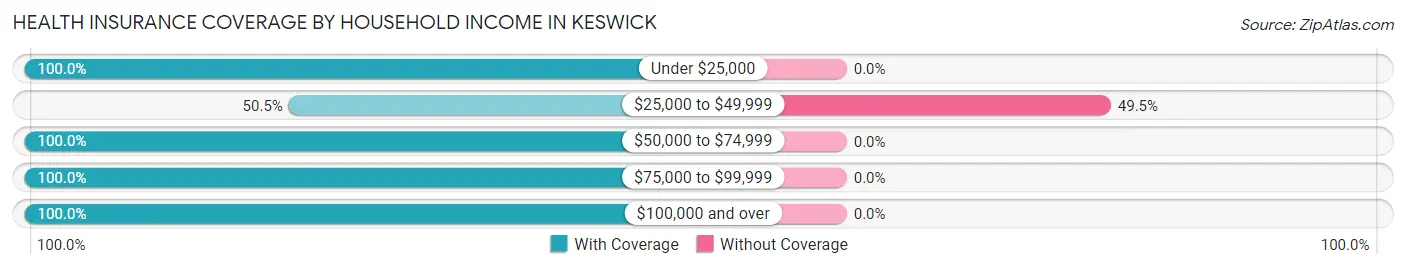
| Household Income | With Coverage | Without Coverage |
| Under $25,000 | 6 (100.0%) | 0 (0.0%) |
| $25,000 to $49,999 | 48 (50.5%) | 47 (49.5%) |
| $50,000 to $74,999 | 28 (100.0%) | 0 (0.0%) |
| $75,000 to $99,999 | 6 (100.0%) | 0 (0.0%) |
| $100,000 and over | 3 (100.0%) | 0 (0.0%) |
Public vs Private Health Insurance Coverage by Age in Keswick
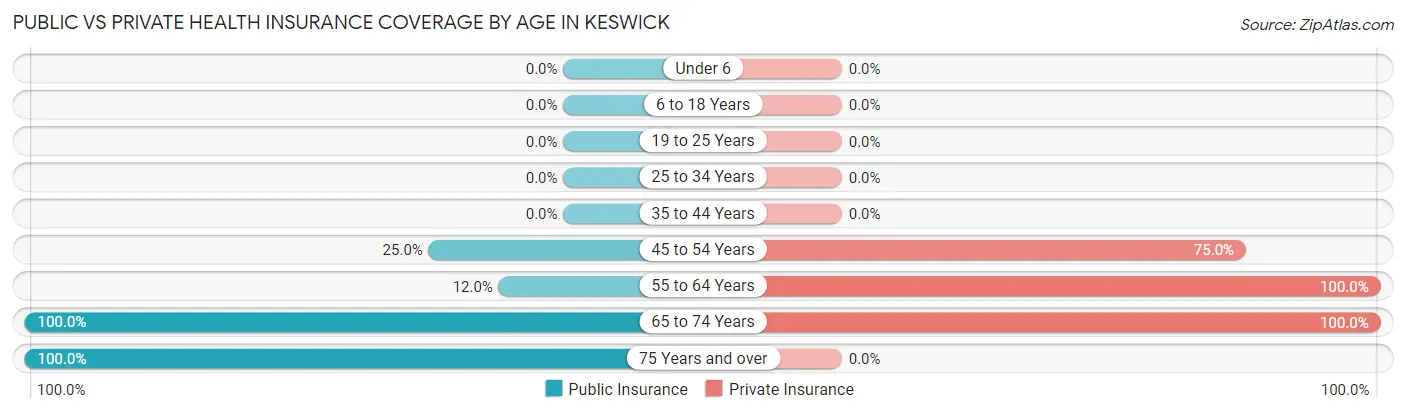
| Age Bracket | Public Insurance | Private Insurance |
| Under 6 | 0 (0.0%) | 0 (0.0%) |
| 6 to 18 Years | 0 (0.0%) | 0 (0.0%) |
| 19 to 25 Years | 0 (0.0%) | 0 (0.0%) |
| 25 to 34 Years | 0 (0.0%) | 0 (0.0%) |
| 35 to 44 Years | 0 (0.0%) | 0 (0.0%) |
| 45 to 54 Years | 6 (25.0%) | 18 (75.0%) |
| 55 to 64 Years | 3 (12.0%) | 25 (100.0%) |
| 65 to 74 Years | 28 (100.0%) | 28 (100.0%) |
| 75 Years and over | 14 (100.0%) | 0 (0.0%) |
| Total | 51 (37.0%) | 71 (51.4%) |
Disability Status by Sex by Age in Keswick
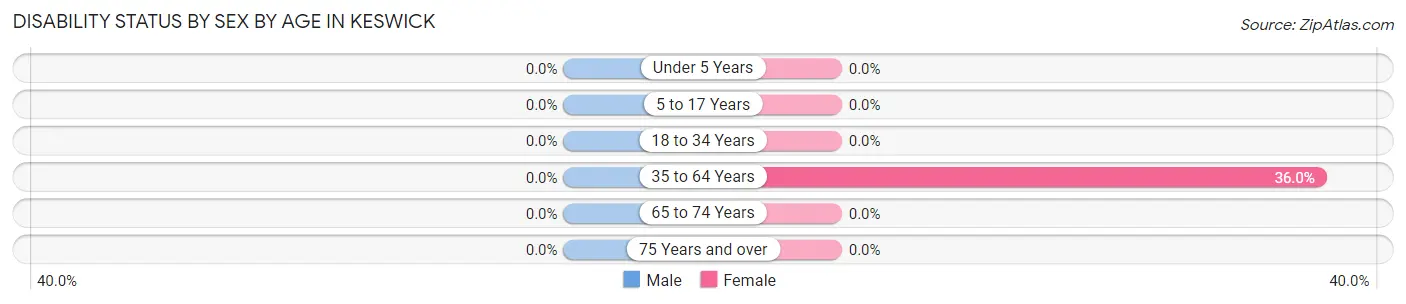
| Age Bracket | Male | Female |
| Under 5 Years | 0 (0.0%) | 0 (0.0%) |
| 5 to 17 Years | 0 (0.0%) | 0 (0.0%) |
| 18 to 34 Years | 0 (0.0%) | 0 (0.0%) |
| 35 to 64 Years | 0 (0.0%) | 9 (36.0%) |
| 65 to 74 Years | 0 (0.0%) | 0 (0.0%) |
| 75 Years and over | 0 (0.0%) | 0 (0.0%) |
Disability Class by Sex by Age in Keswick
Disability Class: Hearing Difficulty
| Age Bracket | Male | Female |
| Under 5 Years | 0 (0.0%) | 0 (0.0%) |
| 5 to 17 Years | 0 (0.0%) | 0 (0.0%) |
| 18 to 34 Years | 0 (0.0%) | 0 (0.0%) |
| 35 to 64 Years | 0 (0.0%) | 0 (0.0%) |
| 65 to 74 Years | 0 (0.0%) | 0 (0.0%) |
| 75 Years and over | 0 (0.0%) | 0 (0.0%) |
Disability Class: Vision Difficulty
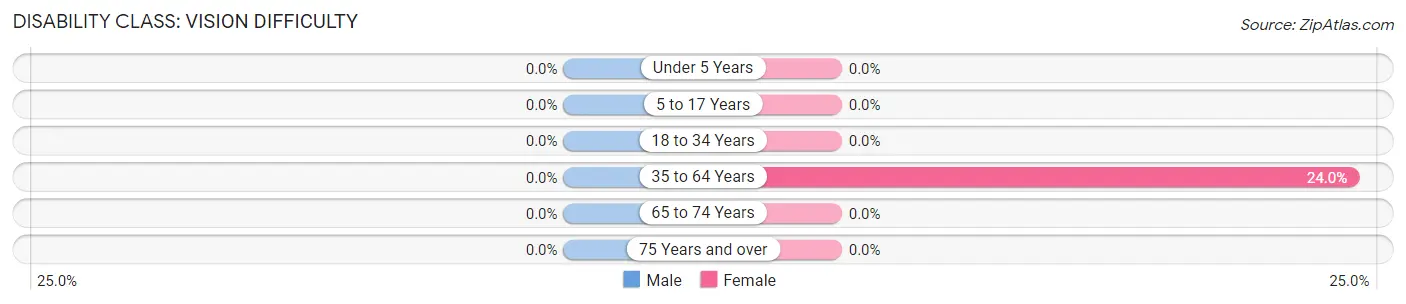
| Age Bracket | Male | Female |
| Under 5 Years | 0 (0.0%) | 0 (0.0%) |
| 5 to 17 Years | 0 (0.0%) | 0 (0.0%) |
| 18 to 34 Years | 0 (0.0%) | 0 (0.0%) |
| 35 to 64 Years | 0 (0.0%) | 6 (24.0%) |
| 65 to 74 Years | 0 (0.0%) | 0 (0.0%) |
| 75 Years and over | 0 (0.0%) | 0 (0.0%) |
Disability Class: Cognitive Difficulty
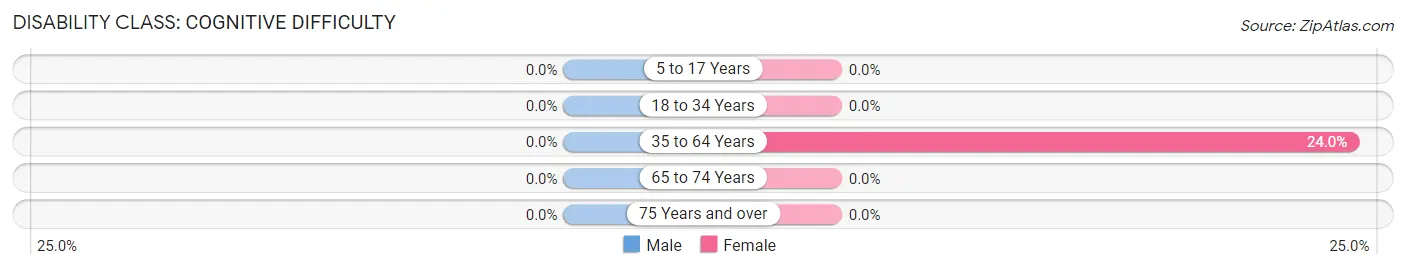
| Age Bracket | Male | Female |
| 5 to 17 Years | 0 (0.0%) | 0 (0.0%) |
| 18 to 34 Years | 0 (0.0%) | 0 (0.0%) |
| 35 to 64 Years | 0 (0.0%) | 6 (24.0%) |
| 65 to 74 Years | 0 (0.0%) | 0 (0.0%) |
| 75 Years and over | 0 (0.0%) | 0 (0.0%) |
Disability Class: Ambulatory Difficulty
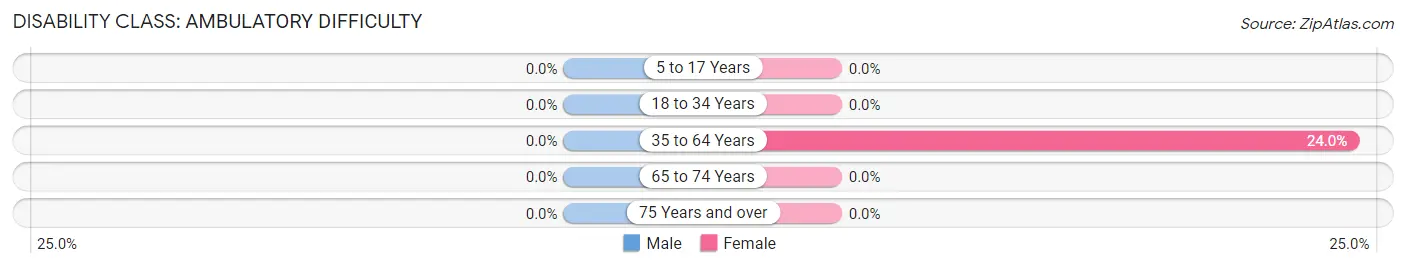
| Age Bracket | Male | Female |
| 5 to 17 Years | 0 (0.0%) | 0 (0.0%) |
| 18 to 34 Years | 0 (0.0%) | 0 (0.0%) |
| 35 to 64 Years | 0 (0.0%) | 6 (24.0%) |
| 65 to 74 Years | 0 (0.0%) | 0 (0.0%) |
| 75 Years and over | 0 (0.0%) | 0 (0.0%) |
Disability Class: Self-Care Difficulty
| Age Bracket | Male | Female |
| 5 to 17 Years | 0 (0.0%) | 0 (0.0%) |
| 18 to 34 Years | 0 (0.0%) | 0 (0.0%) |
| 35 to 64 Years | 0 (0.0%) | 0 (0.0%) |
| 65 to 74 Years | 0 (0.0%) | 0 (0.0%) |
| 75 Years and over | 0 (0.0%) | 0 (0.0%) |
Technology Access in Keswick
Computing Device Access in Keswick
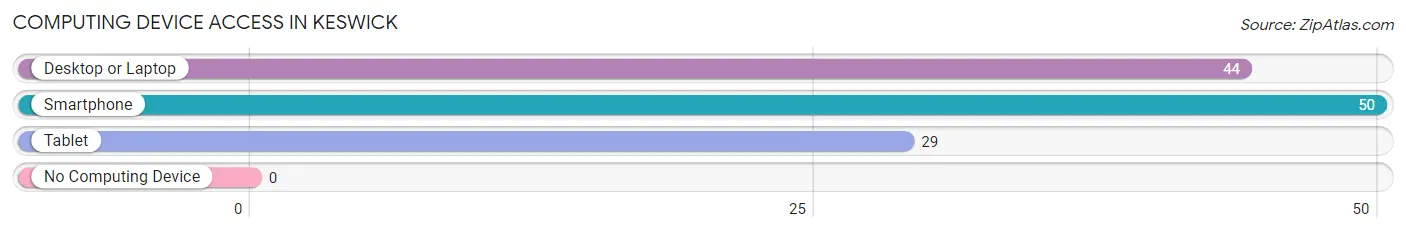
| Device Type | # Households | % Households |
| Desktop or Laptop | 44 | 88.0% |
| Smartphone | 50 | 100.0% |
| Tablet | 29 | 58.0% |
| No Computing Device | 0 | 0.0% |
| Total | 50 | 100.0% |
Internet Access in Keswick
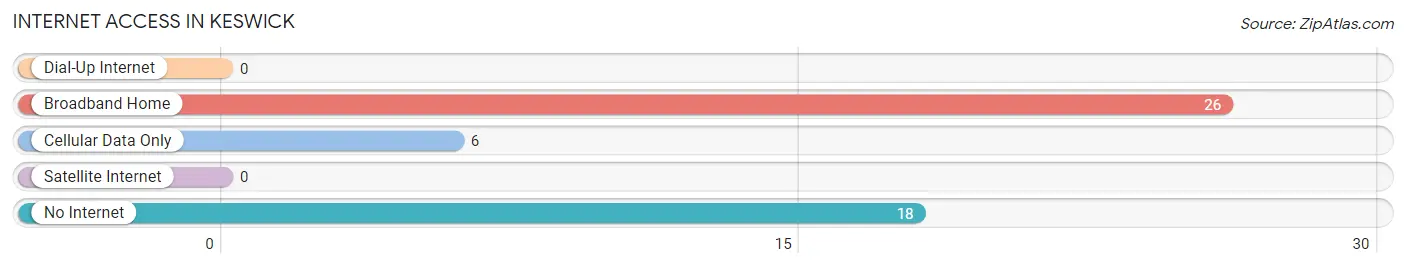
| Internet Type | # Households | % Households |
| Dial-Up Internet | 0 | 0.0% |
| Broadband Home | 26 | 52.0% |
| Cellular Data Only | 6 | 12.0% |
| Satellite Internet | 0 | 0.0% |
| No Internet | 18 | 36.0% |
| Total | 50 | 100.0% |
Keswick Summary
Keswick is a small unincorporated community located in Shasta County, California. It is situated in the foothills of the Cascade Range, approximately 8 miles east of Redding. The population of Keswick was estimated to be 1,845 in 2019.
History
Keswick was originally inhabited by the Wintu Native American tribe. The first settlers in the area were miners who arrived in the 1850s. The town was named after Keswick, England, and was officially established in 1872.
In the late 19th century, Keswick was a bustling mining town. It was home to several gold and silver mines, as well as a stamp mill. The town was also home to a number of saloons, hotels, and stores.
Geography
Keswick is located in the foothills of the Cascade Range, approximately 8 miles east of Redding. The town is situated at an elevation of 1,845 feet above sea level. The climate in Keswick is semi-arid, with hot summers and mild winters.
The terrain around Keswick is mostly flat, with some rolling hills. The area is covered in grasslands and oak woodlands. The nearby Sacramento River provides a source of water for the town.
Economy
Keswick’s economy is largely based on agriculture and tourism. The town is home to several wineries, as well as a number of small businesses. The nearby Shasta Dam provides a source of hydroelectric power for the area.
The town is also home to a number of outdoor recreation opportunities, including fishing, camping, and hiking. The nearby Whiskeytown National Recreation Area is a popular destination for visitors.
Demographics
Keswick has a population of 1,845, according to the 2019 census. The population is predominantly white (90.2%), with a small Hispanic population (4.2%). The median household income in Keswick is $50,000, and the median age is 44.
Keswick is a small, rural community with a close-knit population. The town is home to a number of churches, as well as a volunteer fire department. The town is served by a number of local businesses, including a grocery store, a hardware store, and a post office.
Common Questions
What is Per Capita Income in Keswick?
Per Capita income in Keswick is $18,262.
What is the Median Family Income in Keswick?
Median Family Income in Keswick is $39,375.
What is the Median Household income in Keswick?
Median Household Income in Keswick is $39,167.
What is Inequality or Gini Index in Keswick?
Inequality or Gini Index in Keswick is 0.29.
What is the Total Population of Keswick?
Total Population of Keswick is 138.
What is the Total Male Population of Keswick?
Total Male Population of Keswick is 84.
What is the Total Female Population of Keswick?
Total Female Population of Keswick is 54.
What is the Ratio of Males per 100 Females in Keswick?
There are 155.56 Males per 100 Females in Keswick.
What is the Ratio of Females per 100 Males in Keswick?
There are 64.29 Females per 100 Males in Keswick.
What is the Median Population Age in Keswick?
Median Population Age in Keswick is 50.9 Years.
What is the Average Family Size in Keswick
Average Family Size in Keswick is 3.1 People.
What is the Average Household Size in Keswick
Average Household Size in Keswick is 2.8 People.
How Large is the Labor Force in Keswick?
There are 30 People in the Labor Forcein in Keswick.
What is the Percentage of People in the Labor Force in Keswick?
27.0% of People are in the Labor Force in Keswick.
What is the Unemployment Rate in Keswick?
Unemployment Rate in Keswick is 20.0%.