Boronda, CA Map & Demographics
Boronda Map
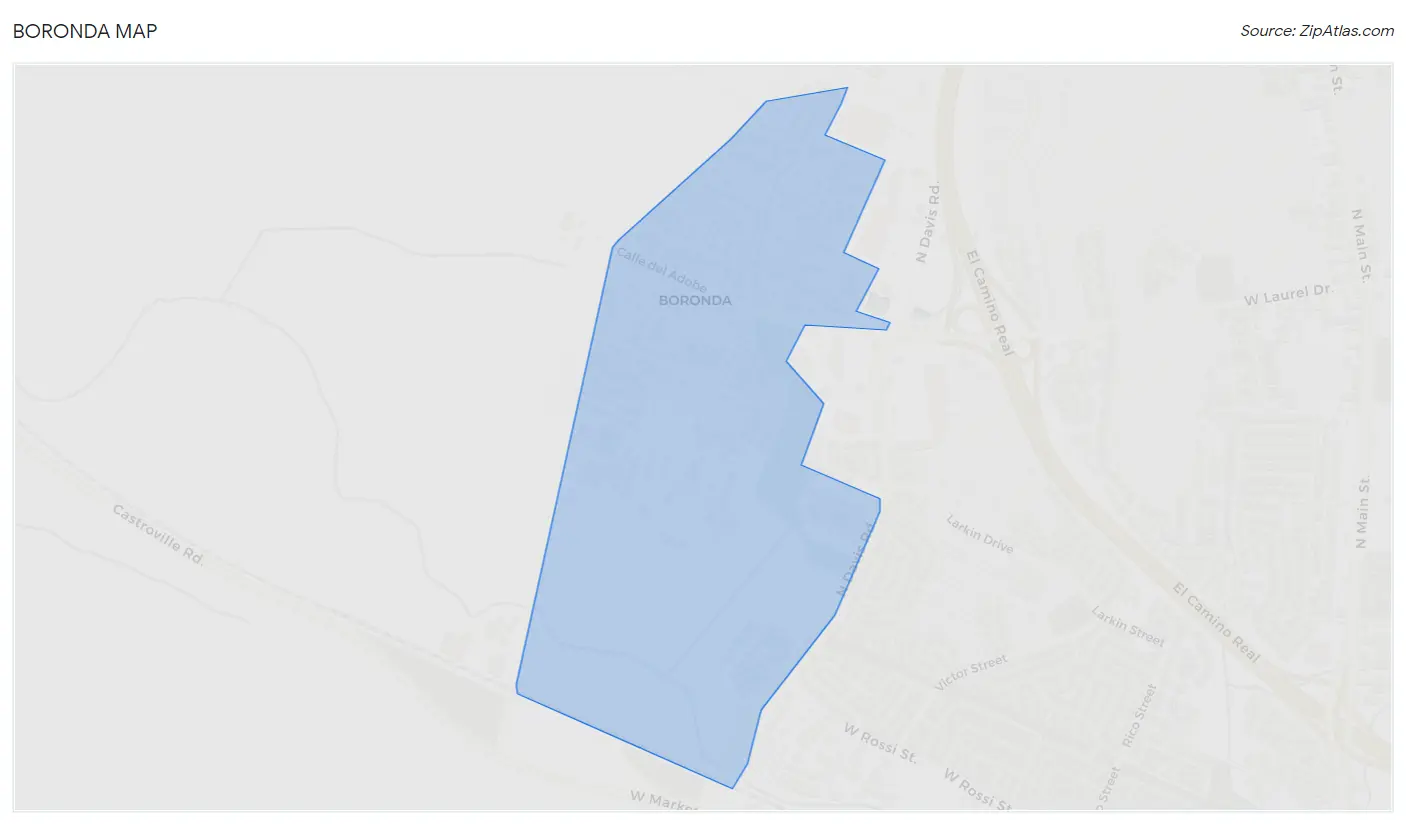
Boronda Overview
$21,377
PER CAPITA INCOME
$50,066
AVG FAMILY INCOME
$59,398
AVG HOUSEHOLD INCOME
35.7%
WAGE / INCOME GAP [ % ]
64.3¢/ $1
WAGE / INCOME GAP [ $ ]
0.37
INEQUALITY / GINI INDEX
1,885
TOTAL POPULATION
922
MALE POPULATION
963
FEMALE POPULATION
95.74
MALES / 100 FEMALES
104.45
FEMALES / 100 MALES
39.7
MEDIAN AGE
4.2
AVG FAMILY SIZE
4.3
AVG HOUSEHOLD SIZE
1,018
LABOR FORCE [ PEOPLE ]
67.0%
PERCENT IN LABOR FORCE
17.1%
UNEMPLOYMENT RATE
Income in Boronda
Income Overview in Boronda
Per Capita Income in Boronda is $21,377, while median incomes of families and households are $50,066 and $59,398 respectively.
| Characteristic | Number | Measure |
| Per Capita Income | 1,885 | $21,377 |
| Median Family Income | 375 | $50,066 |
| Mean Family Income | 375 | $75,132 |
| Median Household Income | 443 | $59,398 |
| Mean Household Income | 443 | $87,639 |
| Income Deficit | 375 | $0 |
| Wage / Income Gap (%) | 1,885 | 35.65% |
| Wage / Income Gap ($) | 1,885 | 64.35¢ per $1 |
| Gini / Inequality Index | 1,885 | 0.37 |
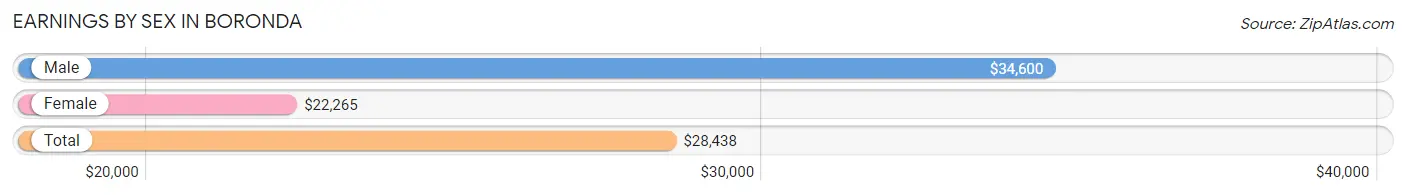
Earnings by Sex in Boronda
Average Earnings in Boronda are $28,438, $34,600 for men and $22,265 for women, a difference of 35.6%.
| Sex | Number | Average Earnings |
| Male | 458 (46.5%) | $34,600 |
| Female | 528 (53.5%) | $22,265 |
| Total | 986 (100.0%) | $28,438 |
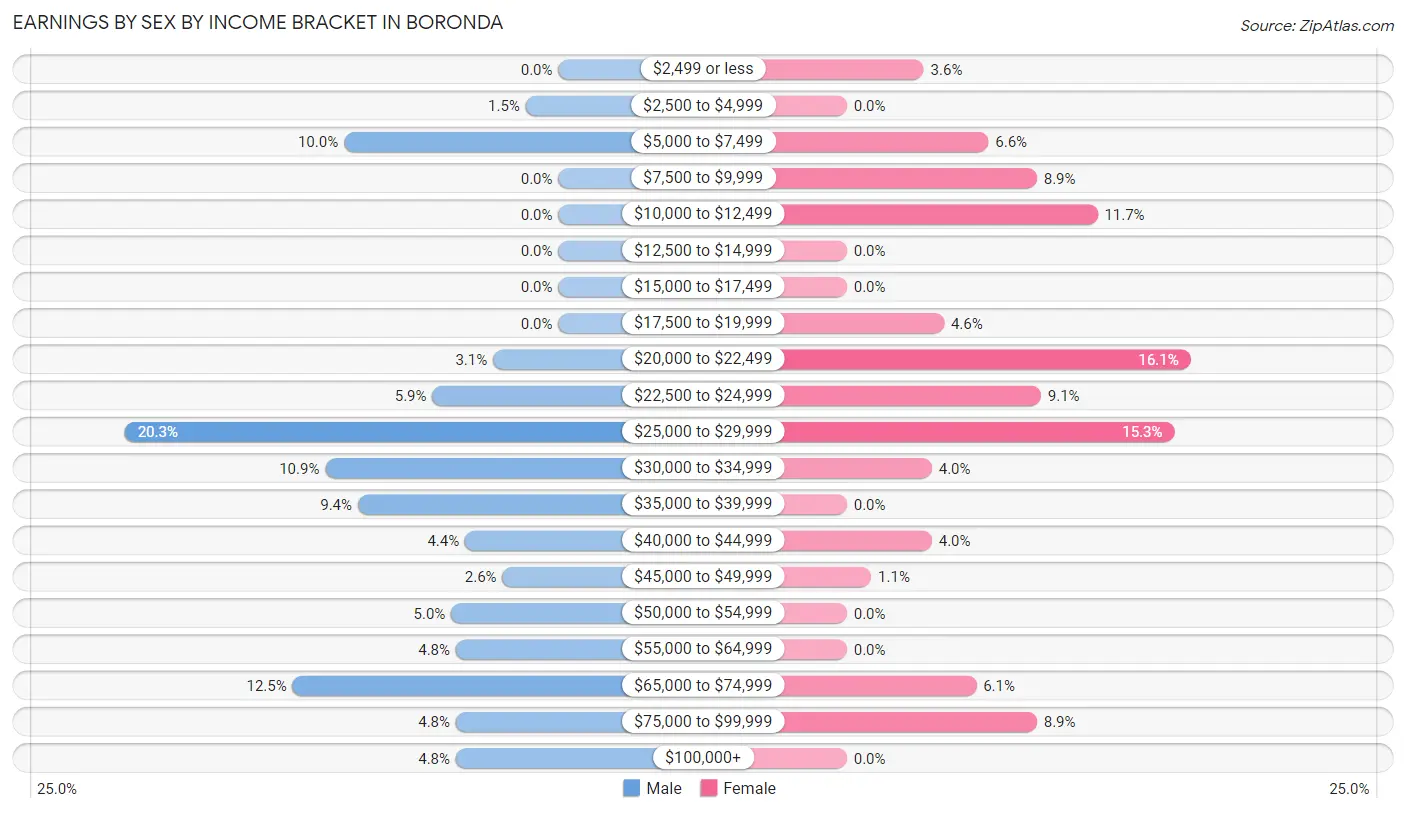
Earnings by Sex by Income Bracket in Boronda
The most common earnings brackets in Boronda are $25,000 to $29,999 for men (93 | 20.3%) and $20,000 to $22,499 for women (85 | 16.1%).
| Income | Male | Female |
| $2,499 or less | 0 (0.0%) | 19 (3.6%) |
| $2,500 to $4,999 | 7 (1.5%) | 0 (0.0%) |
| $5,000 to $7,499 | 46 (10.0%) | 35 (6.6%) |
| $7,500 to $9,999 | 0 (0.0%) | 47 (8.9%) |
| $10,000 to $12,499 | 0 (0.0%) | 62 (11.7%) |
| $12,500 to $14,999 | 0 (0.0%) | 0 (0.0%) |
| $15,000 to $17,499 | 0 (0.0%) | 0 (0.0%) |
| $17,500 to $19,999 | 0 (0.0%) | 24 (4.5%) |
| $20,000 to $22,499 | 14 (3.1%) | 85 (16.1%) |
| $22,500 to $24,999 | 27 (5.9%) | 48 (9.1%) |
| $25,000 to $29,999 | 93 (20.3%) | 81 (15.3%) |
| $30,000 to $34,999 | 50 (10.9%) | 21 (4.0%) |
| $35,000 to $39,999 | 43 (9.4%) | 0 (0.0%) |
| $40,000 to $44,999 | 20 (4.4%) | 21 (4.0%) |
| $45,000 to $49,999 | 12 (2.6%) | 6 (1.1%) |
| $50,000 to $54,999 | 23 (5.0%) | 0 (0.0%) |
| $55,000 to $64,999 | 22 (4.8%) | 0 (0.0%) |
| $65,000 to $74,999 | 57 (12.4%) | 32 (6.1%) |
| $75,000 to $99,999 | 22 (4.8%) | 47 (8.9%) |
| $100,000+ | 22 (4.8%) | 0 (0.0%) |
| Total | 458 (100.0%) | 528 (100.0%) |
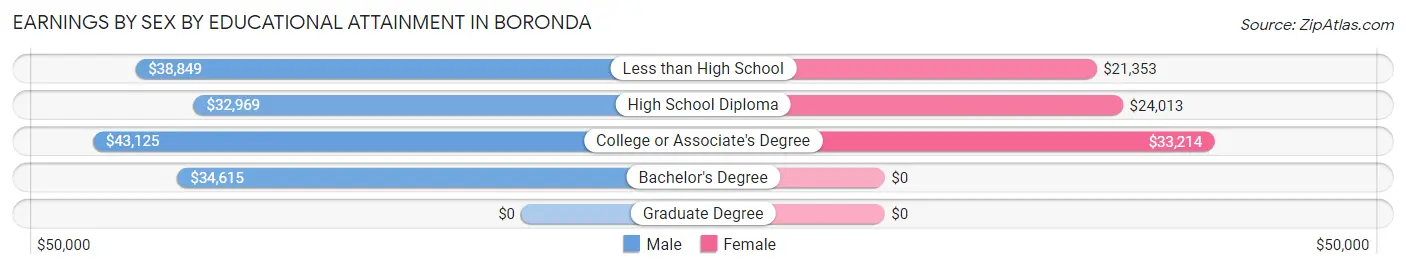
Earnings by Sex by Educational Attainment in Boronda
Average earnings in Boronda are $37,616 for men and $22,118 for women, a difference of 41.2%. Men with an educational attainment of college or associate's degree enjoy the highest average annual earnings of $43,125, while those with high school diploma education earn the least with $32,969. Women with an educational attainment of college or associate's degree earn the most with the average annual earnings of $33,214, while those with less than high school education have the smallest earnings of $21,353.
| Educational Attainment | Male Income | Female Income |
| Less than High School | $38,849 | $21,353 |
| High School Diploma | $32,969 | $24,013 |
| College or Associate's Degree | $43,125 | $33,214 |
| Bachelor's Degree | $34,615 | $0 |
| Graduate Degree | - | - |
| Total | $37,616 | $22,118 |
Family Income in Boronda
Family Income Brackets in Boronda
According to the Boronda family income data, there are 103 families falling into the $35,000 to $49,999 income range, which is the most common income bracket and makes up 27.5% of all families.
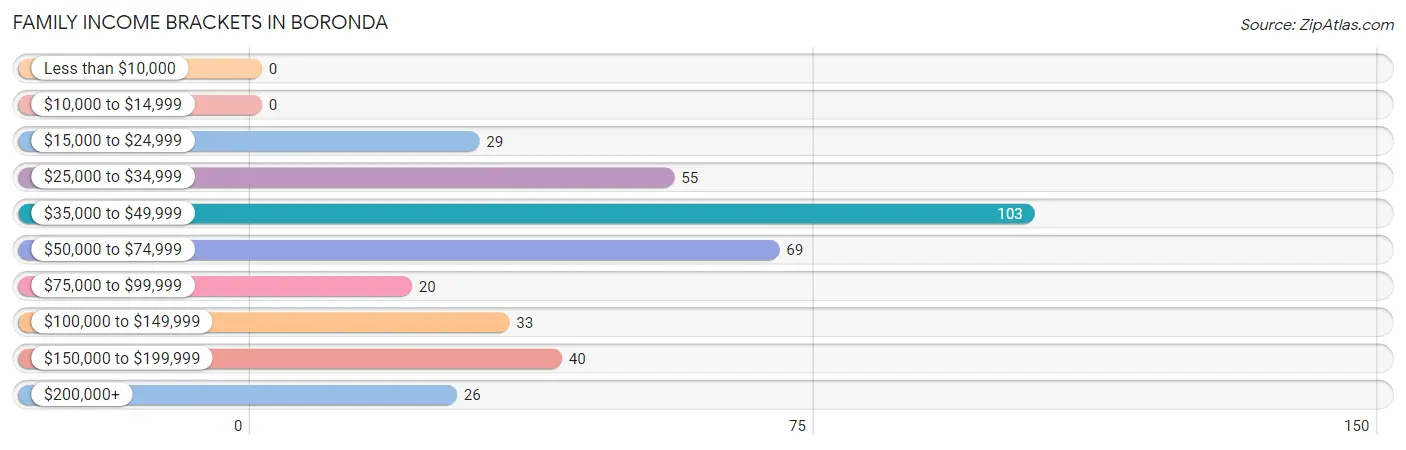
| Income Bracket | # Families | % Families |
| Less than $10,000 | 0 | 0.0% |
| $10,000 to $14,999 | 0 | 0.0% |
| $15,000 to $24,999 | 29 | 7.7% |
| $25,000 to $34,999 | 55 | 14.7% |
| $35,000 to $49,999 | 103 | 27.5% |
| $50,000 to $74,999 | 69 | 18.4% |
| $75,000 to $99,999 | 20 | 5.3% |
| $100,000 to $149,999 | 33 | 8.8% |
| $150,000 to $199,999 | 40 | 10.7% |
| $200,000+ | 26 | 6.9% |
Family Income by Famaliy Size in Boronda
4-person families (145 | 38.7%) account for the highest median family income in Boronda with $48,750 per family, while 4-person families (145 | 38.7%) have the highest median income of $12,188 per family member.
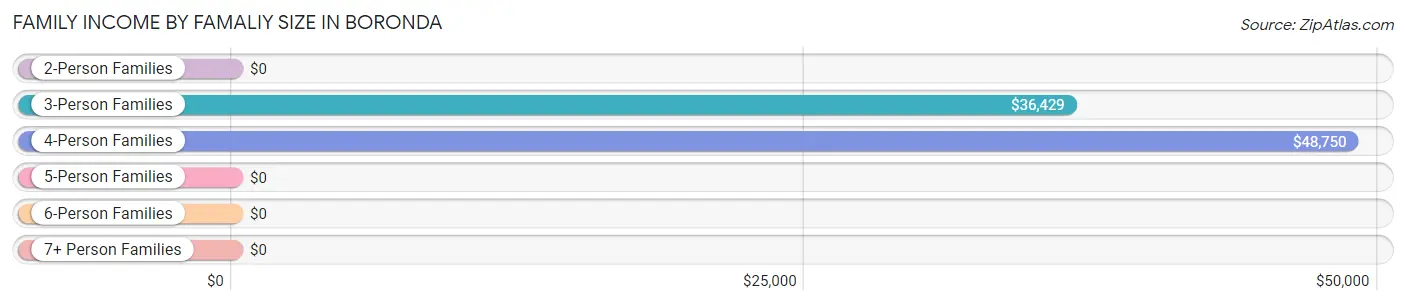
| Income Bracket | # Families | Median Income |
| 2-Person Families | 22 (5.9%) | $0 |
| 3-Person Families | 118 (31.5%) | $36,429 |
| 4-Person Families | 145 (38.7%) | $48,750 |
| 5-Person Families | 33 (8.8%) | $0 |
| 6-Person Families | 12 (3.2%) | $0 |
| 7+ Person Families | 45 (12.0%) | $0 |
| Total | 375 (100.0%) | $50,066 |
Family Income by Number of Earners in Boronda
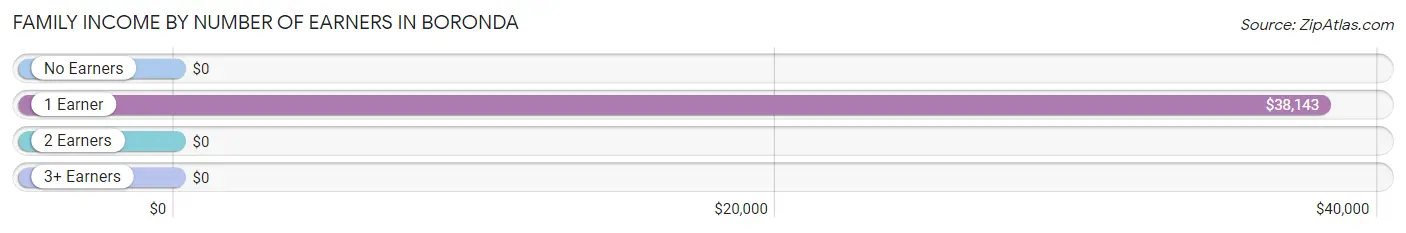
| Number of Earners | # Families | Median Income |
| No Earners | 7 (1.9%) | $0 |
| 1 Earner | 150 (40.0%) | $38,143 |
| 2 Earners | 120 (32.0%) | $0 |
| 3+ Earners | 98 (26.1%) | $0 |
| Total | 375 (100.0%) | $50,066 |
Household Income in Boronda
Household Income Brackets in Boronda
With 91 households falling in the category, the $100,000 to $149,999 income range is the most frequent in Boronda, accounting for 20.5% of all households.
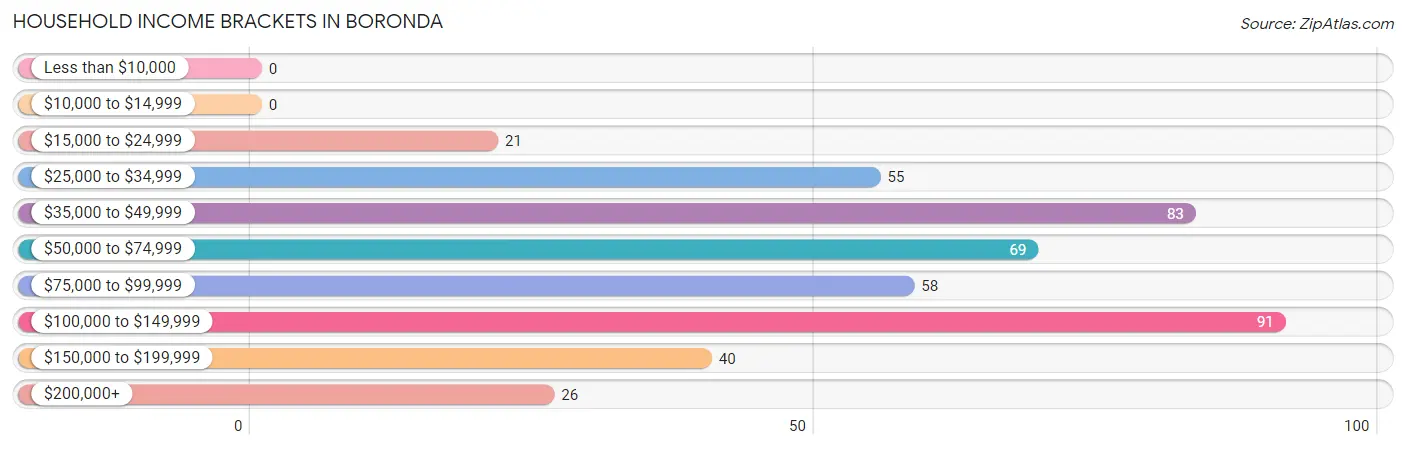
| Income Bracket | # Households | % Households |
| Less than $10,000 | 0 | 0.0% |
| $10,000 to $14,999 | 0 | 0.0% |
| $15,000 to $24,999 | 21 | 4.7% |
| $25,000 to $34,999 | 55 | 12.4% |
| $35,000 to $49,999 | 83 | 18.7% |
| $50,000 to $74,999 | 69 | 15.6% |
| $75,000 to $99,999 | 58 | 13.1% |
| $100,000 to $149,999 | 91 | 20.5% |
| $150,000 to $199,999 | 40 | 9.0% |
| $200,000+ | 26 | 5.9% |
Household Income by Householder Age in Boronda
The median household income in Boronda is $59,398, with the highest median household income of $77,083 found in the 25 to 44 years age bracket for the primary householder. A total of 80 households (18.1%) fall into this category. Meanwhile, the 15 to 24 years age bracket for the primary householder has the lowest median household income of $0, with 29 households (6.6%) in this group.
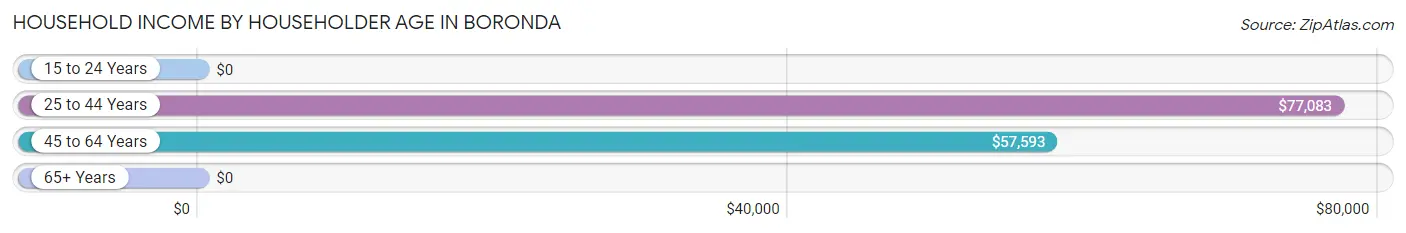
| Income Bracket | # Households | Median Income |
| 15 to 24 Years | 29 (6.6%) | $0 |
| 25 to 44 Years | 80 (18.1%) | $77,083 |
| 45 to 64 Years | 278 (62.7%) | $57,593 |
| 65+ Years | 56 (12.6%) | $0 |
| Total | 443 (100.0%) | $59,398 |
Poverty in Boronda
Income Below Poverty by Sex and Age in Boronda
With 13.0% poverty level for males and 7.9% for females among the residents of Boronda, 6 to 11 year old males and 35 to 44 year old females are the most vulnerable to poverty, with 34 males (69.4%) and 31 females (38.8%) in their respective age groups living below the poverty level.
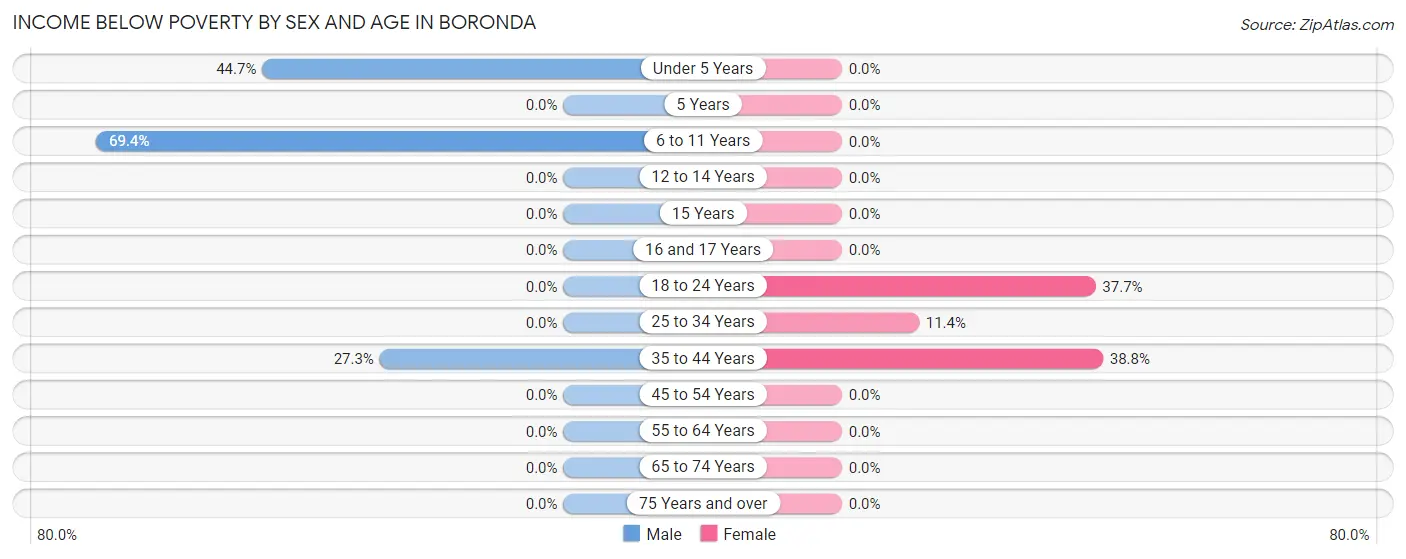
| Age Bracket | Male | Female |
| Under 5 Years | 38 (44.7%) | 0 (0.0%) |
| 5 Years | 0 (0.0%) | 0 (0.0%) |
| 6 to 11 Years | 34 (69.4%) | 0 (0.0%) |
| 12 to 14 Years | 0 (0.0%) | 0 (0.0%) |
| 15 Years | 0 (0.0%) | 0 (0.0%) |
| 16 and 17 Years | 0 (0.0%) | 0 (0.0%) |
| 18 to 24 Years | 0 (0.0%) | 29 (37.7%) |
| 25 to 34 Years | 0 (0.0%) | 16 (11.4%) |
| 35 to 44 Years | 48 (27.3%) | 31 (38.8%) |
| 45 to 54 Years | 0 (0.0%) | 0 (0.0%) |
| 55 to 64 Years | 0 (0.0%) | 0 (0.0%) |
| 65 to 74 Years | 0 (0.0%) | 0 (0.0%) |
| 75 Years and over | 0 (0.0%) | 0 (0.0%) |
| Total | 120 (13.0%) | 76 (7.9%) |
Income Above Poverty by Sex and Age in Boronda
According to the poverty statistics in Boronda, males aged 12 to 14 years and females aged under 5 years are the age groups that are most secure financially, with 100.0% of males and 100.0% of females in these age groups living above the poverty line.
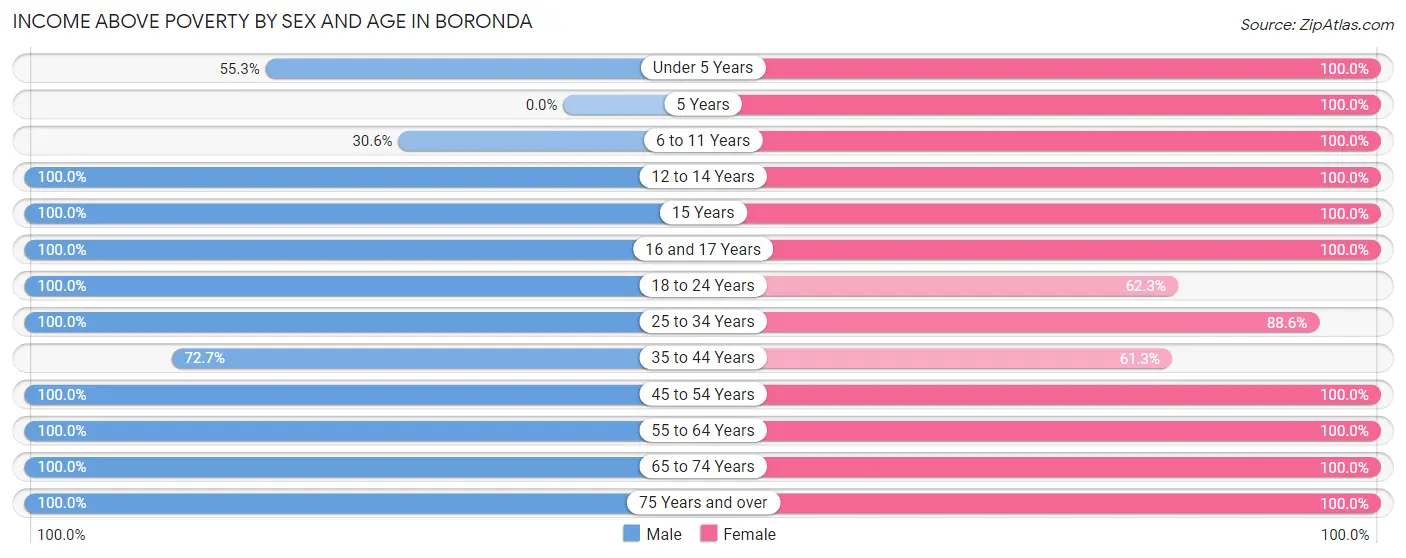
| Age Bracket | Male | Female |
| Under 5 Years | 47 (55.3%) | 15 (100.0%) |
| 5 Years | 0 (0.0%) | 24 (100.0%) |
| 6 to 11 Years | 15 (30.6%) | 64 (100.0%) |
| 12 to 14 Years | 45 (100.0%) | 49 (100.0%) |
| 15 Years | 13 (100.0%) | 22 (100.0%) |
| 16 and 17 Years | 16 (100.0%) | 46 (100.0%) |
| 18 to 24 Years | 68 (100.0%) | 48 (62.3%) |
| 25 to 34 Years | 131 (100.0%) | 124 (88.6%) |
| 35 to 44 Years | 128 (72.7%) | 49 (61.3%) |
| 45 to 54 Years | 138 (100.0%) | 223 (100.0%) |
| 55 to 64 Years | 110 (100.0%) | 143 (100.0%) |
| 65 to 74 Years | 85 (100.0%) | 57 (100.0%) |
| 75 Years and over | 6 (100.0%) | 23 (100.0%) |
| Total | 802 (87.0%) | 887 (92.1%) |
Income Below Poverty Among Married-Couple Families in Boronda
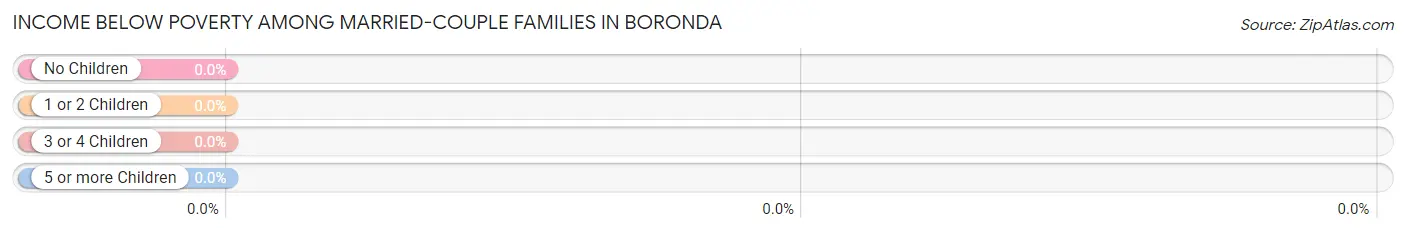
| Children | Above Poverty | Below Poverty |
| No Children | 71 (100.0%) | 0 (0.0%) |
| 1 or 2 Children | 176 (100.0%) | 0 (0.0%) |
| 3 or 4 Children | 33 (100.0%) | 0 (0.0%) |
| 5 or more Children | 0 (0.0%) | 0 (0.0%) |
| Total | 280 (100.0%) | 0 (0.0%) |
Income Below Poverty Among Single-Parent Households in Boronda
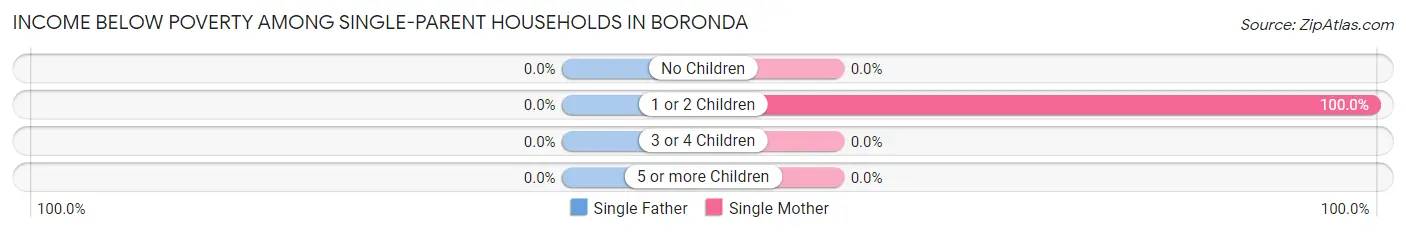
| Children | Single Father | Single Mother |
| No Children | 0 (0.0%) | 0 (0.0%) |
| 1 or 2 Children | 0 (0.0%) | 29 (100.0%) |
| 3 or 4 Children | 0 (0.0%) | 0 (0.0%) |
| 5 or more Children | 0 (0.0%) | 0 (0.0%) |
| Total | 0 (0.0%) | 29 (30.5%) |
Income Below Poverty Among Married-Couple vs Single-Parent Households in Boronda
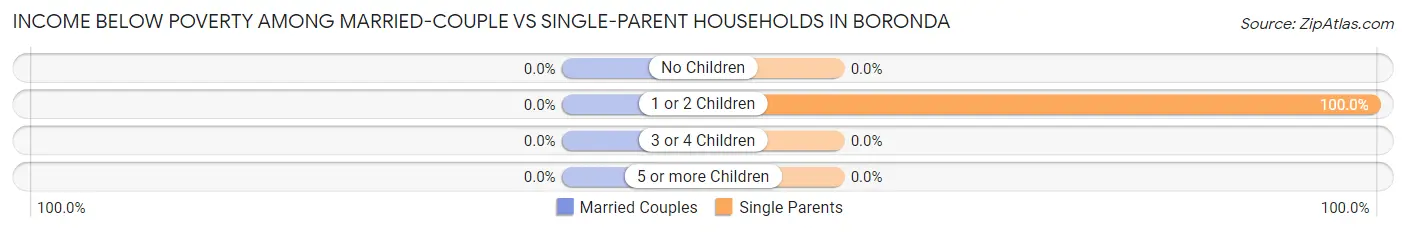
| Children | Married-Couple Families | Single-Parent Households |
| No Children | 0 (0.0%) | 0 (0.0%) |
| 1 or 2 Children | 0 (0.0%) | 29 (100.0%) |
| 3 or 4 Children | 0 (0.0%) | 0 (0.0%) |
| 5 or more Children | 0 (0.0%) | 0 (0.0%) |
| Total | 0 (0.0%) | 29 (30.5%) |
Race in Boronda
The most populous races in Boronda are Hispanic or Latino (1,576 | 83.6%), Some other Race (1,273 | 67.5%), and Two or more Races (214 | 11.4%).
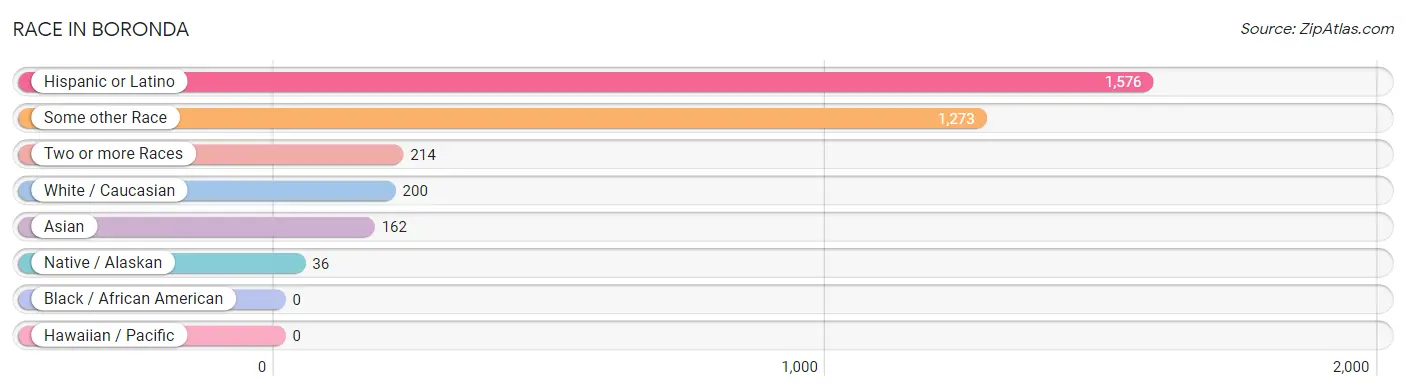
| Race | # Population | % Population |
| Asian | 162 | 8.6% |
| Black / African American | 0 | 0.0% |
| Hawaiian / Pacific | 0 | 0.0% |
| Hispanic or Latino | 1,576 | 83.6% |
| Native / Alaskan | 36 | 1.9% |
| White / Caucasian | 200 | 10.6% |
| Two or more Races | 214 | 11.4% |
| Some other Race | 1,273 | 67.5% |
| Total | 1,885 | 100.0% |
Ancestry in Boronda
The most populous ancestries reported in Boronda are Mexican (1,576 | 83.6%), Korean (182 | 9.7%), Italian (101 | 5.4%), American (39 | 2.1%), and Native Hawaiian (20 | 1.1%), together accounting for 101.8% of all Boronda residents.
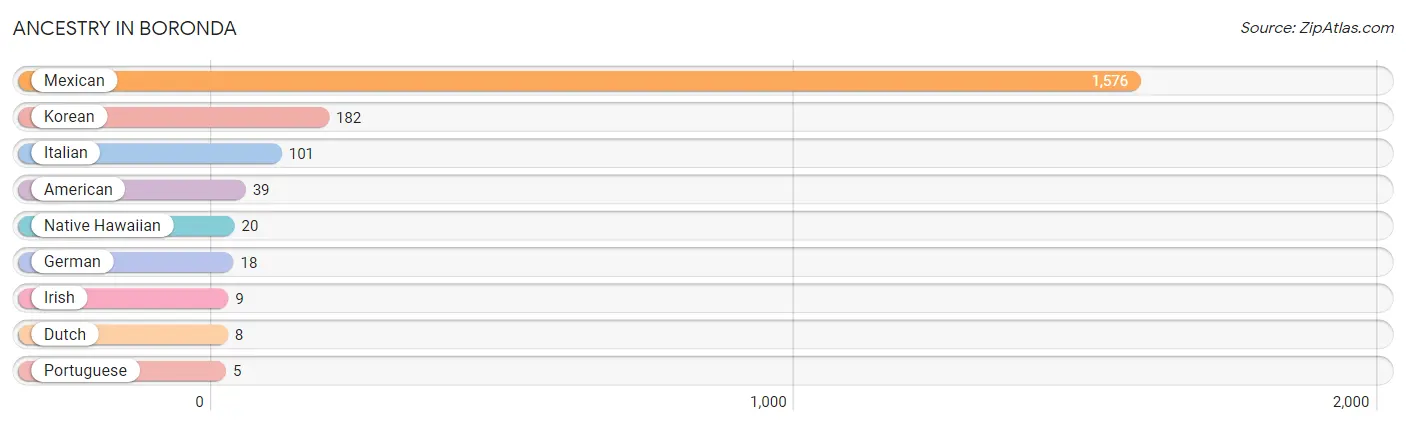
| Ancestry | # Population | % Population |
| American | 39 | 2.1% |
| Dutch | 8 | 0.4% |
| German | 18 | 0.9% |
| Irish | 9 | 0.5% |
| Italian | 101 | 5.4% |
| Korean | 182 | 9.7% |
| Mexican | 1,576 | 83.6% |
| Native Hawaiian | 20 | 1.1% |
| Portuguese | 5 | 0.3% | View All 9 Rows |
Immigrants in Boronda
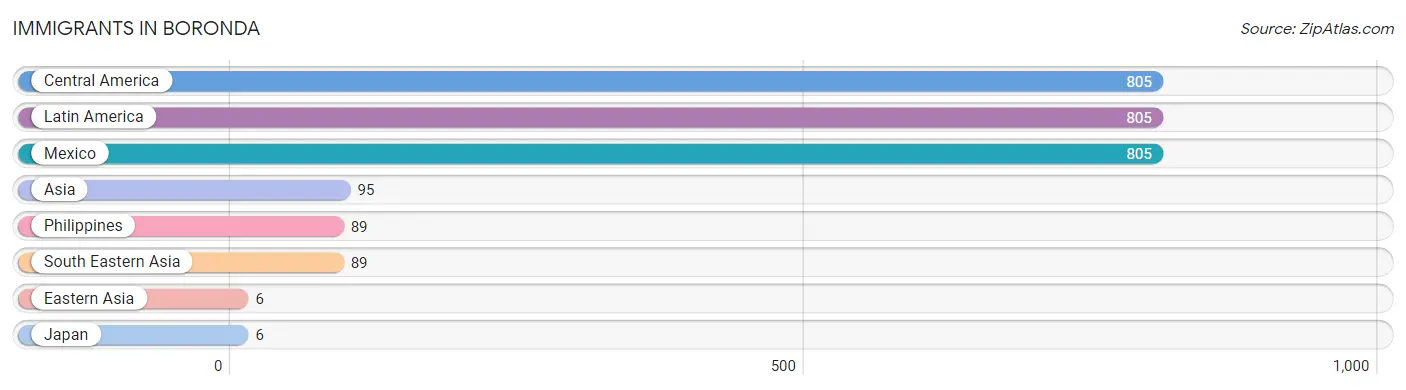
The most numerous immigrant groups reported in Boronda came from Central America (805 | 42.7%), Latin America (805 | 42.7%), Mexico (805 | 42.7%), Asia (95 | 5.0%), and Philippines (89 | 4.7%), together accounting for 137.9% of all Boronda residents.
| Immigration Origin | # Population | % Population |
| Asia | 95 | 5.0% |
| Central America | 805 | 42.7% |
| Eastern Asia | 6 | 0.3% |
| Japan | 6 | 0.3% |
| Latin America | 805 | 42.7% |
| Mexico | 805 | 42.7% |
| Philippines | 89 | 4.7% |
| South Eastern Asia | 89 | 4.7% | View All 8 Rows |
Sex and Age in Boronda
Sex and Age in Boronda
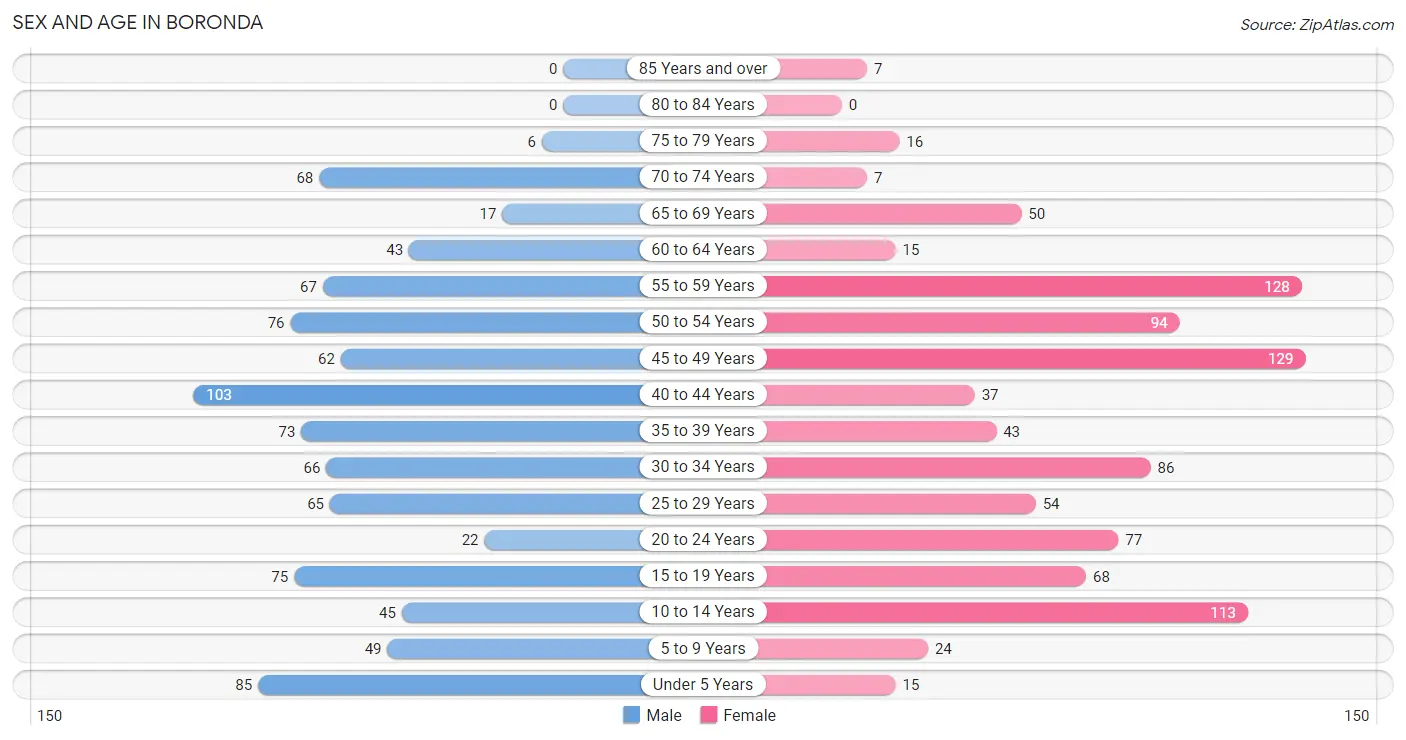
The most populous age groups in Boronda are 40 to 44 Years (103 | 11.2%) for men and 45 to 49 Years (129 | 13.4%) for women.
| Age Bracket | Male | Female |
| Under 5 Years | 85 (9.2%) | 15 (1.6%) |
| 5 to 9 Years | 49 (5.3%) | 24 (2.5%) |
| 10 to 14 Years | 45 (4.9%) | 113 (11.7%) |
| 15 to 19 Years | 75 (8.1%) | 68 (7.1%) |
| 20 to 24 Years | 22 (2.4%) | 77 (8.0%) |
| 25 to 29 Years | 65 (7.0%) | 54 (5.6%) |
| 30 to 34 Years | 66 (7.2%) | 86 (8.9%) |
| 35 to 39 Years | 73 (7.9%) | 43 (4.5%) |
| 40 to 44 Years | 103 (11.2%) | 37 (3.8%) |
| 45 to 49 Years | 62 (6.7%) | 129 (13.4%) |
| 50 to 54 Years | 76 (8.2%) | 94 (9.8%) |
| 55 to 59 Years | 67 (7.3%) | 128 (13.3%) |
| 60 to 64 Years | 43 (4.7%) | 15 (1.6%) |
| 65 to 69 Years | 17 (1.8%) | 50 (5.2%) |
| 70 to 74 Years | 68 (7.4%) | 7 (0.7%) |
| 75 to 79 Years | 6 (0.6%) | 16 (1.7%) |
| 80 to 84 Years | 0 (0.0%) | 0 (0.0%) |
| 85 Years and over | 0 (0.0%) | 7 (0.7%) |
| Total | 922 (100.0%) | 963 (100.0%) |
Families and Households in Boronda
Median Family Size in Boronda
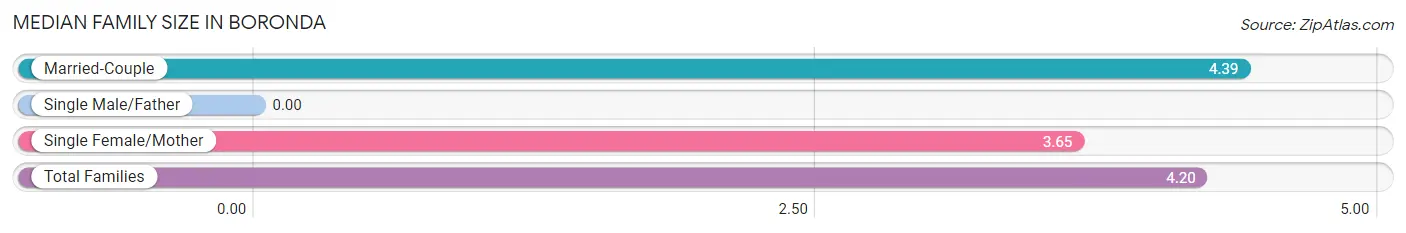
| Family Type | # Families | Family Size |
| Married-Couple | 280 (74.7%) | 4.39 |
| Single Male/Father | 0 (0.0%) | - |
| Single Female/Mother | 95 (25.3%) | 3.65 |
| Total Families | 375 (100.0%) | 4.20 |
Median Household Size in Boronda
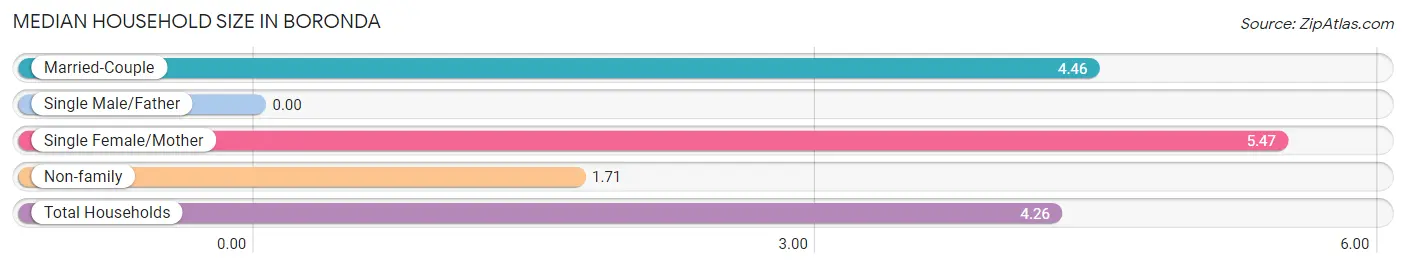
| Household Type | # Households | Household Size |
| Married-Couple | 280 (63.2%) | 4.46 |
| Single Male/Father | 0 (0.0%) | - |
| Single Female/Mother | 95 (21.4%) | 5.47 |
| Non-family | 68 (15.3%) | 1.71 |
| Total Households | 443 (100.0%) | 4.26 |
Household Size by Marriage Status in Boronda
Out of a total of 443 households in Boronda, 375 (84.7%) are family households, while 68 (15.3%) are nonfamily households. The most numerous type of family households are 4-person households, comprising 116, and the most common type of nonfamily households are 1-person households, comprising 51.
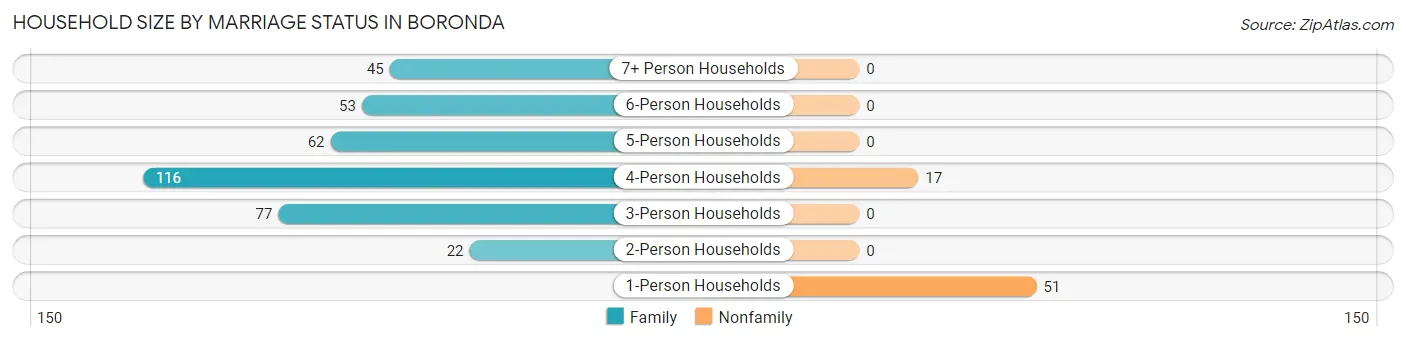
| Household Size | Family Households | Nonfamily Households |
| 1-Person Households | - | 51 (11.5%) |
| 2-Person Households | 22 (5.0%) | 0 (0.0%) |
| 3-Person Households | 77 (17.4%) | 0 (0.0%) |
| 4-Person Households | 116 (26.2%) | 17 (3.8%) |
| 5-Person Households | 62 (14.0%) | 0 (0.0%) |
| 6-Person Households | 53 (12.0%) | 0 (0.0%) |
| 7+ Person Households | 45 (10.2%) | 0 (0.0%) |
| Total | 375 (84.7%) | 68 (15.3%) |
Female Fertility in Boronda
Fertility by Age in Boronda
Average fertility rate in Boronda is 67.0 births per 1,000 women. Women in the age bracket of 20 to 34 years have the highest fertility rate with 111.0 births per 1,000 women. Women in the age bracket of 20 to 34 years acount for 66.7% of all women with births.
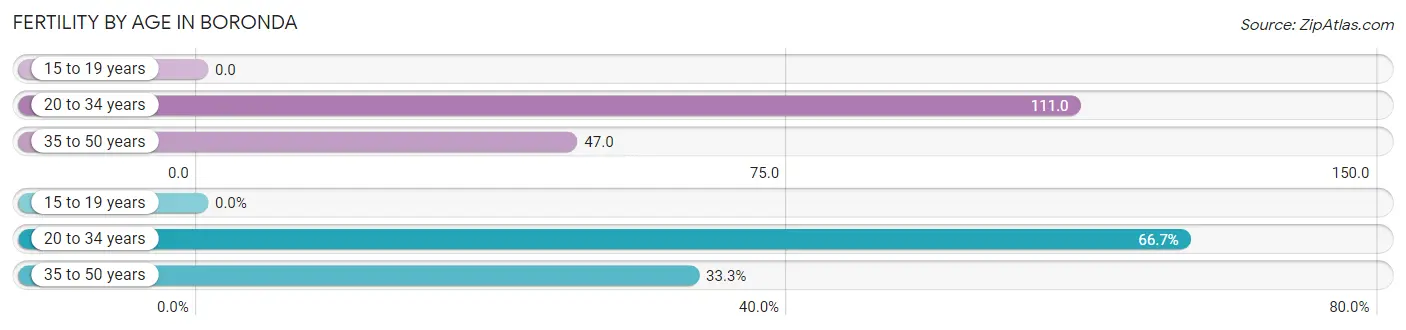
| Age Bracket | Women with Births | Births / 1,000 Women |
| 15 to 19 years | 0 (0.0%) | 0.0 |
| 20 to 34 years | 24 (66.7%) | 111.0 |
| 35 to 50 years | 12 (33.3%) | 47.0 |
| Total | 36 (100.0%) | 67.0 |
Fertility by Age by Marriage Status in Boronda
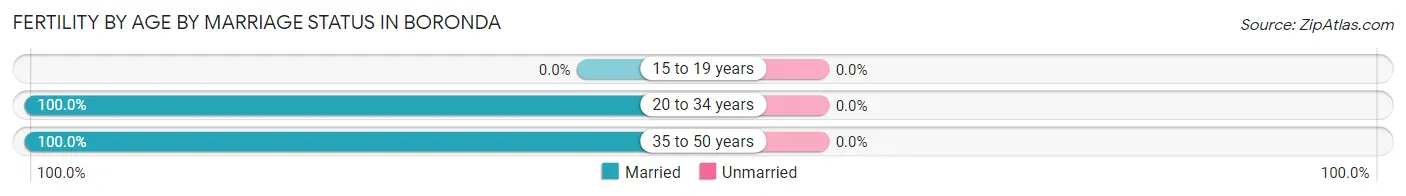
| Age Bracket | Married | Unmarried |
| 15 to 19 years | 0 (0.0%) | 0 (0.0%) |
| 20 to 34 years | 24 (100.0%) | 0 (0.0%) |
| 35 to 50 years | 12 (100.0%) | 0 (0.0%) |
| Total | 36 (100.0%) | 0 (0.0%) |
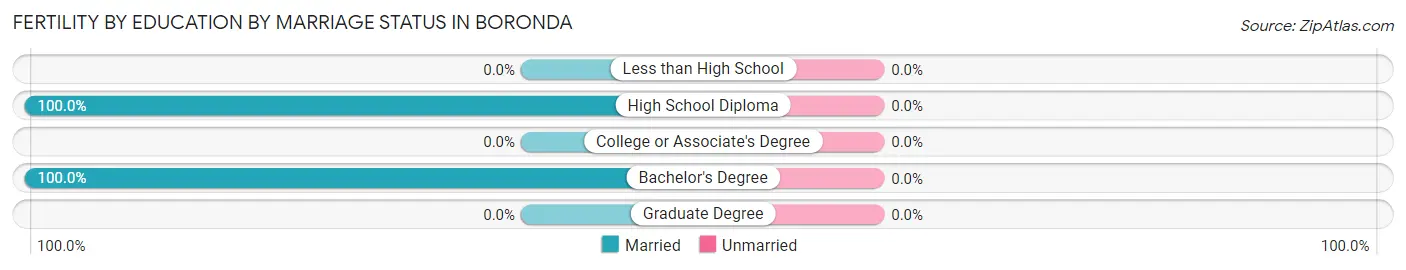
Fertility by Education in Boronda
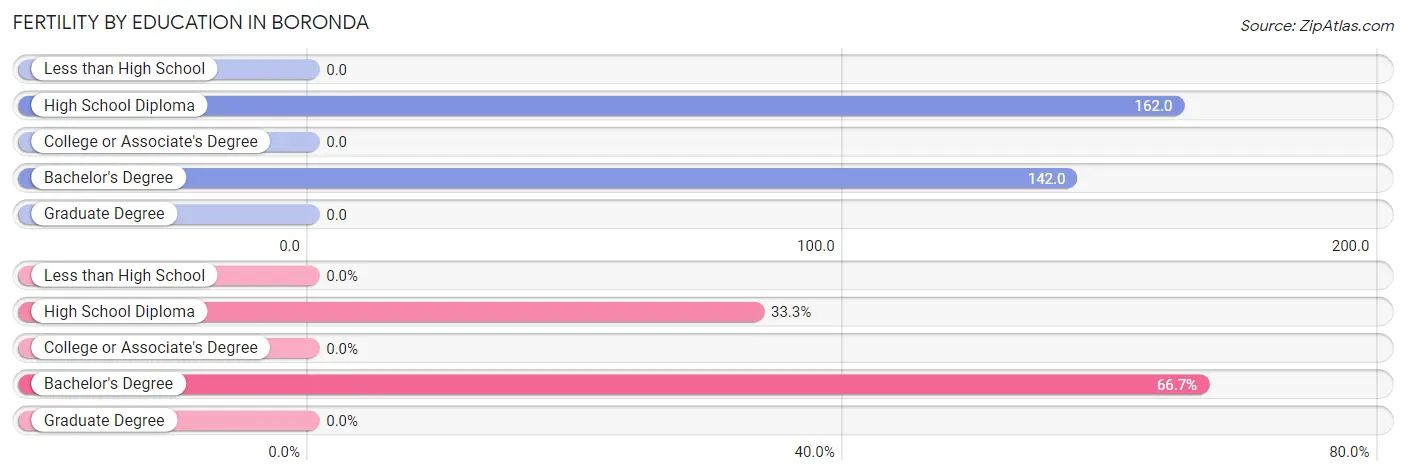
| Educational Attainment | Women with Births | Births / 1,000 Women |
| Less than High School | 0 (0.0%) | 0.0 |
| High School Diploma | 12 (33.3%) | 162.0 |
| College or Associate's Degree | 0 (0.0%) | 0.0 |
| Bachelor's Degree | 24 (66.7%) | 142.0 |
| Graduate Degree | 0 (0.0%) | 0.0 |
| Total | 36 (100.0%) | 67.0 |
Fertility by Education by Marriage Status in Boronda
| Educational Attainment | Married | Unmarried |
| Less than High School | 0 (0.0%) | 0 (0.0%) |
| High School Diploma | 12 (100.0%) | 0 (0.0%) |
| College or Associate's Degree | 0 (0.0%) | 0 (0.0%) |
| Bachelor's Degree | 24 (100.0%) | 0 (0.0%) |
| Graduate Degree | 0 (0.0%) | 0 (0.0%) |
| Total | 36 (100.0%) | 0 (0.0%) |
Employment Characteristics in Boronda
Employment by Class of Employer in Boronda
Among the 843 employed individuals in Boronda, private company employees (728 | 86.4%), self-employed (not incorporated) (37 | 4.4%), and local government employees (36 | 4.3%) make up the most common classes of employment.
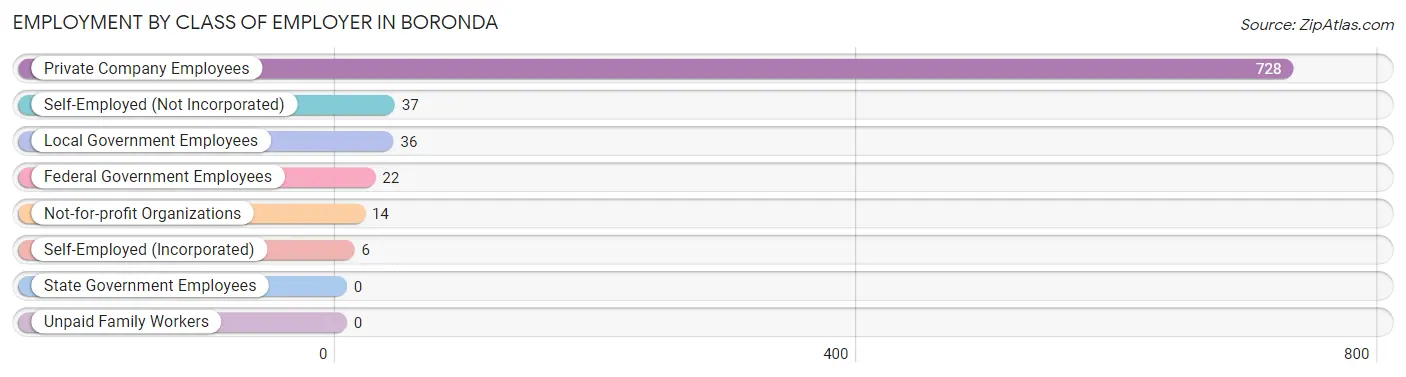
| Employer Class | # Employees | % Employees |
| Private Company Employees | 728 | 86.4% |
| Self-Employed (Incorporated) | 6 | 0.7% |
| Self-Employed (Not Incorporated) | 37 | 4.4% |
| Not-for-profit Organizations | 14 | 1.7% |
| Local Government Employees | 36 | 4.3% |
| State Government Employees | 0 | 0.0% |
| Federal Government Employees | 22 | 2.6% |
| Unpaid Family Workers | 0 | 0.0% |
| Total | 843 | 100.0% |
Employment Status by Age in Boronda
According to the labor force statistics for Boronda, out of the total population over 16 years of age (1,519), 67.0% or 1,018 individuals are in the labor force, with 17.1% or 174 of them unemployed. The age group with the highest labor force participation rate is 60 to 64 years, with 100.0% or 58 individuals in the labor force. Within the labor force, the 20 to 24 years age range has the highest percentage of unemployed individuals, with 39.6% or 19 of them being unemployed.
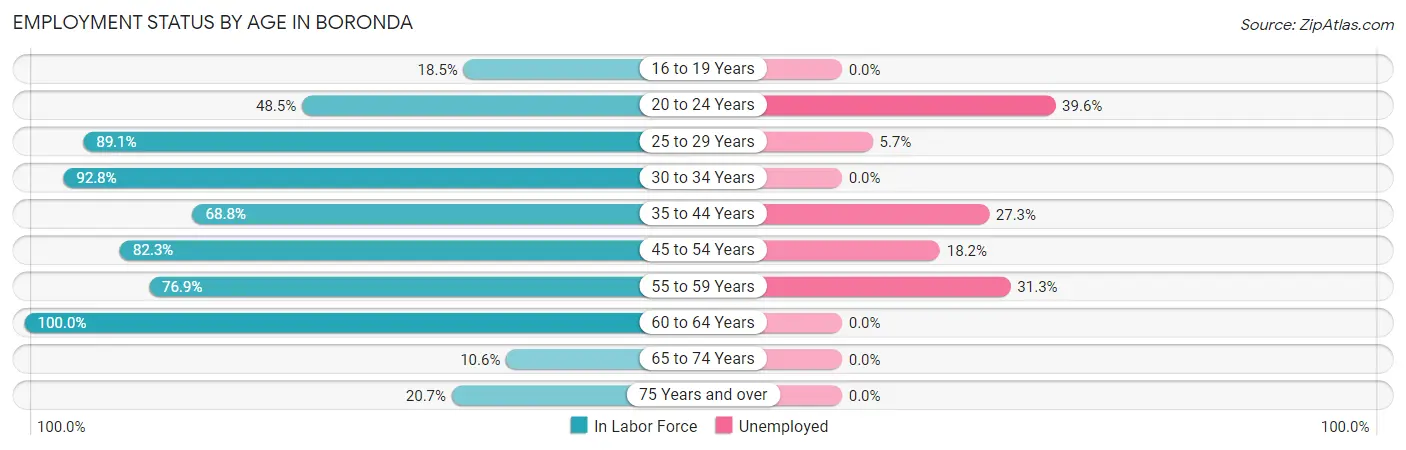
| Age Bracket | In Labor Force | Unemployed |
| 16 to 19 Years | 20 (18.5%) | 0 (0.0%) |
| 20 to 24 Years | 48 (48.5%) | 19 (39.6%) |
| 25 to 29 Years | 106 (89.1%) | 6 (5.7%) |
| 30 to 34 Years | 141 (92.8%) | 0 (0.0%) |
| 35 to 44 Years | 176 (68.8%) | 48 (27.3%) |
| 45 to 54 Years | 297 (82.3%) | 54 (18.2%) |
| 55 to 59 Years | 150 (76.9%) | 47 (31.3%) |
| 60 to 64 Years | 58 (100.0%) | 0 (0.0%) |
| 65 to 74 Years | 15 (10.6%) | 0 (0.0%) |
| 75 Years and over | 6 (20.7%) | 0 (0.0%) |
| Total | 1,018 (67.0%) | 174 (17.1%) |
Employment Status by Educational Attainment in Boronda
According to labor force statistics for Boronda, 81.3% of individuals (928) out of the total population between 25 and 64 years of age (1,141) are in the labor force, with 16.7% or 155 of them being unemployed. The group with the highest labor force participation rate are those with the educational attainment of bachelor's degree or higher, with 100.0% or 227 individuals in the labor force. Within the labor force, individuals with high school diploma education have the highest percentage of unemployment, with 43.7% or 108 of them being unemployed.
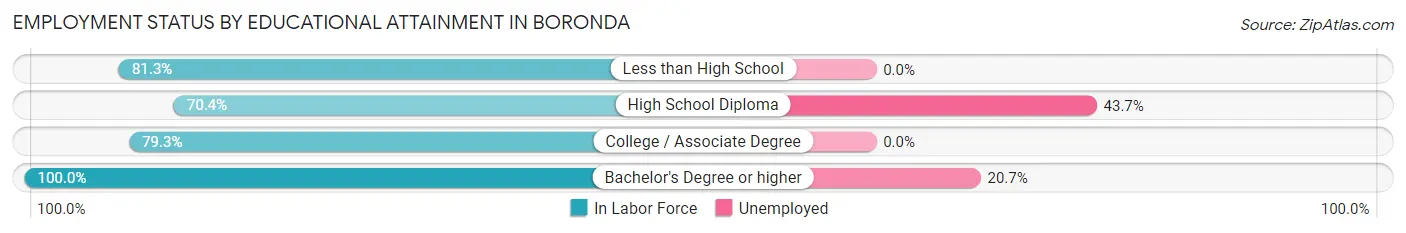
| Educational Attainment | In Labor Force | Unemployed |
| Less than High School | 312 (81.3%) | 0 (0.0%) |
| High School Diploma | 247 (70.4%) | 153 (43.7%) |
| College / Associate Degree | 142 (79.3%) | 0 (0.0%) |
| Bachelor's Degree or higher | 227 (100.0%) | 47 (20.7%) |
| Total | 928 (81.3%) | 191 (16.7%) |
Employment Occupations by Sex in Boronda
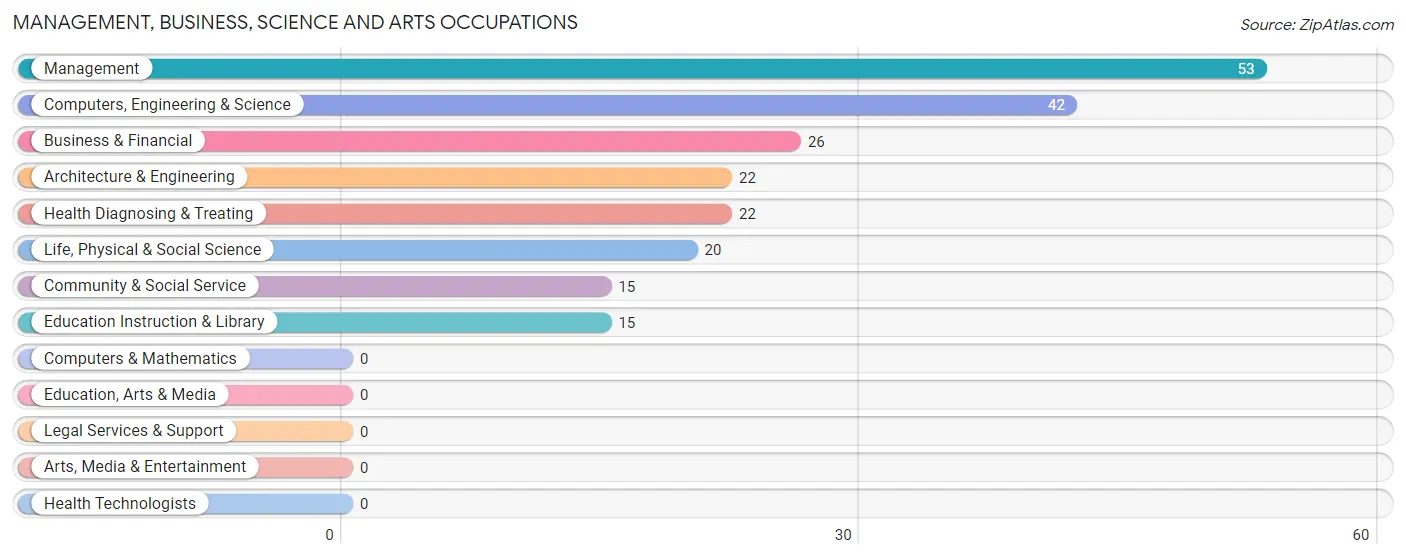
Management, Business, Science and Arts Occupations
The most common Management, Business, Science and Arts occupations in Boronda are Management (53 | 6.3%), Computers, Engineering & Science (42 | 5.0%), Business & Financial (26 | 3.1%), Architecture & Engineering (22 | 2.6%), and Health Diagnosing & Treating (22 | 2.6%).
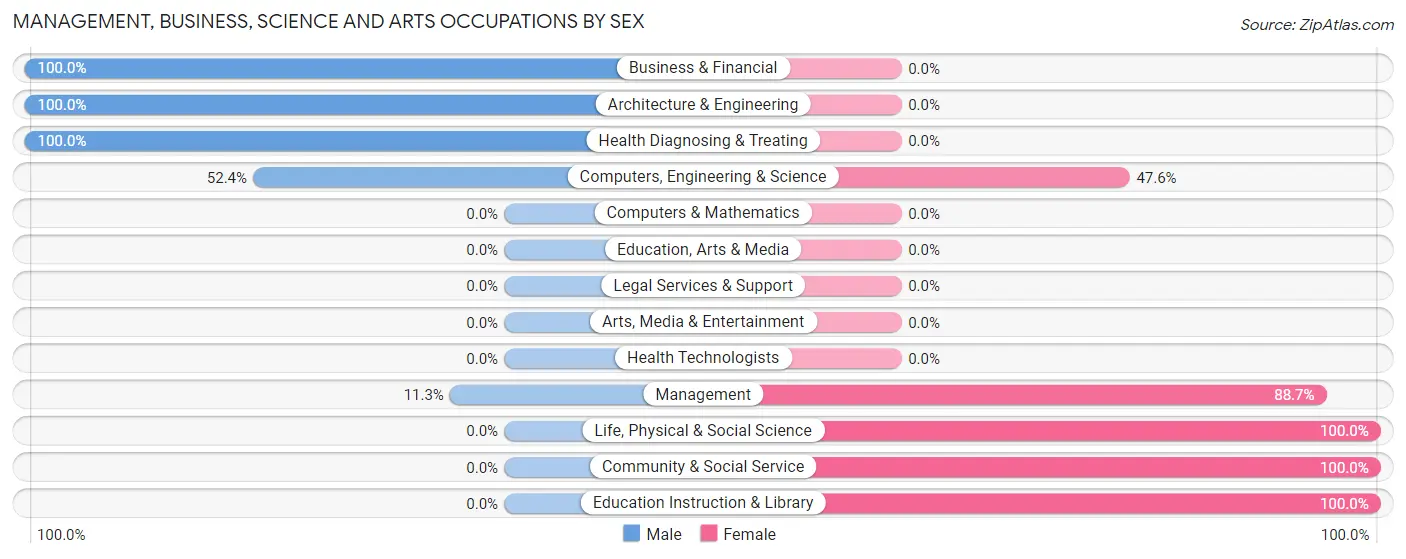
Management, Business, Science and Arts Occupations by Sex
Within the Management, Business, Science and Arts occupations in Boronda, the most male-oriented occupations are Business & Financial (100.0%), Architecture & Engineering (100.0%), and Health Diagnosing & Treating (100.0%), while the most female-oriented occupations are Life, Physical & Social Science (100.0%), Community & Social Service (100.0%), and Education Instruction & Library (100.0%).
| Occupation | Male | Female |
| Management | 6 (11.3%) | 47 (88.7%) |
| Business & Financial | 26 (100.0%) | 0 (0.0%) |
| Computers, Engineering & Science | 22 (52.4%) | 20 (47.6%) |
| Computers & Mathematics | 0 (0.0%) | 0 (0.0%) |
| Architecture & Engineering | 22 (100.0%) | 0 (0.0%) |
| Life, Physical & Social Science | 0 (0.0%) | 20 (100.0%) |
| Community & Social Service | 0 (0.0%) | 15 (100.0%) |
| Education, Arts & Media | 0 (0.0%) | 0 (0.0%) |
| Legal Services & Support | 0 (0.0%) | 0 (0.0%) |
| Education Instruction & Library | 0 (0.0%) | 15 (100.0%) |
| Arts, Media & Entertainment | 0 (0.0%) | 0 (0.0%) |
| Health Diagnosing & Treating | 22 (100.0%) | 0 (0.0%) |
| Health Technologists | 0 (0.0%) | 0 (0.0%) |
| Total (Category) | 76 (48.1%) | 82 (51.9%) |
| Total (Overall) | 433 (51.4%) | 410 (48.6%) |
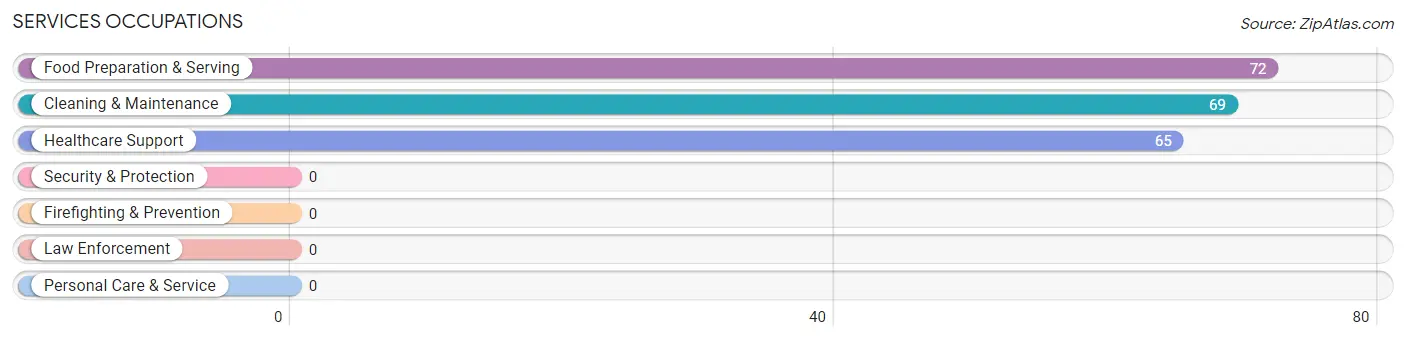
Services Occupations
The most common Services occupations in Boronda are Food Preparation & Serving (72 | 8.5%), Cleaning & Maintenance (69 | 8.2%), and Healthcare Support (65 | 7.7%).
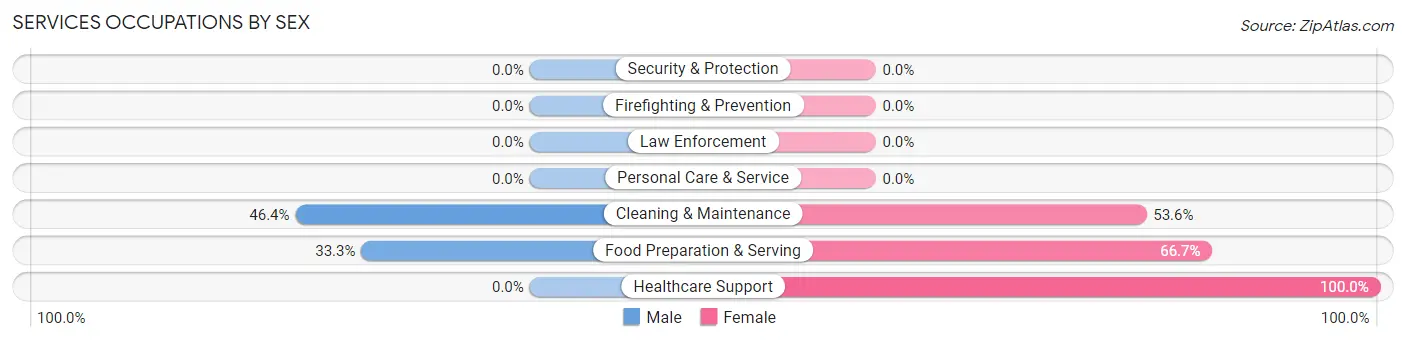
Services Occupations by Sex
Within the Services occupations in Boronda, the most male-oriented occupations are Cleaning & Maintenance (46.4%), and Food Preparation & Serving (33.3%), while the most female-oriented occupations are Healthcare Support (100.0%), Food Preparation & Serving (66.7%), and Cleaning & Maintenance (53.6%).
| Occupation | Male | Female |
| Healthcare Support | 0 (0.0%) | 65 (100.0%) |
| Security & Protection | 0 (0.0%) | 0 (0.0%) |
| Firefighting & Prevention | 0 (0.0%) | 0 (0.0%) |
| Law Enforcement | 0 (0.0%) | 0 (0.0%) |
| Food Preparation & Serving | 24 (33.3%) | 48 (66.7%) |
| Cleaning & Maintenance | 32 (46.4%) | 37 (53.6%) |
| Personal Care & Service | 0 (0.0%) | 0 (0.0%) |
| Total (Category) | 56 (27.2%) | 150 (72.8%) |
| Total (Overall) | 433 (51.4%) | 410 (48.6%) |
Sales and Office Occupations
The most common Sales and Office occupations in Boronda are Office & Administration (99 | 11.7%), and Sales & Related (44 | 5.2%).
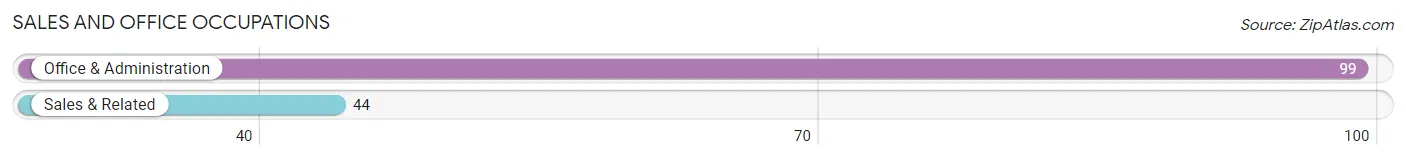
Sales and Office Occupations by Sex
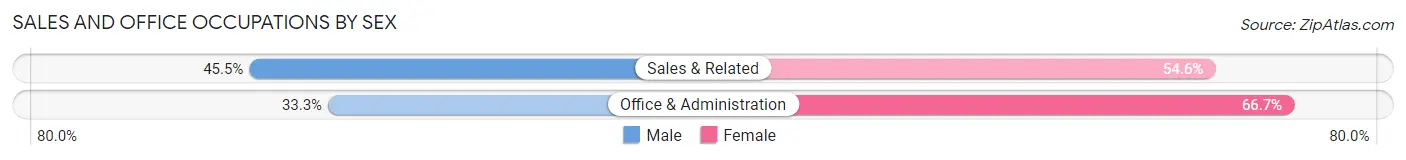
| Occupation | Male | Female |
| Sales & Related | 20 (45.5%) | 24 (54.5%) |
| Office & Administration | 33 (33.3%) | 66 (66.7%) |
| Total (Category) | 53 (37.1%) | 90 (62.9%) |
| Total (Overall) | 433 (51.4%) | 410 (48.6%) |
Natural Resources, Construction and Maintenance Occupations
The most common Natural Resources, Construction and Maintenance occupations in Boronda are Farming, Fishing & Forestry (143 | 17.0%), Construction & Extraction (66 | 7.8%), and Installation, Maintenance & Repair (50 | 5.9%).
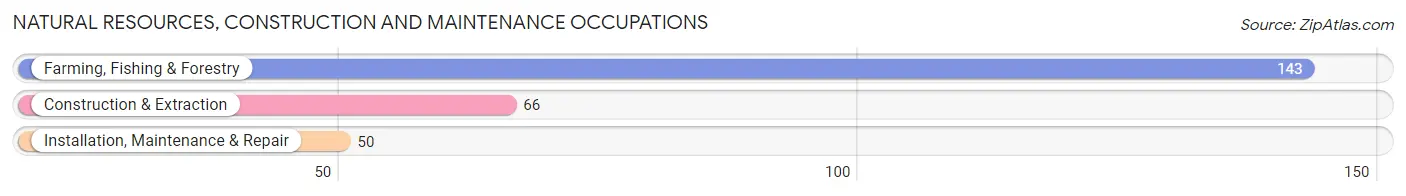
Natural Resources, Construction and Maintenance Occupations by Sex
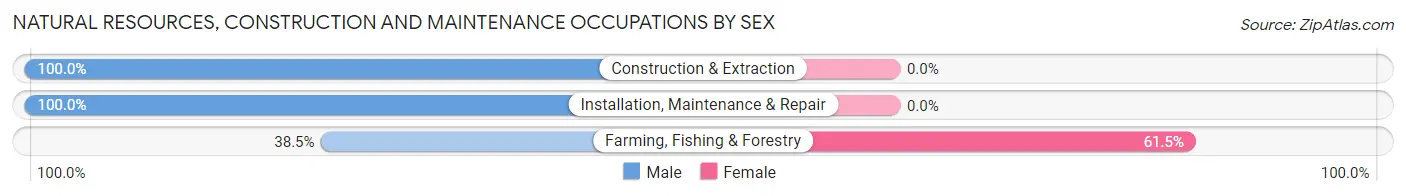
| Occupation | Male | Female |
| Farming, Fishing & Forestry | 55 (38.5%) | 88 (61.5%) |
| Construction & Extraction | 66 (100.0%) | 0 (0.0%) |
| Installation, Maintenance & Repair | 50 (100.0%) | 0 (0.0%) |
| Total (Category) | 171 (66.0%) | 88 (34.0%) |
| Total (Overall) | 433 (51.4%) | 410 (48.6%) |
Production, Transportation and Moving Occupations
The most common Production, Transportation and Moving occupations in Boronda are Transportation (72 | 8.5%), and Material Moving (5 | 0.6%).
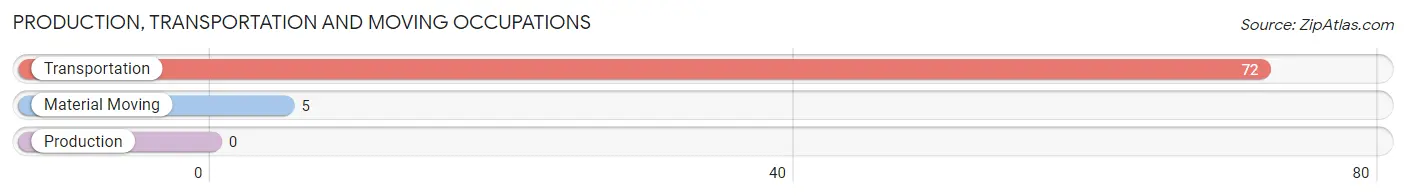
Production, Transportation and Moving Occupations by Sex
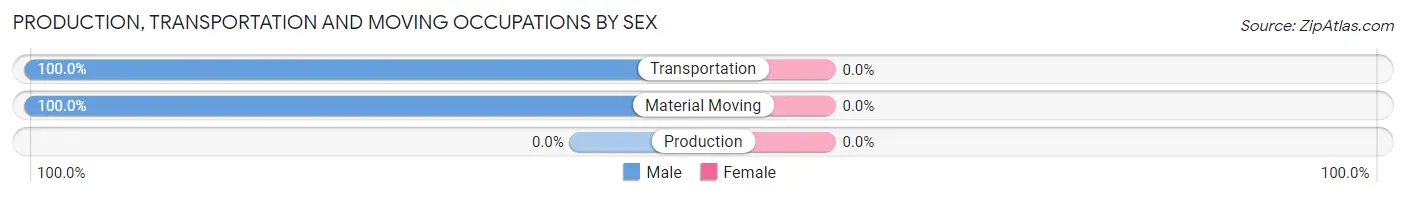
| Occupation | Male | Female |
| Production | 0 (0.0%) | 0 (0.0%) |
| Transportation | 72 (100.0%) | 0 (0.0%) |
| Material Moving | 5 (100.0%) | 0 (0.0%) |
| Total (Category) | 77 (100.0%) | 0 (0.0%) |
| Total (Overall) | 433 (51.4%) | 410 (48.6%) |
Employment Industries by Sex in Boronda
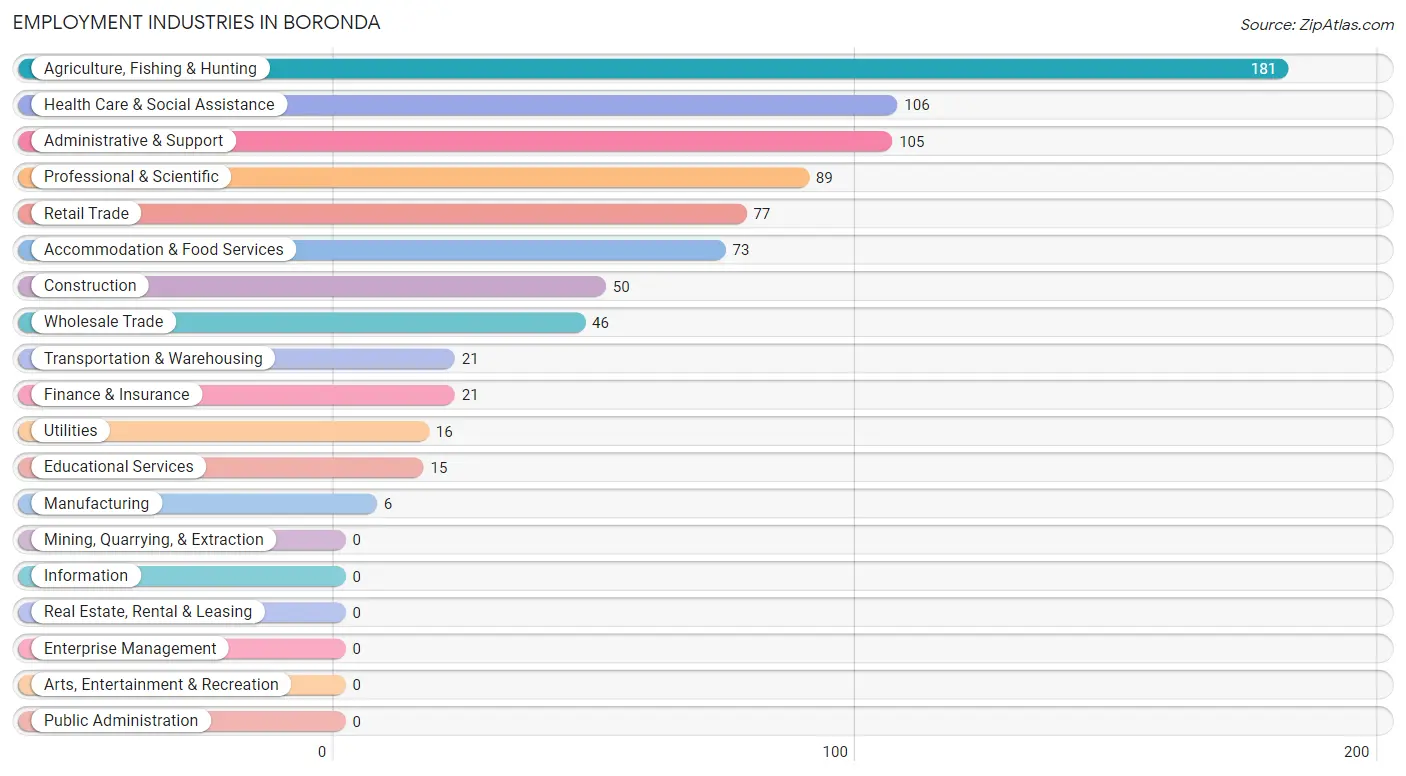
Employment Industries in Boronda
The major employment industries in Boronda include Agriculture, Fishing & Hunting (181 | 21.5%), Health Care & Social Assistance (106 | 12.6%), Administrative & Support (105 | 12.5%), Professional & Scientific (89 | 10.6%), and Retail Trade (77 | 9.1%).
Employment Industries by Sex in Boronda
The Boronda industries that see more men than women are Construction (100.0%), Manufacturing (100.0%), and Wholesale Trade (100.0%), whereas the industries that tend to have a higher number of women are Finance & Insurance (100.0%), Educational Services (100.0%), and Health Care & Social Assistance (81.1%).
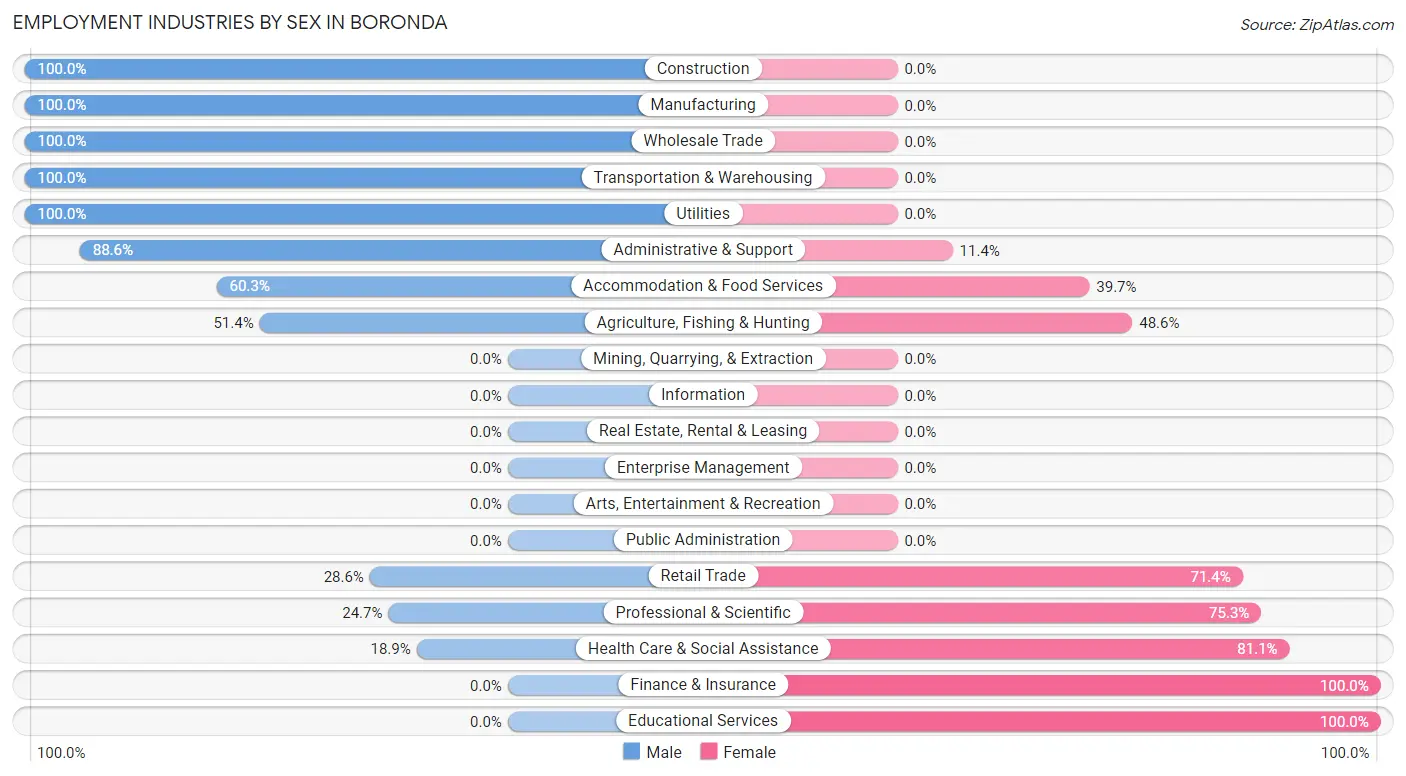
| Industry | Male | Female |
| Agriculture, Fishing & Hunting | 93 (51.4%) | 88 (48.6%) |
| Mining, Quarrying, & Extraction | 0 (0.0%) | 0 (0.0%) |
| Construction | 50 (100.0%) | 0 (0.0%) |
| Manufacturing | 6 (100.0%) | 0 (0.0%) |
| Wholesale Trade | 46 (100.0%) | 0 (0.0%) |
| Retail Trade | 22 (28.6%) | 55 (71.4%) |
| Transportation & Warehousing | 21 (100.0%) | 0 (0.0%) |
| Utilities | 16 (100.0%) | 0 (0.0%) |
| Information | 0 (0.0%) | 0 (0.0%) |
| Finance & Insurance | 0 (0.0%) | 21 (100.0%) |
| Real Estate, Rental & Leasing | 0 (0.0%) | 0 (0.0%) |
| Professional & Scientific | 22 (24.7%) | 67 (75.3%) |
| Enterprise Management | 0 (0.0%) | 0 (0.0%) |
| Administrative & Support | 93 (88.6%) | 12 (11.4%) |
| Educational Services | 0 (0.0%) | 15 (100.0%) |
| Health Care & Social Assistance | 20 (18.9%) | 86 (81.1%) |
| Arts, Entertainment & Recreation | 0 (0.0%) | 0 (0.0%) |
| Accommodation & Food Services | 44 (60.3%) | 29 (39.7%) |
| Public Administration | 0 (0.0%) | 0 (0.0%) |
| Total | 433 (51.4%) | 410 (48.6%) |
Education in Boronda
School Enrollment in Boronda
The most common levels of schooling among the 569 students in Boronda are college / undergraduate (144 | 25.3%), high school (137 | 24.1%), and middle school (109 | 19.2%).
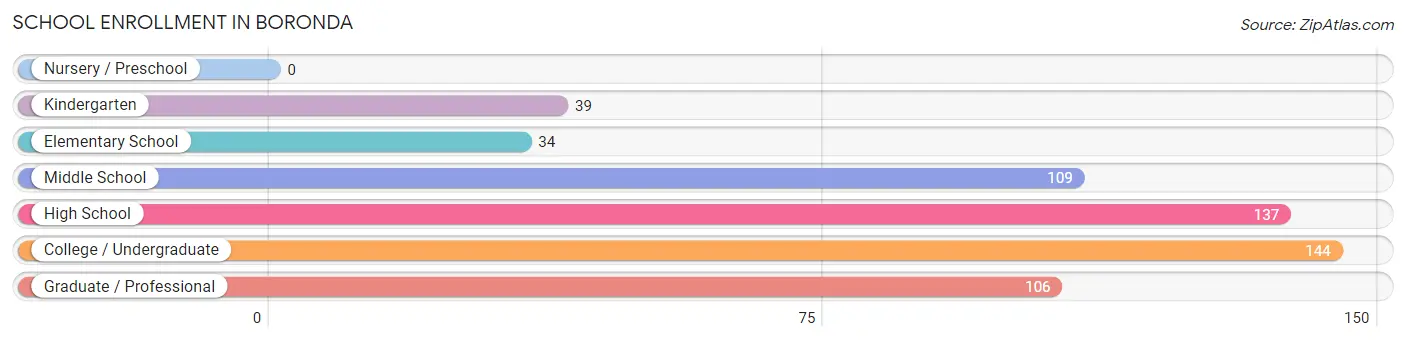
| School Level | # Students | % Students |
| Nursery / Preschool | 0 | 0.0% |
| Kindergarten | 39 | 6.9% |
| Elementary School | 34 | 6.0% |
| Middle School | 109 | 19.2% |
| High School | 137 | 24.1% |
| College / Undergraduate | 144 | 25.3% |
| Graduate / Professional | 106 | 18.6% |
| Total | 569 | 100.0% |
School Enrollment by Age by Funding Source in Boronda
Out of a total of 569 students who are enrolled in schools in Boronda, 7 (1.2%) attend a private institution, while the remaining 562 (98.8%) are enrolled in public schools. The age group of 25 to 34 year olds has the highest likelihood of being enrolled in private schools, with 7 (12.7% in the age bracket) enrolled. Conversely, the age group of 5 to 9 year old has the lowest likelihood of being enrolled in a private school, with 73 (100.0% in the age bracket) attending a public institution.
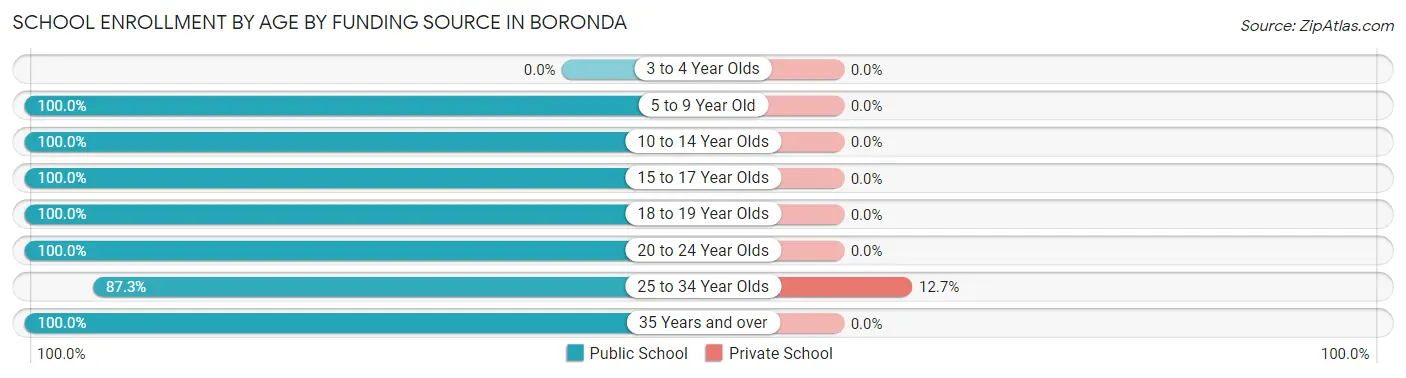
| Age Bracket | Public School | Private School |
| 3 to 4 Year Olds | 0 (0.0%) | 0 (0.0%) |
| 5 to 9 Year Old | 73 (100.0%) | 0 (0.0%) |
| 10 to 14 Year Olds | 137 (100.0%) | 0 (0.0%) |
| 15 to 17 Year Olds | 97 (100.0%) | 0 (0.0%) |
| 18 to 19 Year Olds | 31 (100.0%) | 0 (0.0%) |
| 20 to 24 Year Olds | 58 (100.0%) | 0 (0.0%) |
| 25 to 34 Year Olds | 48 (87.3%) | 7 (12.7%) |
| 35 Years and over | 118 (100.0%) | 0 (0.0%) |
| Total | 562 (98.8%) | 7 (1.2%) |
Educational Attainment by Field of Study in Boronda
Liberal arts & history (84 | 34.0%), psychology (47 | 19.0%), business (26 | 10.5%), communications (24 | 9.7%), and science & technology (21 | 8.5%) are the most common fields of study among 247 individuals in Boronda who have obtained a bachelor's degree or higher.
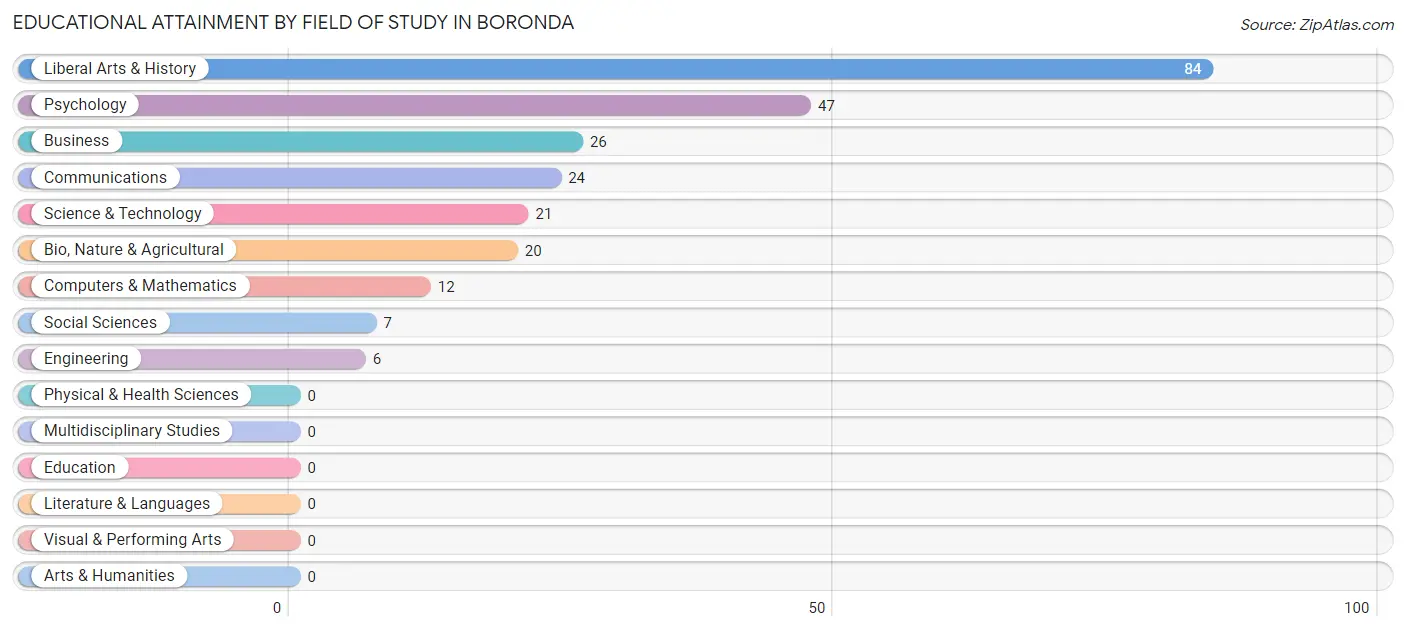
| Field of Study | # Graduates | % Graduates |
| Computers & Mathematics | 12 | 4.9% |
| Bio, Nature & Agricultural | 20 | 8.1% |
| Physical & Health Sciences | 0 | 0.0% |
| Psychology | 47 | 19.0% |
| Social Sciences | 7 | 2.8% |
| Engineering | 6 | 2.4% |
| Multidisciplinary Studies | 0 | 0.0% |
| Science & Technology | 21 | 8.5% |
| Business | 26 | 10.5% |
| Education | 0 | 0.0% |
| Literature & Languages | 0 | 0.0% |
| Liberal Arts & History | 84 | 34.0% |
| Visual & Performing Arts | 0 | 0.0% |
| Communications | 24 | 9.7% |
| Arts & Humanities | 0 | 0.0% |
| Total | 247 | 100.0% |
Transportation & Commute in Boronda
Vehicle Availability by Sex in Boronda
The most prevalent vehicle ownership categories in Boronda are males with 3 vehicles (160, accounting for 36.9%) and females with 3 vehicles (141, making up 39.0%).
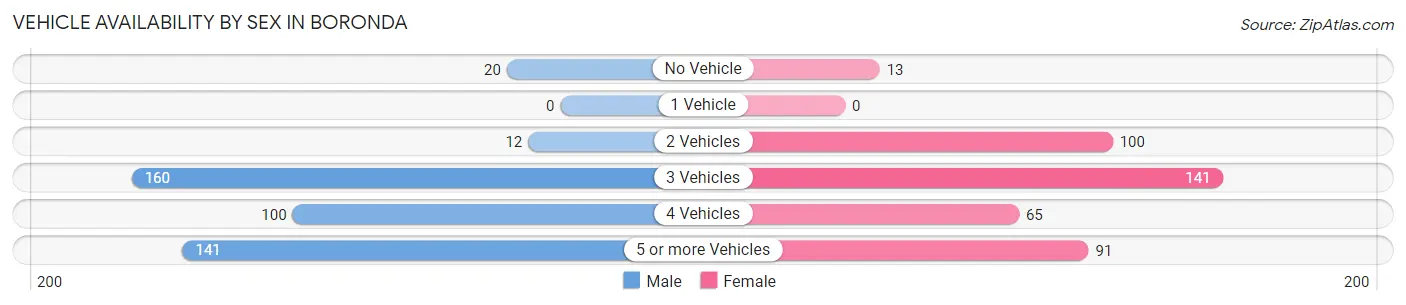
| Vehicles Available | Male | Female |
| No Vehicle | 20 (4.6%) | 13 (3.2%) |
| 1 Vehicle | 0 (0.0%) | 0 (0.0%) |
| 2 Vehicles | 12 (2.8%) | 100 (24.4%) |
| 3 Vehicles | 160 (36.9%) | 141 (34.4%) |
| 4 Vehicles | 100 (23.1%) | 65 (15.9%) |
| 5 or more Vehicles | 141 (32.6%) | 91 (22.2%) |
| Total | 433 (100.0%) | 410 (100.0%) |
Commute Time in Boronda
The most frequently occuring commute durations in Boronda are 20 to 24 minutes (194 commuters, 23.8%), 35 to 39 minutes (166 commuters, 20.3%), and 15 to 19 minutes (96 commuters, 11.8%).
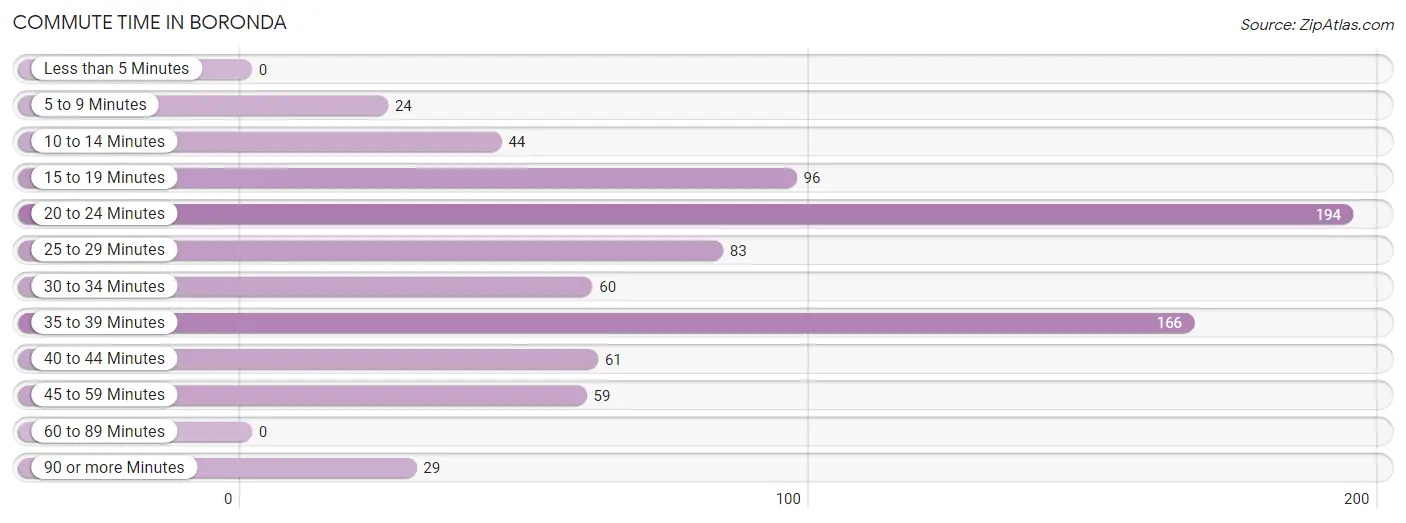
| Commute Time | # Commuters | % Commuters |
| Less than 5 Minutes | 0 | 0.0% |
| 5 to 9 Minutes | 24 | 2.9% |
| 10 to 14 Minutes | 44 | 5.4% |
| 15 to 19 Minutes | 96 | 11.8% |
| 20 to 24 Minutes | 194 | 23.8% |
| 25 to 29 Minutes | 83 | 10.2% |
| 30 to 34 Minutes | 60 | 7.3% |
| 35 to 39 Minutes | 166 | 20.3% |
| 40 to 44 Minutes | 61 | 7.5% |
| 45 to 59 Minutes | 59 | 7.2% |
| 60 to 89 Minutes | 0 | 0.0% |
| 90 or more Minutes | 29 | 3.5% |
Commute Time by Sex in Boronda
The most common commute times in Boronda are 20 to 24 minutes (90 commuters, 20.8%) for males and 20 to 24 minutes (104 commuters, 27.2%) for females.
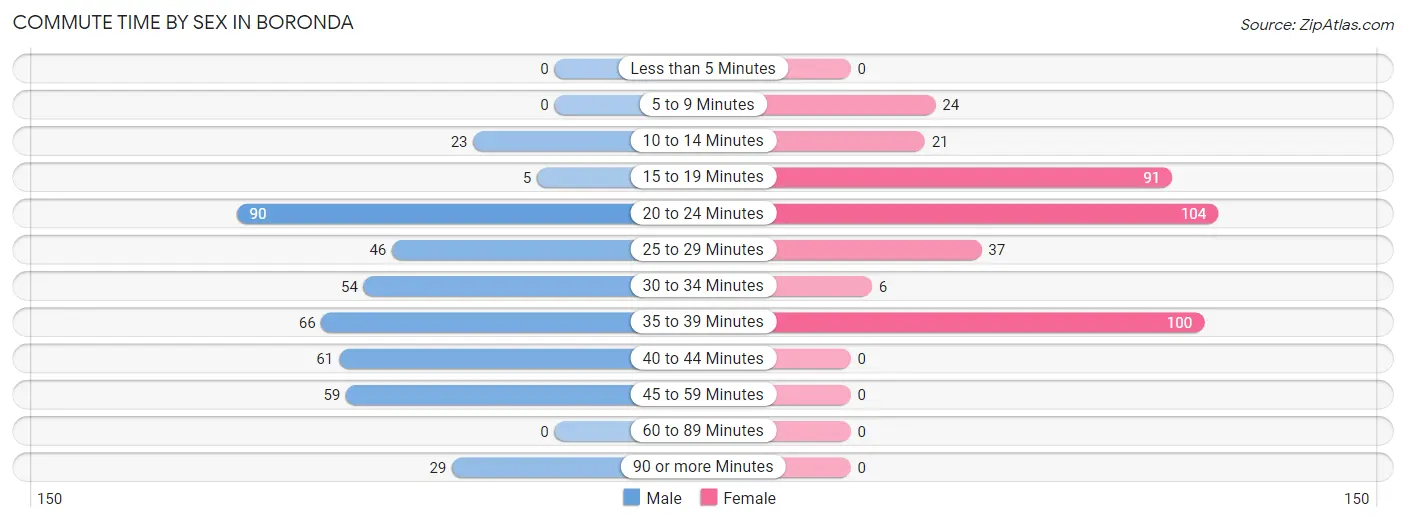
| Commute Time | Male | Female |
| Less than 5 Minutes | 0 (0.0%) | 0 (0.0%) |
| 5 to 9 Minutes | 0 (0.0%) | 24 (6.3%) |
| 10 to 14 Minutes | 23 (5.3%) | 21 (5.5%) |
| 15 to 19 Minutes | 5 (1.1%) | 91 (23.8%) |
| 20 to 24 Minutes | 90 (20.8%) | 104 (27.2%) |
| 25 to 29 Minutes | 46 (10.6%) | 37 (9.7%) |
| 30 to 34 Minutes | 54 (12.5%) | 6 (1.6%) |
| 35 to 39 Minutes | 66 (15.2%) | 100 (26.1%) |
| 40 to 44 Minutes | 61 (14.1%) | 0 (0.0%) |
| 45 to 59 Minutes | 59 (13.6%) | 0 (0.0%) |
| 60 to 89 Minutes | 0 (0.0%) | 0 (0.0%) |
| 90 or more Minutes | 29 (6.7%) | 0 (0.0%) |
Time of Departure to Work by Sex in Boronda
The most frequent times of departure to work in Boronda are 7:00 AM to 7:29 AM (91, 21.0%) for males and 6:30 AM to 6:59 AM (129, 33.7%) for females.
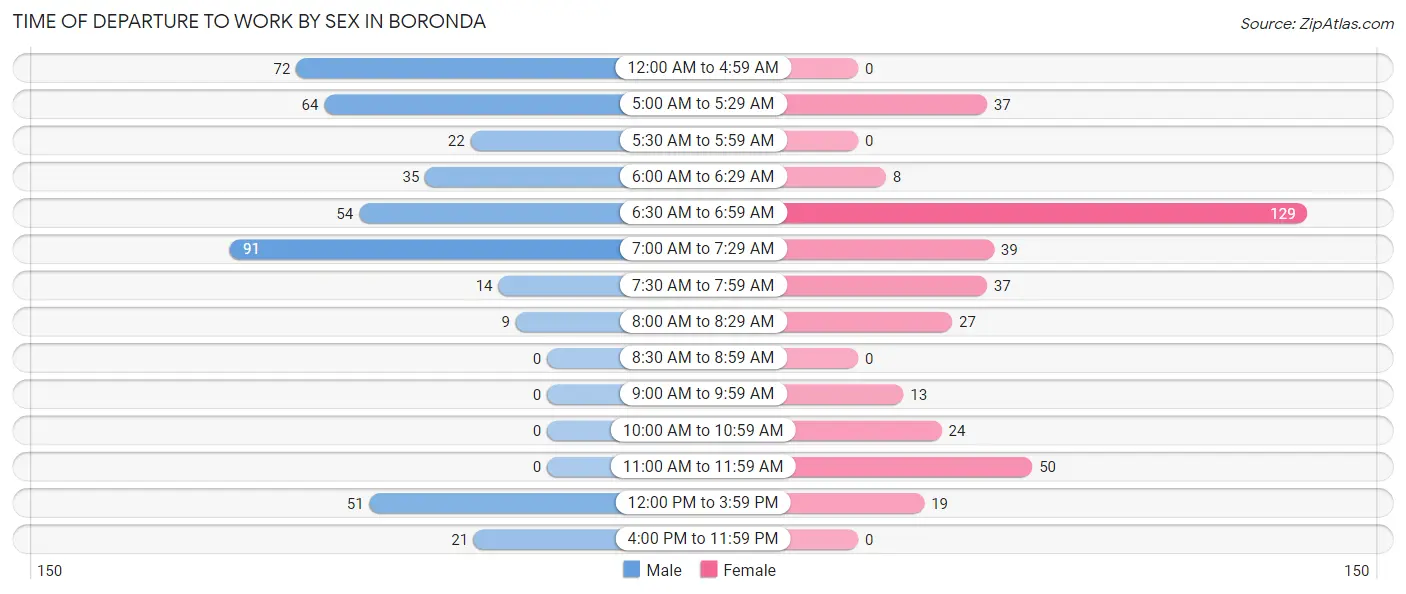
| Time of Departure | Male | Female |
| 12:00 AM to 4:59 AM | 72 (16.6%) | 0 (0.0%) |
| 5:00 AM to 5:29 AM | 64 (14.8%) | 37 (9.7%) |
| 5:30 AM to 5:59 AM | 22 (5.1%) | 0 (0.0%) |
| 6:00 AM to 6:29 AM | 35 (8.1%) | 8 (2.1%) |
| 6:30 AM to 6:59 AM | 54 (12.5%) | 129 (33.7%) |
| 7:00 AM to 7:29 AM | 91 (21.0%) | 39 (10.2%) |
| 7:30 AM to 7:59 AM | 14 (3.2%) | 37 (9.7%) |
| 8:00 AM to 8:29 AM | 9 (2.1%) | 27 (7.0%) |
| 8:30 AM to 8:59 AM | 0 (0.0%) | 0 (0.0%) |
| 9:00 AM to 9:59 AM | 0 (0.0%) | 13 (3.4%) |
| 10:00 AM to 10:59 AM | 0 (0.0%) | 24 (6.3%) |
| 11:00 AM to 11:59 AM | 0 (0.0%) | 50 (13.1%) |
| 12:00 PM to 3:59 PM | 51 (11.8%) | 19 (5.0%) |
| 4:00 PM to 11:59 PM | 21 (4.9%) | 0 (0.0%) |
| Total | 433 (100.0%) | 383 (100.0%) |
Housing Occupancy in Boronda
Occupancy by Ownership in Boronda
Of the total 443 dwellings in Boronda, owner-occupied units account for 224 (50.6%), while renter-occupied units make up 219 (49.4%).
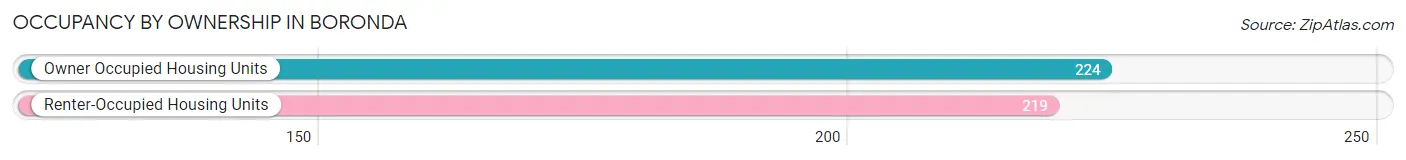
| Occupancy | # Housing Units | % Housing Units |
| Owner Occupied Housing Units | 224 | 50.6% |
| Renter-Occupied Housing Units | 219 | 49.4% |
| Total Occupied Housing Units | 443 | 100.0% |
Occupancy by Household Size in Boronda
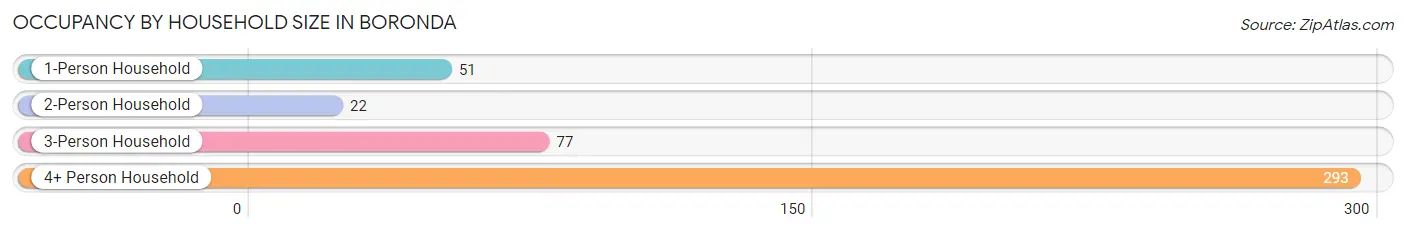
| Household Size | # Housing Units | % Housing Units |
| 1-Person Household | 51 | 11.5% |
| 2-Person Household | 22 | 5.0% |
| 3-Person Household | 77 | 17.4% |
| 4+ Person Household | 293 | 66.1% |
| Total Housing Units | 443 | 100.0% |
Occupancy by Ownership by Household Size in Boronda
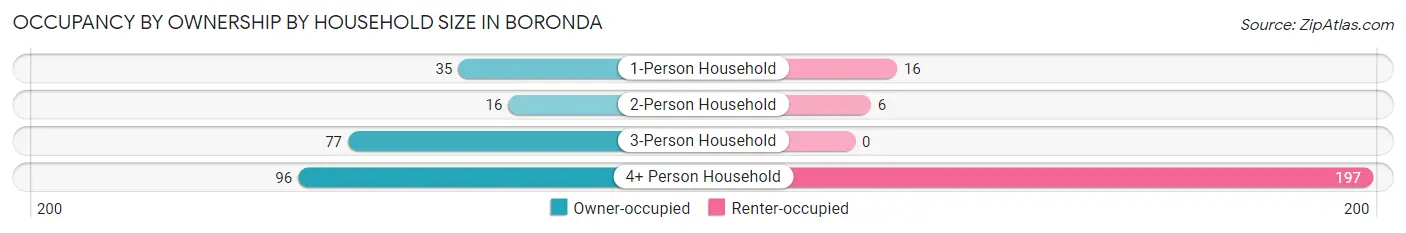
| Household Size | Owner-occupied | Renter-occupied |
| 1-Person Household | 35 (68.6%) | 16 (31.4%) |
| 2-Person Household | 16 (72.7%) | 6 (27.3%) |
| 3-Person Household | 77 (100.0%) | 0 (0.0%) |
| 4+ Person Household | 96 (32.8%) | 197 (67.2%) |
| Total Housing Units | 224 (50.6%) | 219 (49.4%) |
Occupancy by Educational Attainment in Boronda
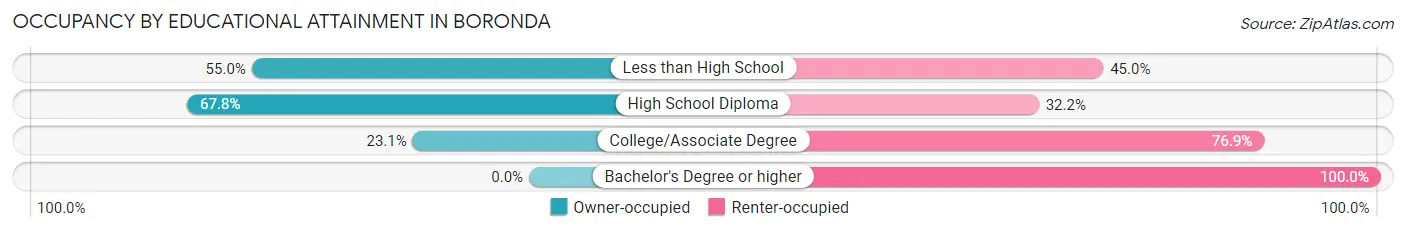
| Household Size | Owner-occupied | Renter-occupied |
| Less than High School | 127 (55.0%) | 104 (45.0%) |
| High School Diploma | 82 (67.8%) | 39 (32.2%) |
| College/Associate Degree | 15 (23.1%) | 50 (76.9%) |
| Bachelor's Degree or higher | 0 (0.0%) | 26 (100.0%) |
Occupancy by Age of Householder in Boronda
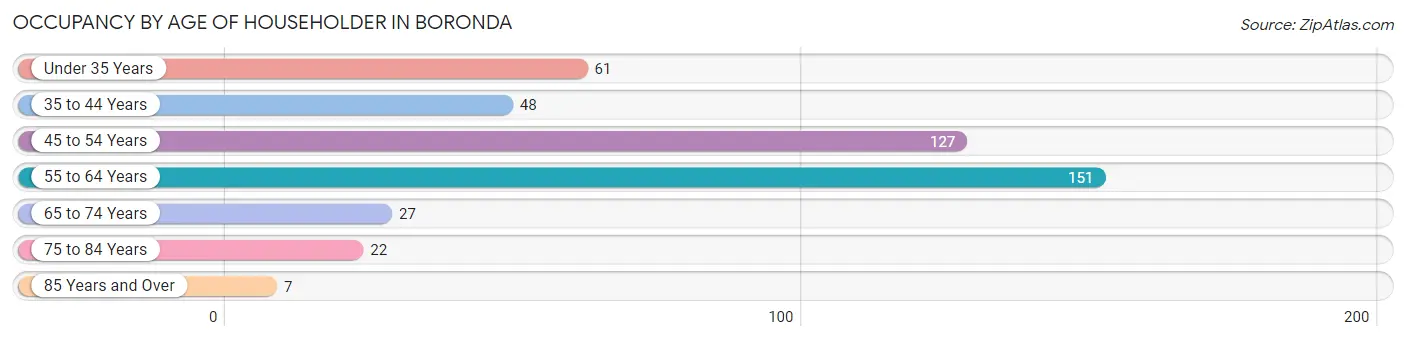
| Age Bracket | # Households | % Households |
| Under 35 Years | 61 | 13.8% |
| 35 to 44 Years | 48 | 10.8% |
| 45 to 54 Years | 127 | 28.7% |
| 55 to 64 Years | 151 | 34.1% |
| 65 to 74 Years | 27 | 6.1% |
| 75 to 84 Years | 22 | 5.0% |
| 85 Years and Over | 7 | 1.6% |
| Total | 443 | 100.0% |
Housing Finances in Boronda
Median Income by Occupancy in Boronda
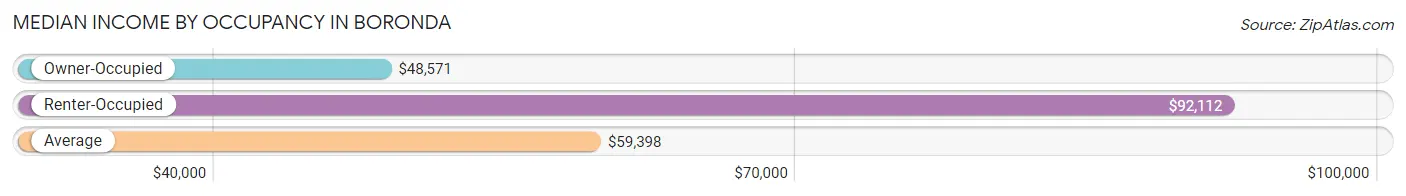
| Occupancy Type | # Households | Median Income |
| Owner-Occupied | 224 (50.6%) | $48,571 |
| Renter-Occupied | 219 (49.4%) | $92,112 |
| Average | 443 (100.0%) | $59,398 |
Occupancy by Householder Income Bracket in Boronda
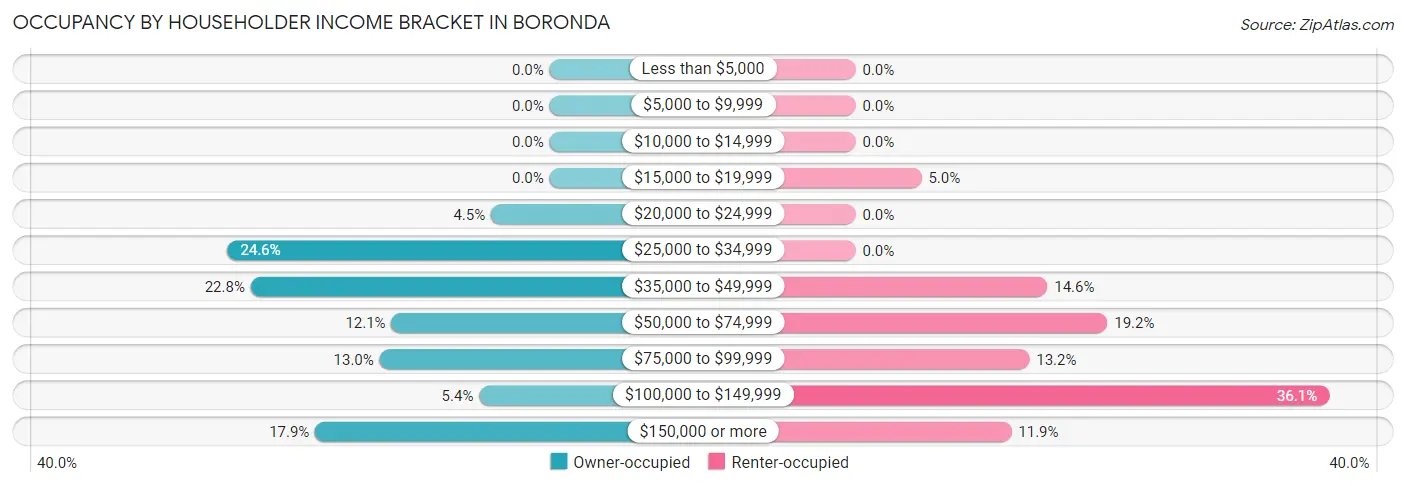
| Income Bracket | Owner-occupied | Renter-occupied |
| Less than $5,000 | 0 (0.0%) | 0 (0.0%) |
| $5,000 to $9,999 | 0 (0.0%) | 0 (0.0%) |
| $10,000 to $14,999 | 0 (0.0%) | 0 (0.0%) |
| $15,000 to $19,999 | 0 (0.0%) | 11 (5.0%) |
| $20,000 to $24,999 | 10 (4.5%) | 0 (0.0%) |
| $25,000 to $34,999 | 55 (24.5%) | 0 (0.0%) |
| $35,000 to $49,999 | 51 (22.8%) | 32 (14.6%) |
| $50,000 to $74,999 | 27 (12.0%) | 42 (19.2%) |
| $75,000 to $99,999 | 29 (13.0%) | 29 (13.2%) |
| $100,000 to $149,999 | 12 (5.4%) | 79 (36.1%) |
| $150,000 or more | 40 (17.9%) | 26 (11.9%) |
| Total | 224 (100.0%) | 219 (100.0%) |
Monthly Housing Cost Tiers in Boronda
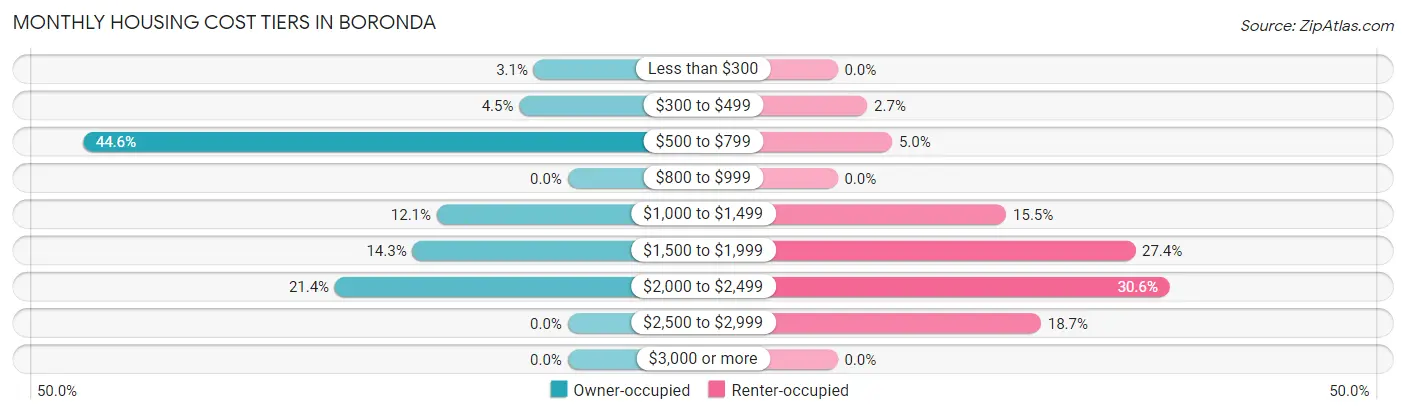
| Monthly Cost | Owner-occupied | Renter-occupied |
| Less than $300 | 7 (3.1%) | 0 (0.0%) |
| $300 to $499 | 10 (4.5%) | 6 (2.7%) |
| $500 to $799 | 100 (44.6%) | 11 (5.0%) |
| $800 to $999 | 0 (0.0%) | 0 (0.0%) |
| $1,000 to $1,499 | 27 (12.0%) | 34 (15.5%) |
| $1,500 to $1,999 | 32 (14.3%) | 60 (27.4%) |
| $2,000 to $2,499 | 48 (21.4%) | 67 (30.6%) |
| $2,500 to $2,999 | 0 (0.0%) | 41 (18.7%) |
| $3,000 or more | 0 (0.0%) | 0 (0.0%) |
| Total | 224 (100.0%) | 219 (100.0%) |
Physical Housing Characteristics in Boronda
Housing Structures in Boronda
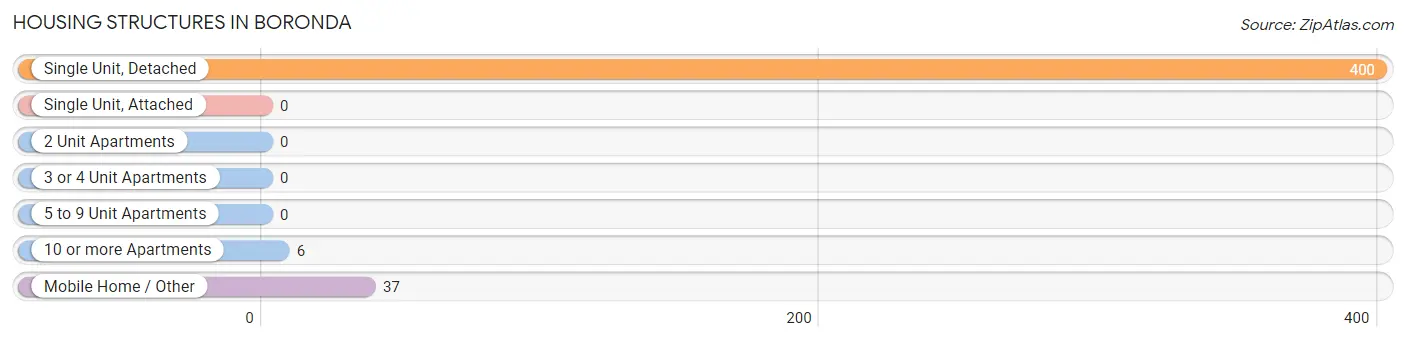
| Structure Type | # Housing Units | % Housing Units |
| Single Unit, Detached | 400 | 90.3% |
| Single Unit, Attached | 0 | 0.0% |
| 2 Unit Apartments | 0 | 0.0% |
| 3 or 4 Unit Apartments | 0 | 0.0% |
| 5 to 9 Unit Apartments | 0 | 0.0% |
| 10 or more Apartments | 6 | 1.3% |
| Mobile Home / Other | 37 | 8.4% |
| Total | 443 | 100.0% |
Housing Structures by Occupancy in Boronda
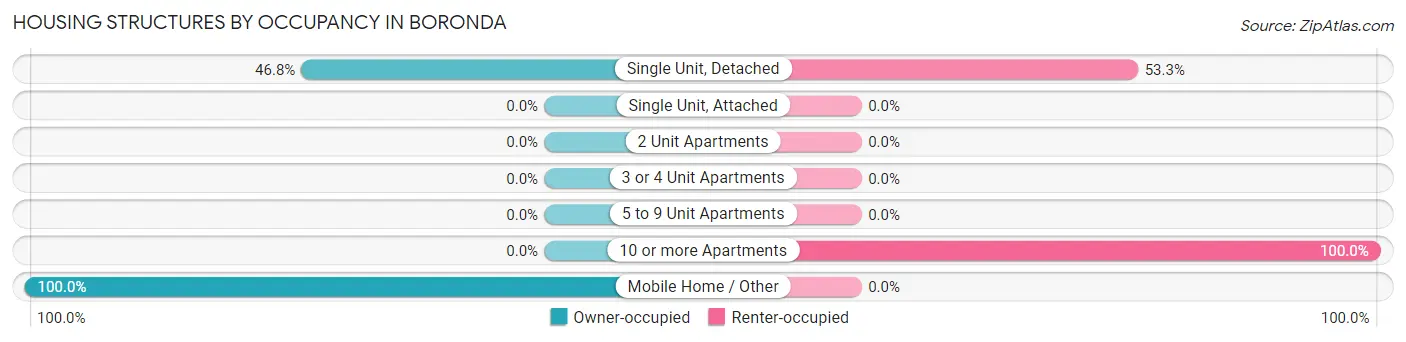
| Structure Type | Owner-occupied | Renter-occupied |
| Single Unit, Detached | 187 (46.8%) | 213 (53.2%) |
| Single Unit, Attached | 0 (0.0%) | 0 (0.0%) |
| 2 Unit Apartments | 0 (0.0%) | 0 (0.0%) |
| 3 or 4 Unit Apartments | 0 (0.0%) | 0 (0.0%) |
| 5 to 9 Unit Apartments | 0 (0.0%) | 0 (0.0%) |
| 10 or more Apartments | 0 (0.0%) | 6 (100.0%) |
| Mobile Home / Other | 37 (100.0%) | 0 (0.0%) |
| Total | 224 (50.6%) | 219 (49.4%) |
Housing Structures by Number of Rooms in Boronda
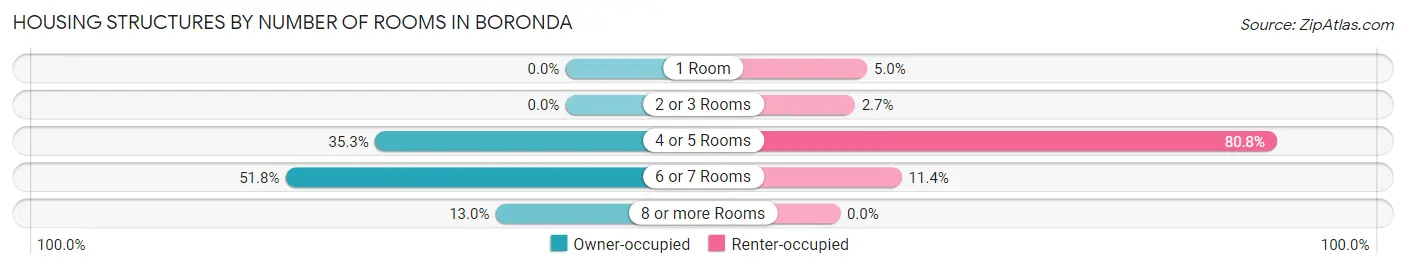
| Number of Rooms | Owner-occupied | Renter-occupied |
| 1 Room | 0 (0.0%) | 11 (5.0%) |
| 2 or 3 Rooms | 0 (0.0%) | 6 (2.7%) |
| 4 or 5 Rooms | 79 (35.3%) | 177 (80.8%) |
| 6 or 7 Rooms | 116 (51.8%) | 25 (11.4%) |
| 8 or more Rooms | 29 (13.0%) | 0 (0.0%) |
| Total | 224 (100.0%) | 219 (100.0%) |
Housing Structure by Heating Type in Boronda
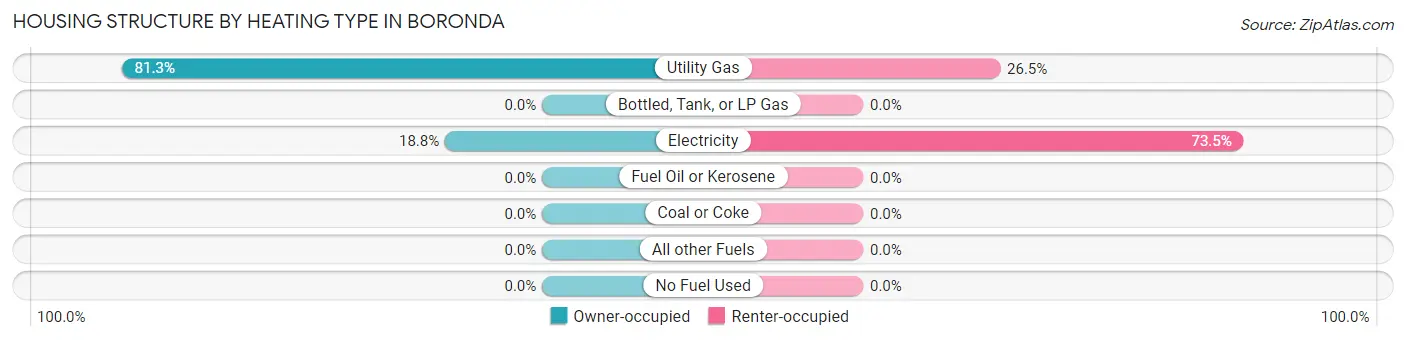
| Heating Type | Owner-occupied | Renter-occupied |
| Utility Gas | 182 (81.2%) | 58 (26.5%) |
| Bottled, Tank, or LP Gas | 0 (0.0%) | 0 (0.0%) |
| Electricity | 42 (18.8%) | 161 (73.5%) |
| Fuel Oil or Kerosene | 0 (0.0%) | 0 (0.0%) |
| Coal or Coke | 0 (0.0%) | 0 (0.0%) |
| All other Fuels | 0 (0.0%) | 0 (0.0%) |
| No Fuel Used | 0 (0.0%) | 0 (0.0%) |
| Total | 224 (100.0%) | 219 (100.0%) |
Household Vehicle Usage in Boronda
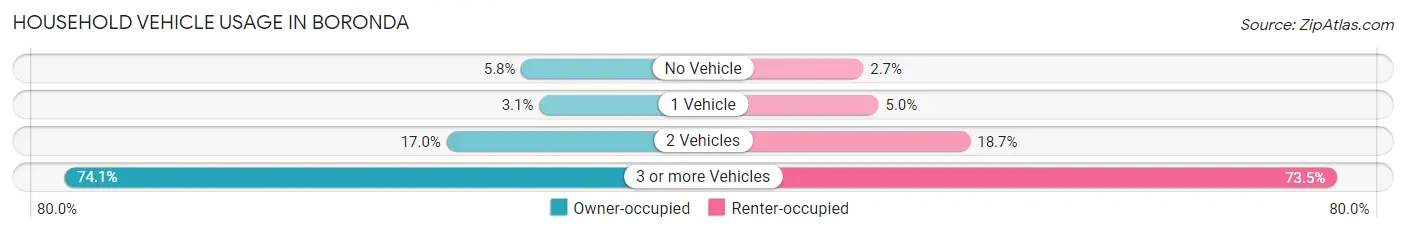
| Vehicles per Household | Owner-occupied | Renter-occupied |
| No Vehicle | 13 (5.8%) | 6 (2.7%) |
| 1 Vehicle | 7 (3.1%) | 11 (5.0%) |
| 2 Vehicles | 38 (17.0%) | 41 (18.7%) |
| 3 or more Vehicles | 166 (74.1%) | 161 (73.5%) |
| Total | 224 (100.0%) | 219 (100.0%) |
Real Estate & Mortgages in Boronda
Real Estate and Mortgage Overview in Boronda
| Characteristic | Without Mortgage | With Mortgage |
| Housing Units | 117 | 107 |
| Median Property Value | $423,300 | $594,500 |
| Median Household Income | - | - |
| Monthly Housing Costs | $592 | $0 |
| Real Estate Taxes | $2,082 | $0 |
Property Value by Mortgage Status in Boronda
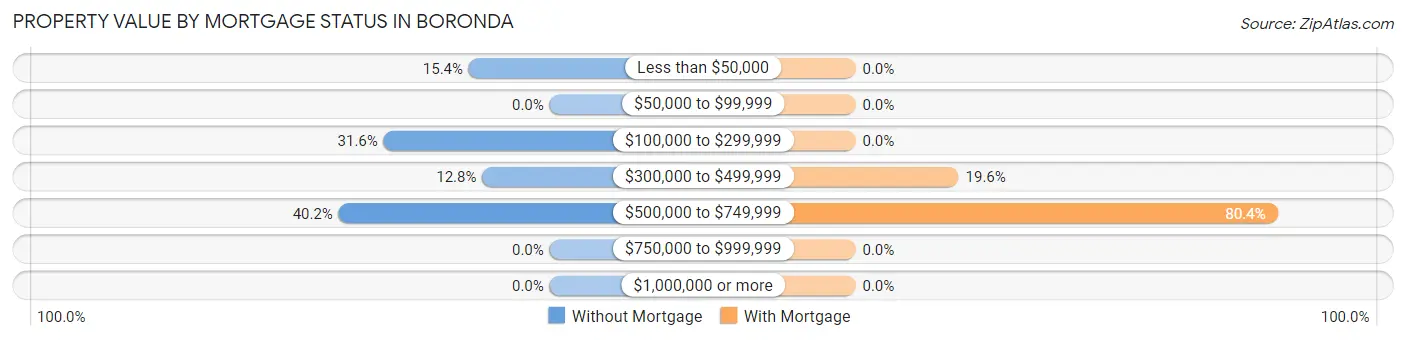
| Property Value | Without Mortgage | With Mortgage |
| Less than $50,000 | 18 (15.4%) | 0 (0.0%) |
| $50,000 to $99,999 | 0 (0.0%) | 0 (0.0%) |
| $100,000 to $299,999 | 37 (31.6%) | 0 (0.0%) |
| $300,000 to $499,999 | 15 (12.8%) | 21 (19.6%) |
| $500,000 to $749,999 | 47 (40.2%) | 86 (80.4%) |
| $750,000 to $999,999 | 0 (0.0%) | 0 (0.0%) |
| $1,000,000 or more | 0 (0.0%) | 0 (0.0%) |
| Total | 117 (100.0%) | 107 (100.0%) |
Household Income by Mortgage Status in Boronda
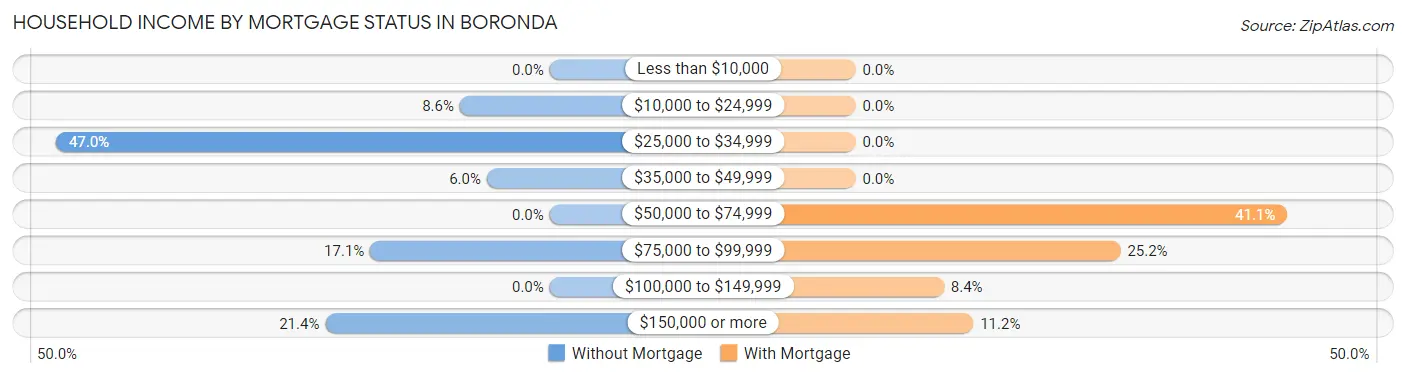
| Household Income | Without Mortgage | With Mortgage |
| Less than $10,000 | 0 (0.0%) | 0 (0.0%) |
| $10,000 to $24,999 | 10 (8.6%) | 0 (0.0%) |
| $25,000 to $34,999 | 55 (47.0%) | 0 (0.0%) |
| $35,000 to $49,999 | 7 (6.0%) | 0 (0.0%) |
| $50,000 to $74,999 | 0 (0.0%) | 44 (41.1%) |
| $75,000 to $99,999 | 20 (17.1%) | 27 (25.2%) |
| $100,000 to $149,999 | 0 (0.0%) | 9 (8.4%) |
| $150,000 or more | 25 (21.4%) | 12 (11.2%) |
| Total | 117 (100.0%) | 107 (100.0%) |
Property Value to Household Income Ratio in Boronda
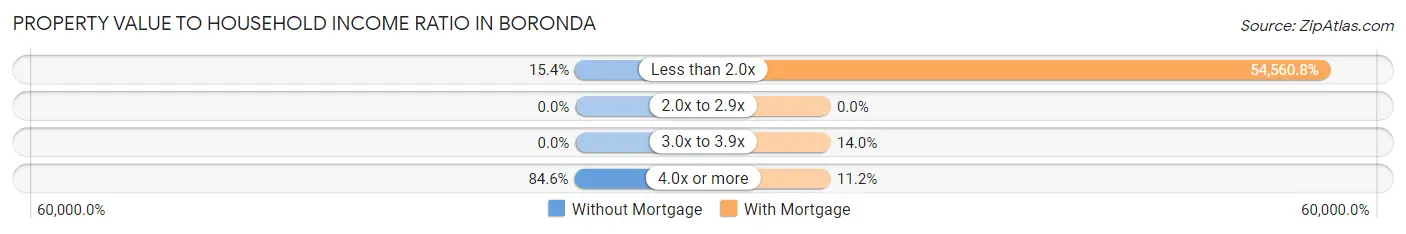
| Value-to-Income Ratio | Without Mortgage | With Mortgage |
| Less than 2.0x | 18 (15.4%) | 58,380 (54,560.7%) |
| 2.0x to 2.9x | 0 (0.0%) | 0 (0.0%) |
| 3.0x to 3.9x | 0 (0.0%) | 15 (14.0%) |
| 4.0x or more | 99 (84.6%) | 12 (11.2%) |
| Total | 117 (100.0%) | 107 (100.0%) |
Real Estate Taxes by Mortgage Status in Boronda
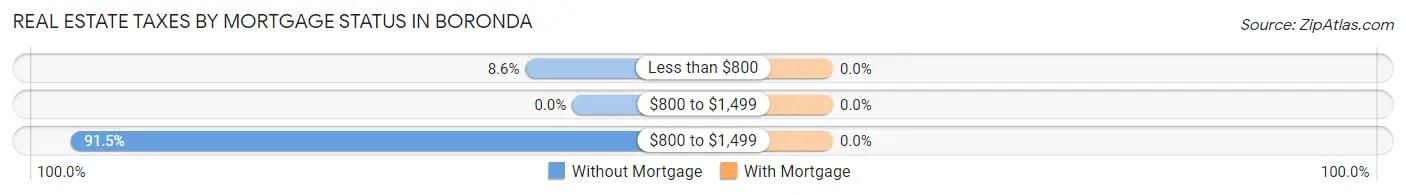
| Property Taxes | Without Mortgage | With Mortgage |
| Less than $800 | 10 (8.6%) | 0 (0.0%) |
| $800 to $1,499 | 0 (0.0%) | 0 (0.0%) |
| $800 to $1,499 | 107 (91.4%) | 0 (0.0%) |
| Total | 117 (100.0%) | 107 (100.0%) |
Health & Disability in Boronda
Health Insurance Coverage by Age in Boronda
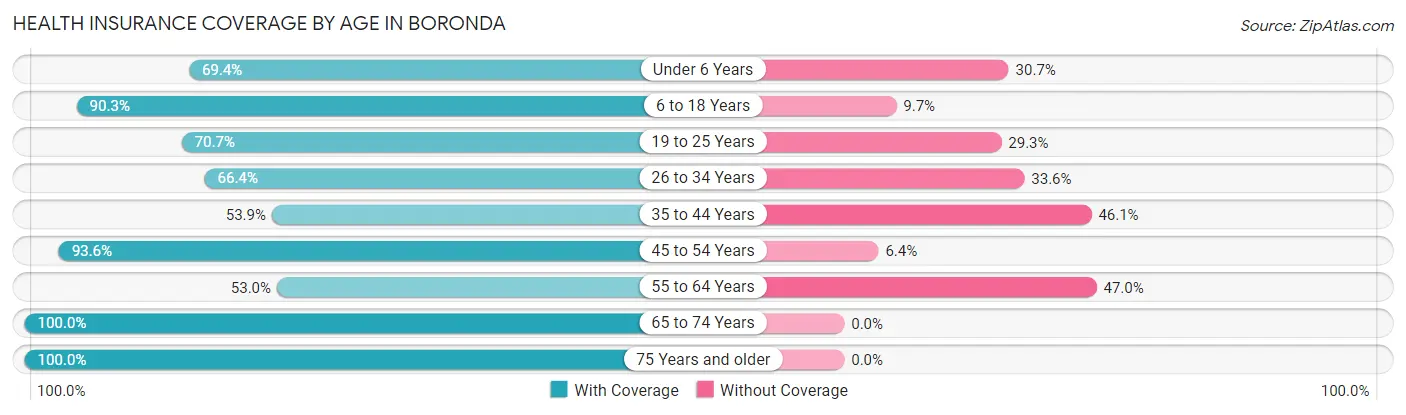
| Age Bracket | With Coverage | Without Coverage |
| Under 6 Years | 86 (69.4%) | 38 (30.6%) |
| 6 to 18 Years | 316 (90.3%) | 34 (9.7%) |
| 19 to 25 Years | 70 (70.7%) | 29 (29.3%) |
| 26 to 34 Years | 180 (66.4%) | 91 (33.6%) |
| 35 to 44 Years | 138 (53.9%) | 118 (46.1%) |
| 45 to 54 Years | 338 (93.6%) | 23 (6.4%) |
| 55 to 64 Years | 134 (53.0%) | 119 (47.0%) |
| 65 to 74 Years | 142 (100.0%) | 0 (0.0%) |
| 75 Years and older | 29 (100.0%) | 0 (0.0%) |
| Total | 1,433 (76.0%) | 452 (24.0%) |
Health Insurance Coverage by Citizenship Status in Boronda
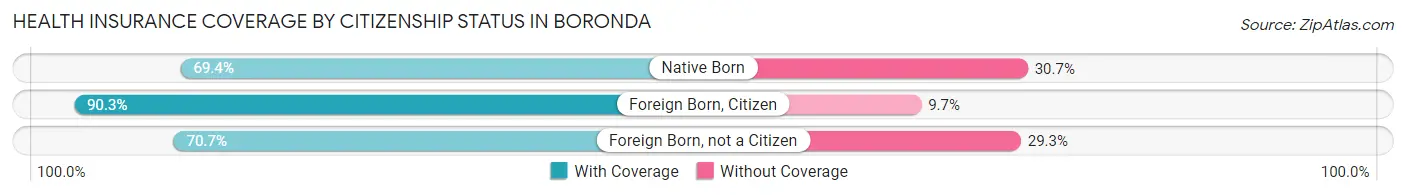
| Citizenship Status | With Coverage | Without Coverage |
| Native Born | 86 (69.4%) | 38 (30.6%) |
| Foreign Born, Citizen | 316 (90.3%) | 34 (9.7%) |
| Foreign Born, not a Citizen | 70 (70.7%) | 29 (29.3%) |
Health Insurance Coverage by Household Income in Boronda
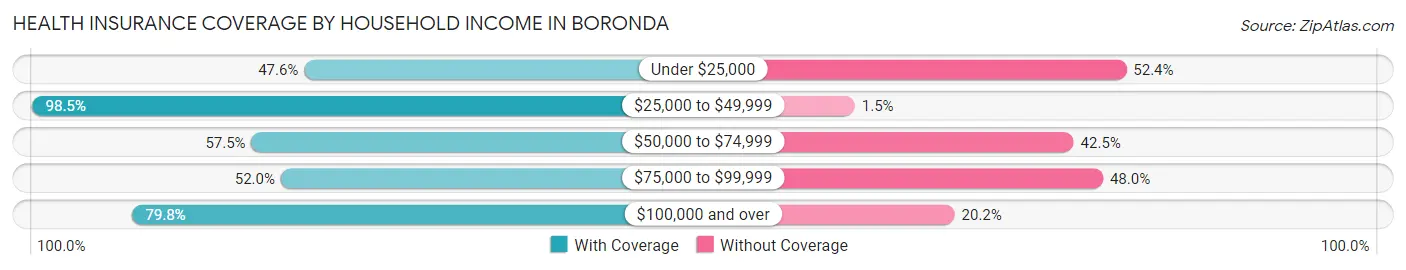
| Household Income | With Coverage | Without Coverage |
| Under $25,000 | 10 (47.6%) | 11 (52.4%) |
| $25,000 to $49,999 | 392 (98.5%) | 6 (1.5%) |
| $50,000 to $74,999 | 161 (57.5%) | 119 (42.5%) |
| $75,000 to $99,999 | 143 (52.0%) | 132 (48.0%) |
| $100,000 and over | 727 (79.8%) | 184 (20.2%) |
Public vs Private Health Insurance Coverage by Age in Boronda
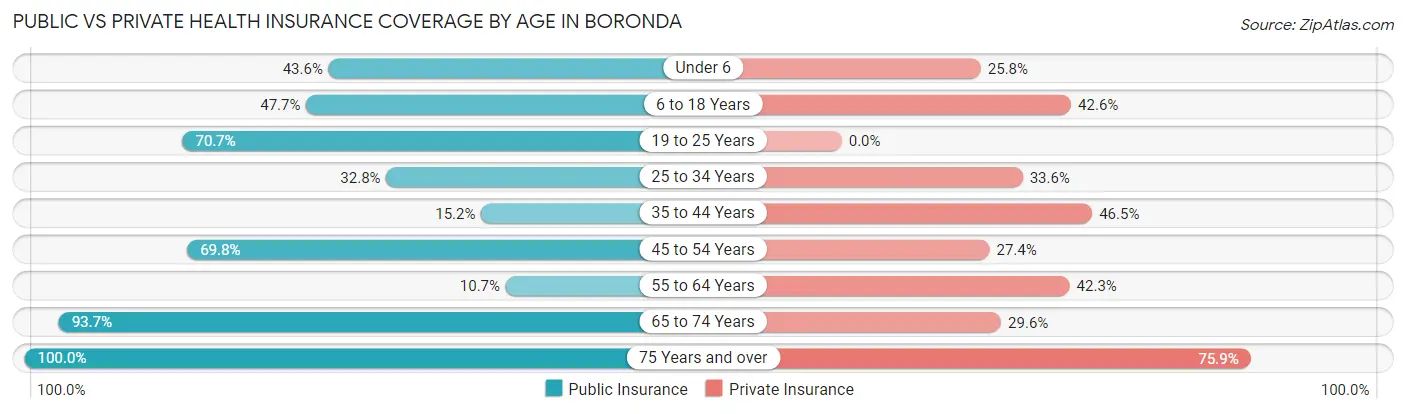
| Age Bracket | Public Insurance | Private Insurance |
| Under 6 | 54 (43.5%) | 32 (25.8%) |
| 6 to 18 Years | 167 (47.7%) | 149 (42.6%) |
| 19 to 25 Years | 70 (70.7%) | 0 (0.0%) |
| 25 to 34 Years | 89 (32.8%) | 91 (33.6%) |
| 35 to 44 Years | 39 (15.2%) | 119 (46.5%) |
| 45 to 54 Years | 252 (69.8%) | 99 (27.4%) |
| 55 to 64 Years | 27 (10.7%) | 107 (42.3%) |
| 65 to 74 Years | 133 (93.7%) | 42 (29.6%) |
| 75 Years and over | 29 (100.0%) | 22 (75.9%) |
| Total | 860 (45.6%) | 661 (35.1%) |
Disability Status by Sex by Age in Boronda
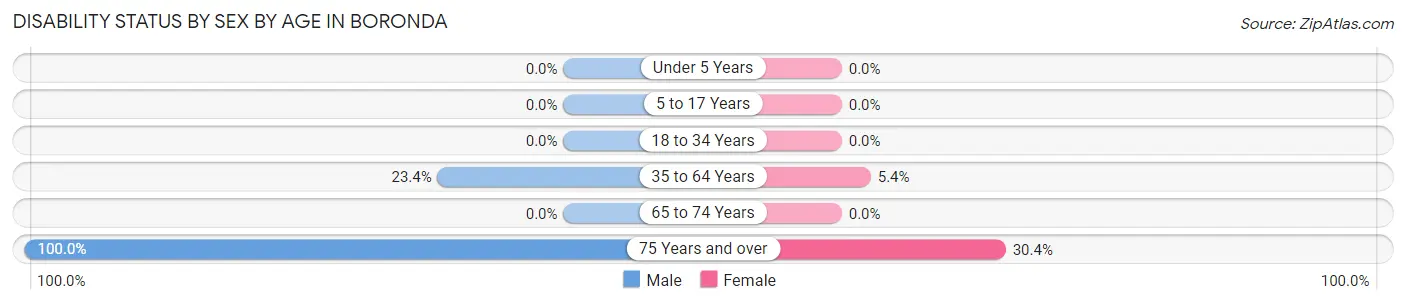
| Age Bracket | Male | Female |
| Under 5 Years | 0 (0.0%) | 0 (0.0%) |
| 5 to 17 Years | 0 (0.0%) | 0 (0.0%) |
| 18 to 34 Years | 0 (0.0%) | 0 (0.0%) |
| 35 to 64 Years | 99 (23.4%) | 24 (5.4%) |
| 65 to 74 Years | 0 (0.0%) | 0 (0.0%) |
| 75 Years and over | 6 (100.0%) | 7 (30.4%) |
Disability Class by Sex by Age in Boronda
Disability Class: Hearing Difficulty
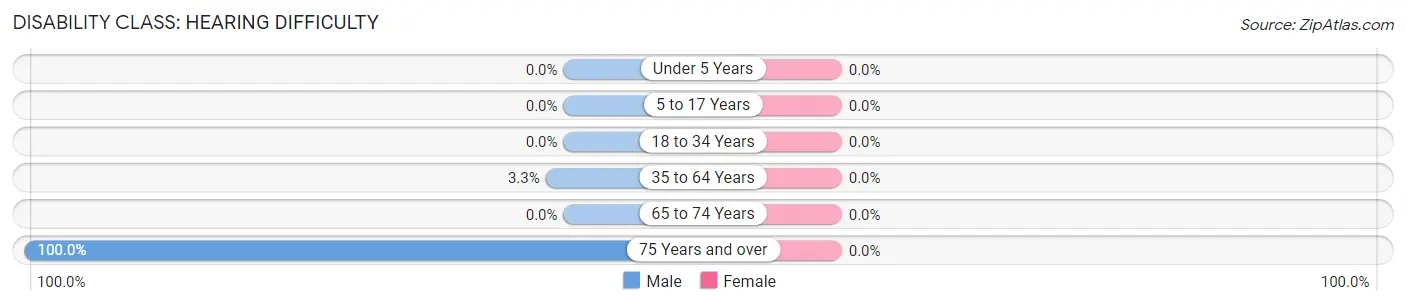
| Age Bracket | Male | Female |
| Under 5 Years | 0 (0.0%) | 0 (0.0%) |
| 5 to 17 Years | 0 (0.0%) | 0 (0.0%) |
| 18 to 34 Years | 0 (0.0%) | 0 (0.0%) |
| 35 to 64 Years | 14 (3.3%) | 0 (0.0%) |
| 65 to 74 Years | 0 (0.0%) | 0 (0.0%) |
| 75 Years and over | 6 (100.0%) | 0 (0.0%) |
Disability Class: Vision Difficulty
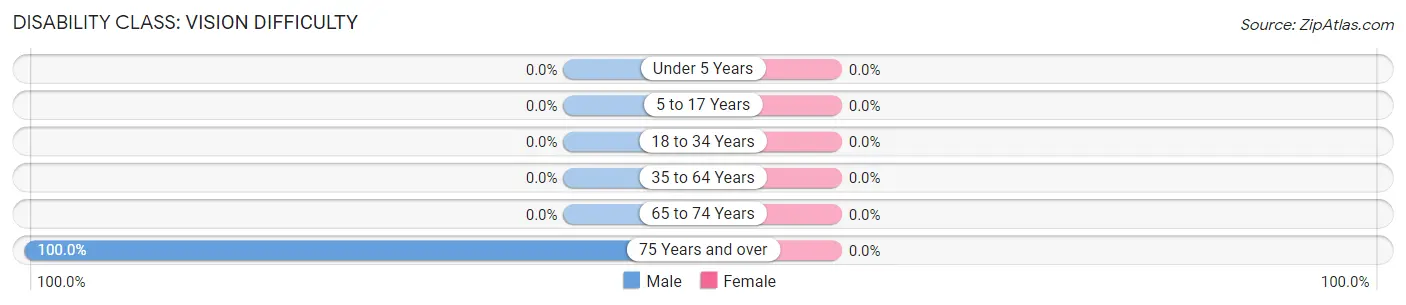
| Age Bracket | Male | Female |
| Under 5 Years | 0 (0.0%) | 0 (0.0%) |
| 5 to 17 Years | 0 (0.0%) | 0 (0.0%) |
| 18 to 34 Years | 0 (0.0%) | 0 (0.0%) |
| 35 to 64 Years | 0 (0.0%) | 0 (0.0%) |
| 65 to 74 Years | 0 (0.0%) | 0 (0.0%) |
| 75 Years and over | 6 (100.0%) | 0 (0.0%) |
Disability Class: Cognitive Difficulty
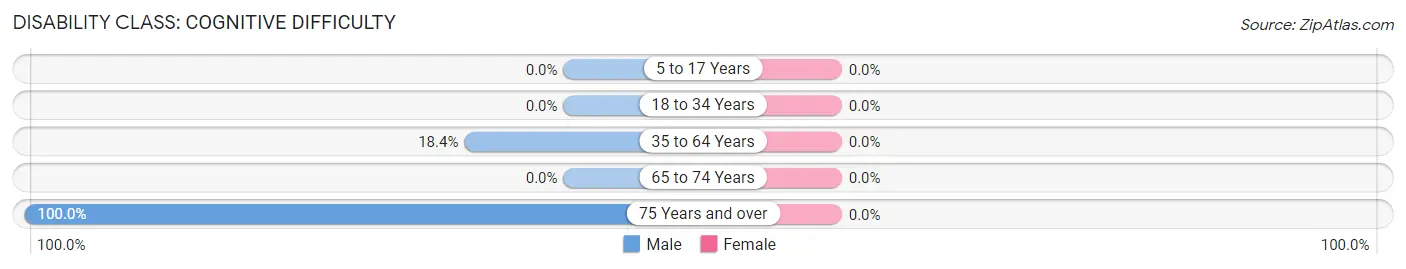
| Age Bracket | Male | Female |
| 5 to 17 Years | 0 (0.0%) | 0 (0.0%) |
| 18 to 34 Years | 0 (0.0%) | 0 (0.0%) |
| 35 to 64 Years | 78 (18.4%) | 0 (0.0%) |
| 65 to 74 Years | 0 (0.0%) | 0 (0.0%) |
| 75 Years and over | 6 (100.0%) | 0 (0.0%) |
Disability Class: Ambulatory Difficulty
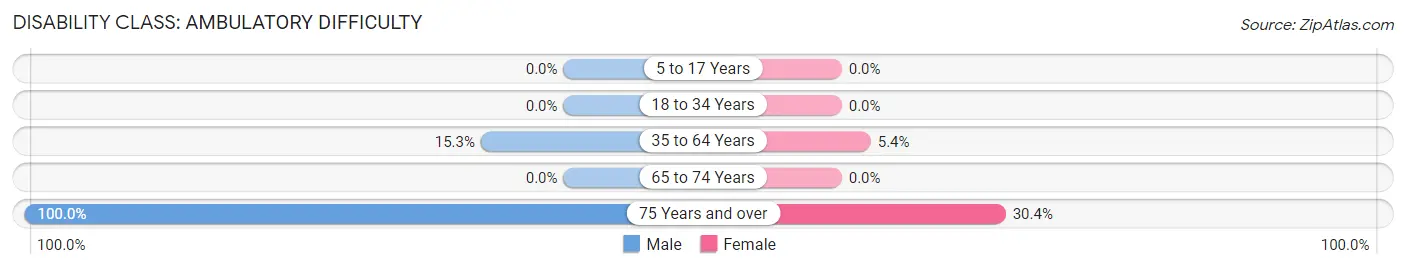
| Age Bracket | Male | Female |
| 5 to 17 Years | 0 (0.0%) | 0 (0.0%) |
| 18 to 34 Years | 0 (0.0%) | 0 (0.0%) |
| 35 to 64 Years | 65 (15.3%) | 24 (5.4%) |
| 65 to 74 Years | 0 (0.0%) | 0 (0.0%) |
| 75 Years and over | 6 (100.0%) | 7 (30.4%) |
Disability Class: Self-Care Difficulty
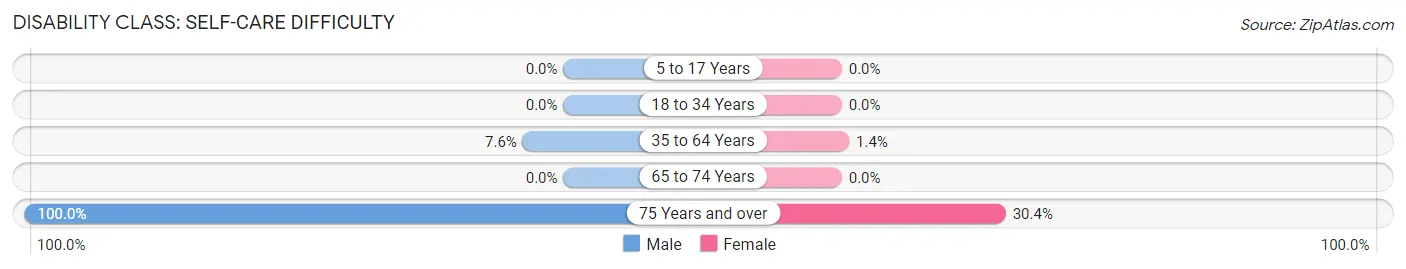
| Age Bracket | Male | Female |
| 5 to 17 Years | 0 (0.0%) | 0 (0.0%) |
| 18 to 34 Years | 0 (0.0%) | 0 (0.0%) |
| 35 to 64 Years | 32 (7.5%) | 6 (1.3%) |
| 65 to 74 Years | 0 (0.0%) | 0 (0.0%) |
| 75 Years and over | 6 (100.0%) | 7 (30.4%) |
Technology Access in Boronda
Computing Device Access in Boronda
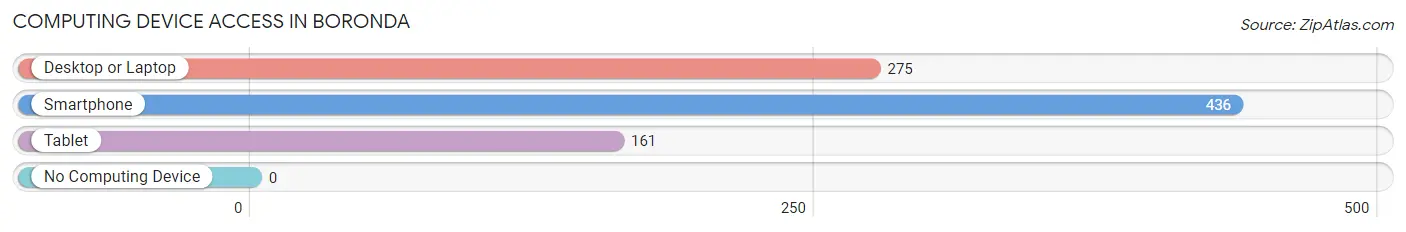
| Device Type | # Households | % Households |
| Desktop or Laptop | 275 | 62.1% |
| Smartphone | 436 | 98.4% |
| Tablet | 161 | 36.3% |
| No Computing Device | 0 | 0.0% |
| Total | 443 | 100.0% |
Internet Access in Boronda
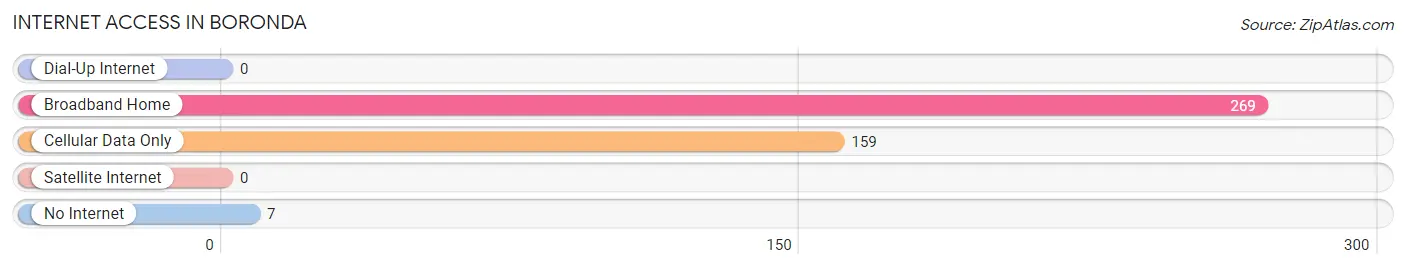
| Internet Type | # Households | % Households |
| Dial-Up Internet | 0 | 0.0% |
| Broadband Home | 269 | 60.7% |
| Cellular Data Only | 159 | 35.9% |
| Satellite Internet | 0 | 0.0% |
| No Internet | 7 | 1.6% |
| Total | 443 | 100.0% |
Boronda Summary
Boronda is a census-designated place located in Monterey County, California. It is situated in the Salinas Valley, approximately 8 miles east of Salinas. The population of Boronda was 2,845 at the 2010 census.
History
The area now known as Boronda was originally inhabited by the Ohlone people. The first European settlers arrived in the area in the late 1700s, and the area was eventually incorporated into the Rancho El Toro Mexican land grant. In 1848, the area became part of the United States following the Mexican-American War.
In the late 1800s, the area was settled by farmers and ranchers, and the first post office was established in 1891. The area was known as Boronda until the 1950s, when it was renamed to its current name.
Geography
Boronda is located at 36°41'25"N 121°37'17"W. It is situated in the Salinas Valley, approximately 8 miles east of Salinas. The area is mostly flat, with an elevation of about 200 feet.
The climate in Boronda is Mediterranean, with mild, wet winters and hot, dry summers. The average annual precipitation is about 15 inches.
Economy
The economy of Boronda is largely based on agriculture. The area is home to a variety of crops, including lettuce, broccoli, cauliflower, and strawberries. The area is also home to several wineries and vineyards.
Demographics
As of the 2010 census, the population of Boronda was 2,845. The racial makeup of the town was 63.3% White, 0.7% African American, 0.7% Native American, 0.7% Asian, 0.2% Pacific Islander, 32.2% from other races, and 2.2% from two or more races. Hispanic or Latino of any race were 57.2% of the population.
The median household income in Boronda was $45,938, and the median family income was $50,938. The per capita income was $19,938. About 17.2% of families and 20.2% of the population were below the poverty line, including 28.2% of those under age 18 and 8.2% of those age 65 or over.
Common Questions
What is Per Capita Income in Boronda?
Per Capita income in Boronda is $21,377.
What is the Median Family Income in Boronda?
Median Family Income in Boronda is $50,066.
What is the Median Household income in Boronda?
Median Household Income in Boronda is $59,398.
What is Income or Wage Gap in Boronda?
Income or Wage Gap in Boronda is 35.7%.
Women in Boronda earn 64.3 cents for every dollar earned by a man.
What is Inequality or Gini Index in Boronda?
Inequality or Gini Index in Boronda is 0.37.
What is the Total Population of Boronda?
Total Population of Boronda is 1,885.
What is the Total Male Population of Boronda?
Total Male Population of Boronda is 922.
What is the Total Female Population of Boronda?
Total Female Population of Boronda is 963.
What is the Ratio of Males per 100 Females in Boronda?
There are 95.74 Males per 100 Females in Boronda.
What is the Ratio of Females per 100 Males in Boronda?
There are 104.45 Females per 100 Males in Boronda.
What is the Median Population Age in Boronda?
Median Population Age in Boronda is 39.7 Years.
What is the Average Family Size in Boronda
Average Family Size in Boronda is 4.2 People.
What is the Average Household Size in Boronda
Average Household Size in Boronda is 4.3 People.
How Large is the Labor Force in Boronda?
There are 1,018 People in the Labor Forcein in Boronda.
What is the Percentage of People in the Labor Force in Boronda?
67.0% of People are in the Labor Force in Boronda.
What is the Unemployment Rate in Boronda?
Unemployment Rate in Boronda is 17.1%.