Cities with the Highest Percentage of Population with a Degree in Liberal Arts and History in Ohio
RELATED REPORTS & OPTIONS
Liberal Arts and History
Ohio
Compare Cities
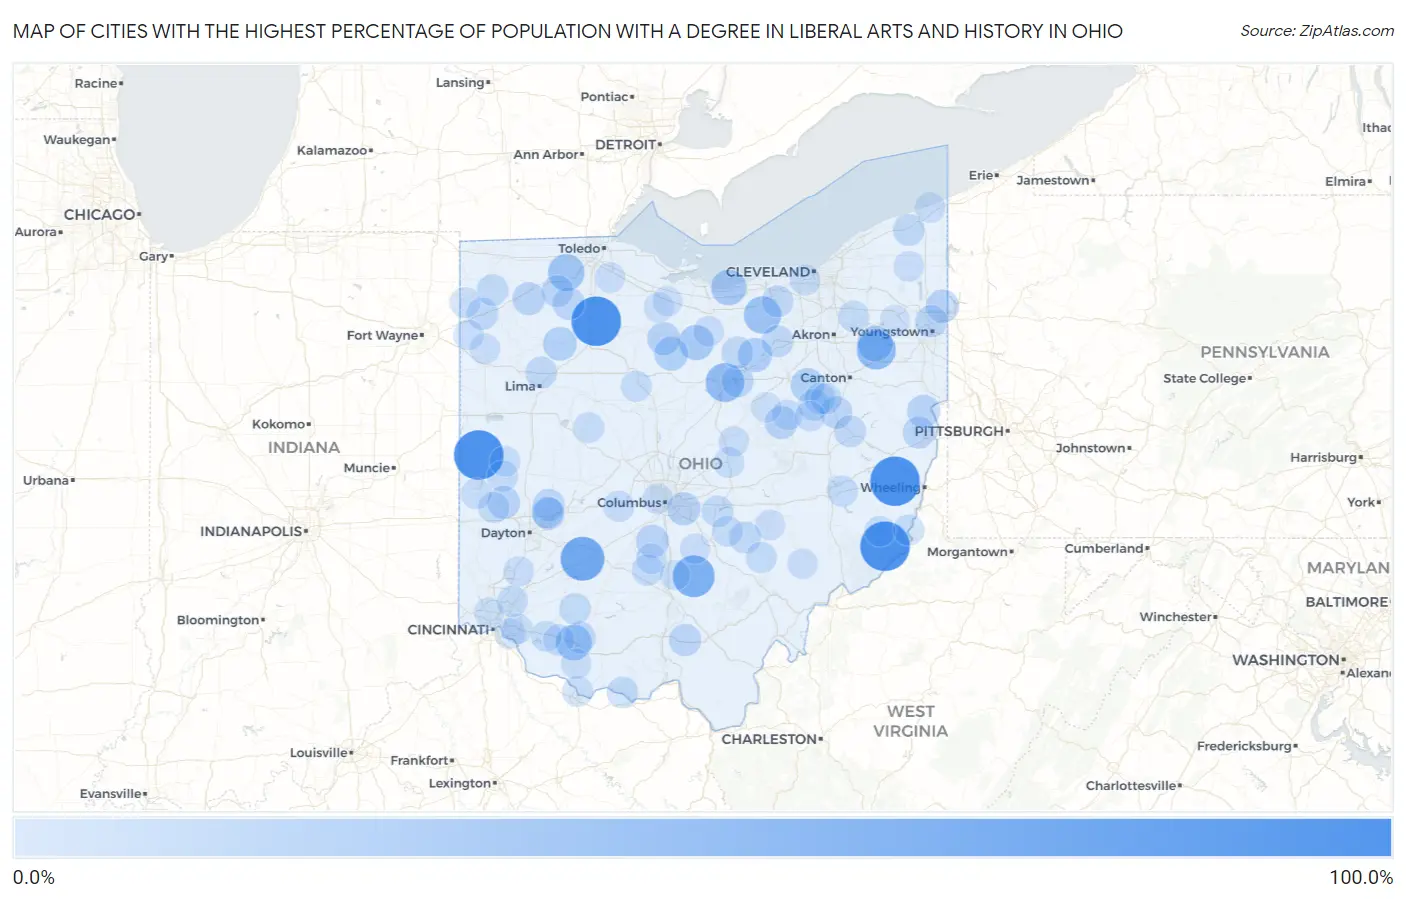
Map of Cities with the Highest Percentage of Population with a Degree in Liberal Arts and History in Ohio
0.0%
100.0%
Cities with the Highest Percentage of Population with a Degree in Liberal Arts and History in Ohio
| City | % Graduates | vs State | vs National | |
| 1. | Rossburg | 100.0% | 4.2%(+95.8)#1 | 4.9%(+95.1)#24 |
| 2. | Bannock | 100.0% | 4.2%(+95.8)#2 | 4.9%(+95.1)#38 |
| 3. | Bairdstown | 100.0% | 4.2%(+95.8)#3 | 4.9%(+95.1)#52 |
| 4. | Antioch | 100.0% | 4.2%(+95.8)#4 | 4.9%(+95.1)#79 |
| 5. | Bowersville | 73.5% | 4.2%(+69.3)#5 | 4.9%(+68.7)#122 |
| 6. | Adelphi | 64.7% | 4.2%(+60.5)#6 | 4.9%(+59.8)#151 |
| 7. | Limaville | 52.0% | 4.2%(+47.8)#7 | 4.9%(+47.1)#215 |
| 8. | Lincoln Heights | 50.0% | 4.2%(+45.8)#8 | 4.9%(+45.1)#226 |
| 9. | Guilford Lake | 45.3% | 4.2%(+41.1)#9 | 4.9%(+40.4)#308 |
| 10. | Pheasant Run | 43.8% | 4.2%(+39.6)#10 | 4.9%(+39.0)#322 |
| 11. | Neapolis | 41.2% | 4.2%(+37.0)#11 | 4.9%(+36.3)#362 |
| 12. | Sardinia | 37.7% | 4.2%(+33.5)#12 | 4.9%(+32.8)#414 |
| 13. | Beulah Beach | 36.4% | 4.2%(+32.2)#13 | 4.9%(+31.5)#453 |
| 14. | Atwater | 35.7% | 4.2%(+31.5)#14 | 4.9%(+30.8)#465 |
| 15. | Celeryville | 34.6% | 4.2%(+30.4)#15 | 4.9%(+29.7)#496 |
| 16. | Polk | 29.8% | 4.2%(+25.6)#16 | 4.9%(+24.9)#665 |
| 17. | Chatfield | 28.6% | 4.2%(+24.4)#17 | 4.9%(+23.7)#713 |
| 18. | Gilboa | 28.6% | 4.2%(+24.4)#18 | 4.9%(+23.7)#715 |
| 19. | Kidron | 28.3% | 4.2%(+24.1)#19 | 4.9%(+23.4)#729 |
| 20. | Yankee Lake | 26.1% | 4.2%(+21.9)#20 | 4.9%(+21.2)#839 |
| 21. | Brice | 26.0% | 4.2%(+21.8)#21 | 4.9%(+21.1)#848 |
| 22. | Bloomville | 25.8% | 4.2%(+21.6)#22 | 4.9%(+20.9)#859 |
| 23. | Killbuck | 25.0% | 4.2%(+20.8)#23 | 4.9%(+20.1)#886 |
| 24. | Irondale | 25.0% | 4.2%(+20.8)#24 | 4.9%(+20.1)#897 |
| 25. | Darbyville | 25.0% | 4.2%(+20.8)#25 | 4.9%(+20.1)#902 |
| 26. | Florida | 25.0% | 4.2%(+20.8)#26 | 4.9%(+20.1)#903 |
| 27. | Potsdam | 24.1% | 4.2%(+19.9)#27 | 4.9%(+19.3)#957 |
| 28. | Beaver | 22.2% | 4.2%(+18.0)#28 | 4.9%(+17.4)#1,075 |
| 29. | Custar | 22.2% | 4.2%(+18.0)#29 | 4.9%(+17.4)#1,084 |
| 30. | Parral | 22.2% | 4.2%(+18.0)#30 | 4.9%(+17.4)#1,086 |
| 31. | Richmond | 21.9% | 4.2%(+17.7)#31 | 4.9%(+17.0)#1,119 |
| 32. | New Carlisle | 21.8% | 4.2%(+17.6)#32 | 4.9%(+16.9)#1,120 |
| 33. | Mifflin | 21.4% | 4.2%(+17.2)#33 | 4.9%(+16.6)#1,159 |
| 34. | Churchill | 21.4% | 4.2%(+17.2)#34 | 4.9%(+16.5)#1,164 |
| 35. | Crystal Lakes | 21.1% | 4.2%(+16.9)#35 | 4.9%(+16.3)#1,180 |
| 36. | Mcclure | 21.1% | 4.2%(+16.9)#36 | 4.9%(+16.2)#1,183 |
| 37. | Savannah | 20.8% | 4.2%(+16.6)#37 | 4.9%(+15.9)#1,209 |
| 38. | Lodi | 20.3% | 4.2%(+16.1)#38 | 4.9%(+15.4)#1,252 |
| 39. | Cairo | 20.2% | 4.2%(+16.0)#39 | 4.9%(+15.4)#1,253 |
| 40. | Park Layne | 20.1% | 4.2%(+16.0)#40 | 4.9%(+15.3)#1,255 |
| 41. | Midvale | 20.0% | 4.2%(+15.8)#41 | 4.9%(+15.1)#1,263 |
| 42. | Junction City | 20.0% | 4.2%(+15.8)#42 | 4.9%(+15.1)#1,264 |
| 43. | Mowrystown | 20.0% | 4.2%(+15.8)#43 | 4.9%(+15.1)#1,274 |
| 44. | Cecil | 20.0% | 4.2%(+15.8)#44 | 4.9%(+15.1)#1,298 |
| 45. | Austinburg | 19.5% | 4.2%(+15.4)#45 | 4.9%(+14.7)#1,334 |
| 46. | Eaton Estates | 19.5% | 4.2%(+15.3)#46 | 4.9%(+14.6)#1,336 |
| 47. | Millersport | 19.2% | 4.2%(+15.0)#47 | 4.9%(+14.4)#1,362 |
| 48. | Ney | 19.0% | 4.2%(+14.8)#48 | 4.9%(+14.2)#1,393 |
| 49. | Lynchburg | 18.5% | 4.2%(+14.3)#49 | 4.9%(+13.6)#1,453 |
| 50. | Winesburg | 18.4% | 4.2%(+14.2)#50 | 4.9%(+13.6)#1,456 |
| 51. | Clarksburg | 18.2% | 4.2%(+14.0)#51 | 4.9%(+13.3)#1,481 |
| 52. | Wilmot | 18.2% | 4.2%(+14.0)#52 | 4.9%(+13.3)#1,488 |
| 53. | Rome Stout | 18.2% | 4.2%(+14.0)#53 | 4.9%(+13.3)#1,504 |
| 54. | Gordon | 17.6% | 4.2%(+13.4)#54 | 4.9%(+12.8)#1,559 |
| 55. | Bradford | 17.4% | 4.2%(+13.2)#55 | 4.9%(+12.5)#1,587 |
| 56. | South Mount Vernon | 17.3% | 4.2%(+13.1)#56 | 4.9%(+12.5)#1,609 |
| 57. | Sugar Bush Knolls | 17.2% | 4.2%(+13.0)#57 | 4.9%(+12.4)#1,626 |
| 58. | Old Washington | 17.1% | 4.2%(+12.9)#58 | 4.9%(+12.3)#1,634 |
| 59. | Mount Orab | 17.1% | 4.2%(+12.9)#59 | 4.9%(+12.2)#1,641 |
| 60. | Highpoint | 17.0% | 4.2%(+12.8)#60 | 4.9%(+12.1)#1,654 |
| 61. | Beach City | 16.7% | 4.2%(+12.5)#61 | 4.9%(+11.8)#1,702 |
| 62. | Clarington | 16.7% | 4.2%(+12.5)#62 | 4.9%(+11.8)#1,720 |
| 63. | Harpster | 16.7% | 4.2%(+12.5)#63 | 4.9%(+11.8)#1,723 |
| 64. | Hemlock | 16.7% | 4.2%(+12.5)#64 | 4.9%(+11.8)#1,724 |
| 65. | Williamsburg | 16.2% | 4.2%(+12.0)#65 | 4.9%(+11.3)#1,820 |
| 66. | Utica | 16.0% | 4.2%(+11.8)#66 | 4.9%(+11.1)#1,851 |
| 67. | Rushsylvania | 16.0% | 4.2%(+11.8)#67 | 4.9%(+11.1)#1,853 |
| 68. | Lafayette | 16.0% | 4.2%(+11.8)#68 | 4.9%(+11.1)#1,857 |
| 69. | West Rushville | 15.9% | 4.2%(+11.7)#69 | 4.9%(+11.0)#1,871 |
| 70. | Linndale | 15.9% | 4.2%(+11.7)#70 | 4.9%(+11.0)#1,878 |
| 71. | Wayne Lakes | 15.9% | 4.2%(+11.7)#71 | 4.9%(+11.0)#1,882 |
| 72. | Aberdeen | 15.4% | 4.2%(+11.2)#72 | 4.9%(+10.5)#1,964 |
| 73. | Millersburg | 15.3% | 4.2%(+11.1)#73 | 4.9%(+10.5)#1,995 |
| 74. | Russia | 15.3% | 4.2%(+11.1)#74 | 4.9%(+10.5)#1,997 |
| 75. | Hicksville | 15.2% | 4.2%(+11.0)#75 | 4.9%(+10.3)#2,008 |
| 76. | Woodsfield | 15.1% | 4.2%(+10.9)#76 | 4.9%(+10.2)#2,035 |
| 77. | North Kingsville | 14.9% | 4.2%(+10.7)#77 | 4.9%(+10.00)#2,072 |
| 78. | Williamsport | 14.7% | 4.2%(+10.5)#78 | 4.9%(+9.86)#2,094 |
| 79. | Fruit Hill | 14.7% | 4.2%(+10.5)#79 | 4.9%(+9.84)#2,102 |
| 80. | North Fairfield | 14.6% | 4.2%(+10.4)#80 | 4.9%(+9.71)#2,135 |
| 81. | Orwell | 14.4% | 4.2%(+10.2)#81 | 4.9%(+9.52)#2,174 |
| 82. | Roseville | 14.3% | 4.2%(+10.1)#82 | 4.9%(+9.41)#2,191 |
| 83. | Russellville | 14.3% | 4.2%(+10.1)#83 | 4.9%(+9.41)#2,197 |
| 84. | Stockport | 14.3% | 4.2%(+10.1)#84 | 4.9%(+9.41)#2,200 |
| 85. | Reno Beach | 14.3% | 4.2%(+10.1)#85 | 4.9%(+9.41)#2,201 |
| 86. | Scott | 14.3% | 4.2%(+10.1)#86 | 4.9%(+9.41)#2,230 |
| 87. | Payne | 14.2% | 4.2%(+10.0)#87 | 4.9%(+9.33)#2,265 |
| 88. | Gambier | 14.1% | 4.2%(+9.89)#88 | 4.9%(+9.22)#2,283 |
| 89. | Hunter | 14.0% | 4.2%(+9.81)#89 | 4.9%(+9.13)#2,300 |
| 90. | Luckey | 13.9% | 4.2%(+9.67)#90 | 4.9%(+9.00)#2,337 |
| 91. | Walnut Creek | 13.8% | 4.2%(+9.62)#91 | 4.9%(+8.95)#2,352 |
| 92. | Marble Cliff | 13.7% | 4.2%(+9.52)#92 | 4.9%(+8.84)#2,385 |
| 93. | Mount Carmel | 13.6% | 4.2%(+9.43)#93 | 4.9%(+8.76)#2,430 |
| 94. | Amanda | 13.6% | 4.2%(+9.38)#94 | 4.9%(+8.71)#2,437 |
| 95. | Nashville | 13.3% | 4.2%(+9.14)#95 | 4.9%(+8.46)#2,512 |
| 96. | South Canal | 13.3% | 4.2%(+9.06)#96 | 4.9%(+8.38)#2,543 |
| 97. | Green Springs | 13.2% | 4.2%(+8.99)#97 | 4.9%(+8.31)#2,559 |
| 98. | North College Hill | 13.1% | 4.2%(+8.88)#98 | 4.9%(+8.20)#2,586 |
| 99. | Kingston | 13.0% | 4.2%(+8.85)#99 | 4.9%(+8.17)#2,595 |
| 100. | Clyde | 12.8% | 4.2%(+8.63)#100 | 4.9%(+7.96)#2,668 |
Common Questions
What are the Top 10 Cities with the Highest Percentage of Population with a Degree in Liberal Arts and History in Ohio?
Top 10 Cities with the Highest Percentage of Population with a Degree in Liberal Arts and History in Ohio are:
#1
100.0%
#2
100.0%
#3
100.0%
#4
100.0%
#5
73.5%
#6
64.7%
#7
52.0%
#8
50.0%
#9
43.8%
#10
41.2%
What city has the Highest Percentage of Population with a Degree in Liberal Arts and History in Ohio?
Rossburg has the Highest Percentage of Population with a Degree in Liberal Arts and History in Ohio with 100.0%.
What is the Percentage of Population with a Degree in Liberal Arts and History in the State of Ohio?
Percentage of Population with a Degree in Liberal Arts and History in Ohio is 4.2%.
What is the Percentage of Population with a Degree in Liberal Arts and History in the United States?
Percentage of Population with a Degree in Liberal Arts and History in the United States is 4.9%.