Zip Codes with the Highest Percentage of Population with a Degree in Liberal Arts and History in Rancho Cordova, CA
RELATED REPORTS & OPTIONS
Liberal Arts and History
Rancho Cordova
Compare Zip Codes
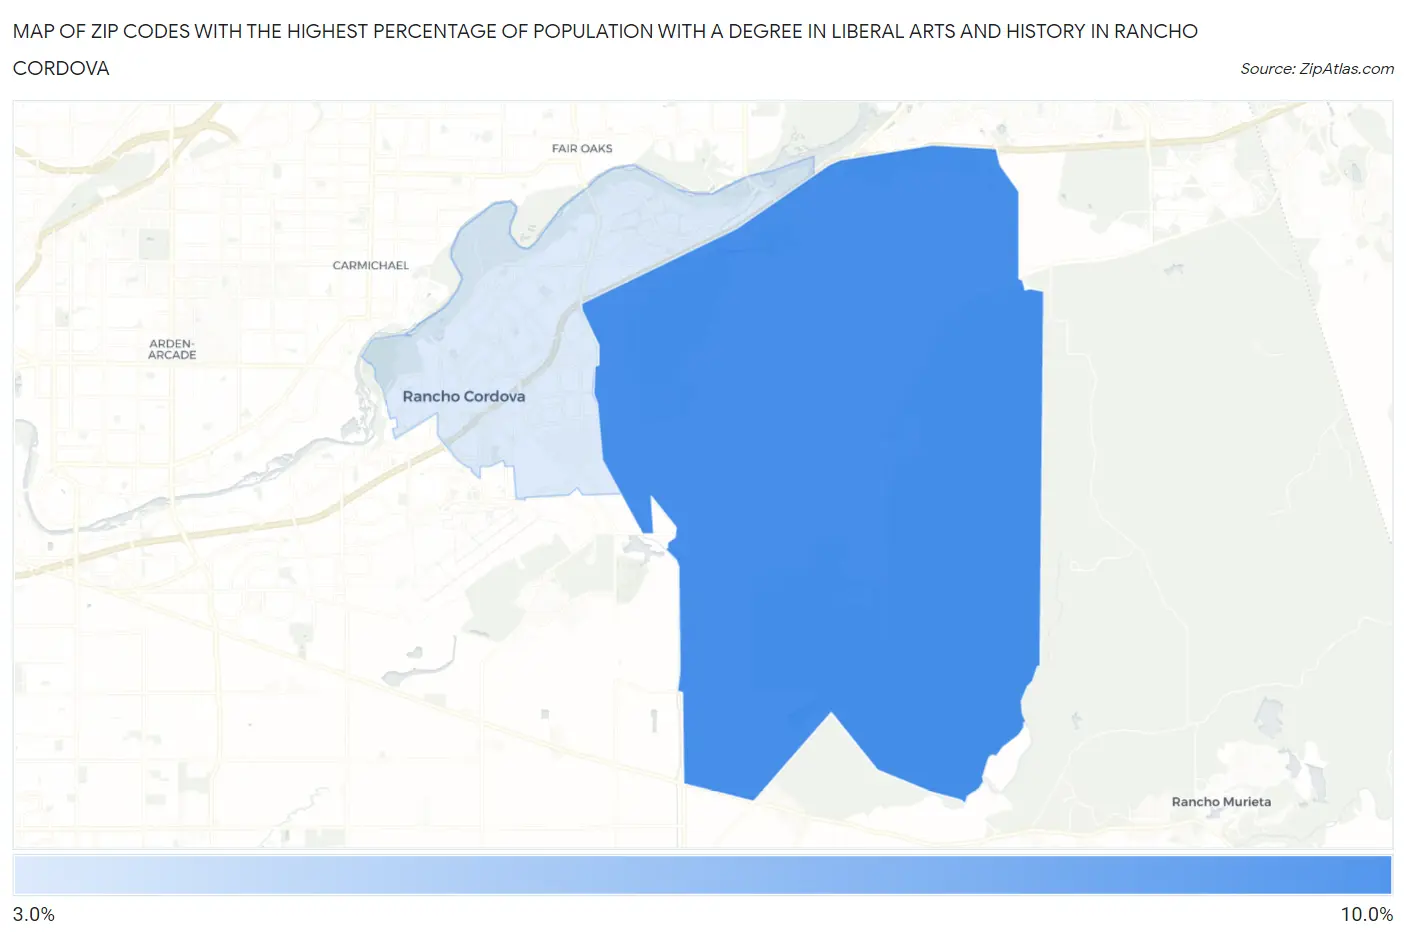
Map of Zip Codes with the Highest Percentage of Population with a Degree in Liberal Arts and History in Rancho Cordova
0.0%
10.0%
Zip Codes with the Highest Percentage of Population with a Degree in Liberal Arts and History in Rancho Cordova, CA
| Zip Code | % Graduates | vs State | vs National | |
| 1. | 95742 | 8.4% | 5.5%(+2.87)#344 | 4.9%(+3.49)#4,478 |
| 2. | 95670 | 4.0% | 5.5%(-1.52)#1,187 | 4.9%(-0.895)#14,879 |
1
Common Questions
What are the Top Zip Codes with the Highest Percentage of Population with a Degree in Liberal Arts and History in Rancho Cordova, CA?
Top Zip Codes with the Highest Percentage of Population with a Degree in Liberal Arts and History in Rancho Cordova, CA are:
What zip code has the Highest Percentage of Population with a Degree in Liberal Arts and History in Rancho Cordova, CA?
95742 has the Highest Percentage of Population with a Degree in Liberal Arts and History in Rancho Cordova, CA with 8.4%.
What is the Percentage of Population with a Degree in Liberal Arts and History in Rancho Cordova, CA?
Percentage of Population with a Degree in Liberal Arts and History in Rancho Cordova is 5.8%.
What is the Percentage of Population with a Degree in Liberal Arts and History in California?
Percentage of Population with a Degree in Liberal Arts and History in California is 5.5%.
What is the Percentage of Population with a Degree in Liberal Arts and History in the United States?
Percentage of Population with a Degree in Liberal Arts and History in the United States is 4.9%.