Cities with the Highest Percentage of Population with a Degree in Liberal Arts and History in Illinois
RELATED REPORTS & OPTIONS
Liberal Arts and History
Illinois
Compare Cities
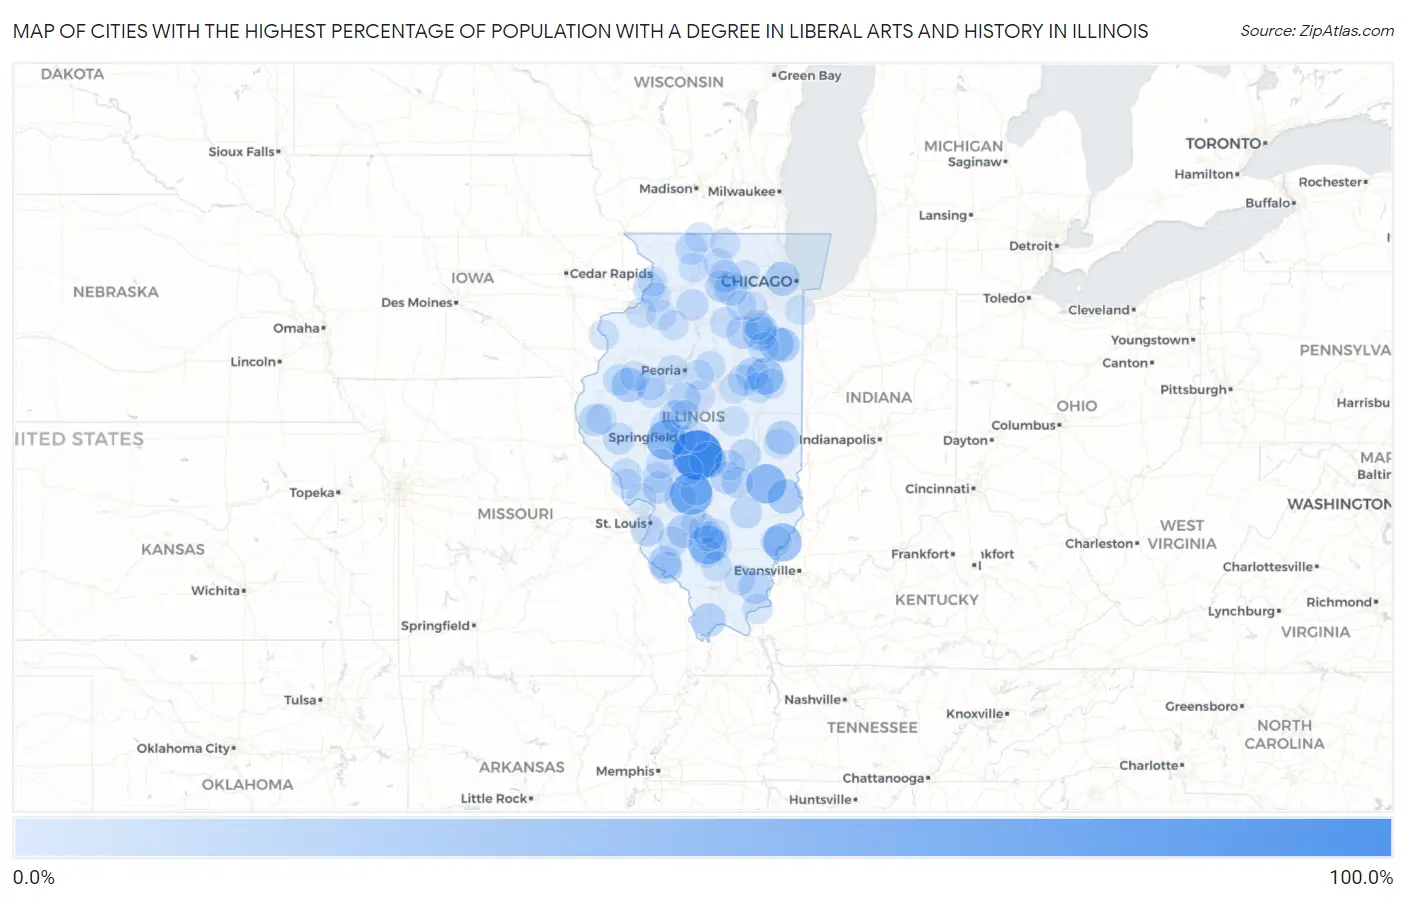
Map of Cities with the Highest Percentage of Population with a Degree in Liberal Arts and History in Illinois
0.0%
100.0%
Cities with the Highest Percentage of Population with a Degree in Liberal Arts and History in Illinois
| City | % Graduates | vs State | vs National | |
| 1. | Langleyville | 100.0% | 4.7%(+95.3)#1 | 4.9%(+95.1)#15 |
| 2. | Lorenzo | 100.0% | 4.7%(+95.3)#2 | 4.9%(+95.1)#71 |
| 3. | Donnellson | 66.7% | 4.7%(+62.0)#3 | 4.9%(+61.8)#144 |
| 4. | Berlin | 54.5% | 4.7%(+49.8)#4 | 4.9%(+49.7)#205 |
| 5. | Hidalgo | 54.5% | 4.7%(+49.8)#5 | 4.9%(+49.7)#206 |
| 6. | Ashley | 50.0% | 4.7%(+45.3)#6 | 4.9%(+45.1)#234 |
| 7. | Alvan | 50.0% | 4.7%(+45.3)#7 | 4.9%(+45.1)#252 |
| 8. | Keensburg | 50.0% | 4.7%(+45.3)#8 | 4.9%(+45.1)#254 |
| 9. | Trilla | 43.8% | 4.7%(+39.0)#9 | 4.9%(+38.9)#324 |
| 10. | Kings | 42.9% | 4.7%(+38.1)#10 | 4.9%(+38.0)#332 |
| 11. | Roberts | 41.9% | 4.7%(+37.1)#11 | 4.9%(+37.0)#356 |
| 12. | Owaneco | 40.5% | 4.7%(+35.8)#12 | 4.9%(+35.7)#370 |
| 13. | Stoy | 33.3% | 4.7%(+28.6)#13 | 4.9%(+28.5)#535 |
| 14. | Irwin | 33.3% | 4.7%(+28.6)#14 | 4.9%(+28.5)#557 |
| 15. | Bardolph | 31.6% | 4.7%(+26.9)#15 | 4.9%(+26.7)#604 |
| 16. | Stone Park | 30.9% | 4.7%(+26.2)#16 | 4.9%(+26.1)#627 |
| 17. | Sammons Point | 30.0% | 4.7%(+25.3)#17 | 4.9%(+25.1)#656 |
| 18. | East Brooklyn | 30.0% | 4.7%(+25.3)#18 | 4.9%(+25.1)#661 |
| 19. | Ullin | 28.4% | 4.7%(+23.6)#19 | 4.9%(+23.5)#726 |
| 20. | Waterman | 27.9% | 4.7%(+23.2)#20 | 4.9%(+23.1)#740 |
| 21. | Damiansville | 27.8% | 4.7%(+23.1)#21 | 4.9%(+22.9)#746 |
| 22. | Hume | 27.3% | 4.7%(+22.6)#22 | 4.9%(+22.4)#771 |
| 23. | San Jose | 26.7% | 4.7%(+22.0)#23 | 4.9%(+21.8)#808 |
| 24. | Evansville | 26.5% | 4.7%(+21.8)#24 | 4.9%(+21.6)#816 |
| 25. | Greenview | 25.6% | 4.7%(+20.9)#25 | 4.9%(+20.8)#863 |
| 26. | East Carondelet | 25.0% | 4.7%(+20.3)#26 | 4.9%(+20.1)#900 |
| 27. | Strawn | 25.0% | 4.7%(+20.3)#27 | 4.9%(+20.1)#918 |
| 28. | Kinsman | 25.0% | 4.7%(+20.3)#28 | 4.9%(+20.1)#922 |
| 29. | Equality | 23.8% | 4.7%(+19.1)#29 | 4.9%(+18.9)#973 |
| 30. | Malta | 23.6% | 4.7%(+18.9)#30 | 4.9%(+18.8)#985 |
| 31. | Coatsburg | 23.5% | 4.7%(+18.8)#31 | 4.9%(+18.7)#997 |
| 32. | Cowden | 22.9% | 4.7%(+18.1)#32 | 4.9%(+18.0)#1,041 |
| 33. | Lee | 22.2% | 4.7%(+17.5)#33 | 4.9%(+17.4)#1,078 |
| 34. | Shipman | 22.1% | 4.7%(+17.4)#34 | 4.9%(+17.2)#1,105 |
| 35. | Godley | 22.0% | 4.7%(+17.2)#35 | 4.9%(+17.1)#1,116 |
| 36. | Ellis Grove | 21.4% | 4.7%(+16.7)#36 | 4.9%(+16.6)#1,155 |
| 37. | Allenville | 21.4% | 4.7%(+16.7)#37 | 4.9%(+16.6)#1,161 |
| 38. | Louisville | 20.9% | 4.7%(+16.1)#38 | 4.9%(+16.0)#1,200 |
| 39. | Ohio | 20.5% | 4.7%(+15.7)#39 | 4.9%(+15.6)#1,231 |
| 40. | Perry | 20.5% | 4.7%(+15.7)#40 | 4.9%(+15.6)#1,232 |
| 41. | New Douglas | 20.0% | 4.7%(+15.3)#41 | 4.9%(+15.1)#1,279 |
| 42. | Anchor | 20.0% | 4.7%(+15.3)#42 | 4.9%(+15.1)#1,287 |
| 43. | Shumway | 20.0% | 4.7%(+15.3)#43 | 4.9%(+15.1)#1,290 |
| 44. | Ridott | 20.0% | 4.7%(+15.3)#44 | 4.9%(+15.1)#1,299 |
| 45. | Coffeen | 19.7% | 4.7%(+15.0)#45 | 4.9%(+14.8)#1,324 |
| 46. | Sciota | 19.2% | 4.7%(+14.5)#46 | 4.9%(+14.4)#1,371 |
| 47. | Albany | 17.8% | 4.7%(+13.1)#47 | 4.9%(+12.9)#1,544 |
| 48. | Woodlawn | 17.5% | 4.7%(+12.8)#48 | 4.9%(+12.6)#1,575 |
| 49. | Secor | 17.2% | 4.7%(+12.5)#49 | 4.9%(+12.4)#1,623 |
| 50. | Armington | 16.7% | 4.7%(+12.0)#50 | 4.9%(+11.8)#1,712 |
| 51. | Kampsville | 16.7% | 4.7%(+12.0)#51 | 4.9%(+11.8)#1,725 |
| 52. | Cabery | 16.7% | 4.7%(+12.0)#52 | 4.9%(+11.8)#1,727 |
| 53. | Browns | 16.7% | 4.7%(+12.0)#53 | 4.9%(+11.8)#1,729 |
| 54. | Harvel | 16.7% | 4.7%(+12.0)#54 | 4.9%(+11.8)#1,730 |
| 55. | Chesterfield | 16.7% | 4.7%(+12.0)#55 | 4.9%(+11.8)#1,733 |
| 56. | Cahokia Heights | 16.6% | 4.7%(+11.9)#56 | 4.9%(+11.7)#1,763 |
| 57. | Camp Point | 16.5% | 4.7%(+11.8)#57 | 4.9%(+11.6)#1,771 |
| 58. | Lewistown | 16.4% | 4.7%(+11.7)#58 | 4.9%(+11.5)#1,786 |
| 59. | Elsah | 16.3% | 4.7%(+11.6)#59 | 4.9%(+11.5)#1,793 |
| 60. | Cuba | 16.1% | 4.7%(+11.4)#60 | 4.9%(+11.3)#1,827 |
| 61. | Galatia | 16.0% | 4.7%(+11.3)#61 | 4.9%(+11.2)#1,845 |
| 62. | Du Bois | 16.0% | 4.7%(+11.3)#62 | 4.9%(+11.1)#1,855 |
| 63. | Carlyle | 15.8% | 4.7%(+11.1)#63 | 4.9%(+10.9)#1,887 |
| 64. | Elizabethtown | 15.8% | 4.7%(+11.1)#64 | 4.9%(+10.9)#1,895 |
| 65. | Elliott | 15.8% | 4.7%(+11.1)#65 | 4.9%(+10.9)#1,896 |
| 66. | Carbon Hill | 15.6% | 4.7%(+10.9)#66 | 4.9%(+10.8)#1,920 |
| 67. | Shelbyville | 15.4% | 4.7%(+10.7)#67 | 4.9%(+10.5)#1,961 |
| 68. | Brocton | 15.4% | 4.7%(+10.7)#68 | 4.9%(+10.5)#1,977 |
| 69. | Deer Creek | 15.3% | 4.7%(+10.6)#69 | 4.9%(+10.4)#1,999 |
| 70. | Monroe Center | 15.3% | 4.7%(+10.6)#70 | 4.9%(+10.4)#2,001 |
| 71. | Palmyra | 15.2% | 4.7%(+10.5)#71 | 4.9%(+10.3)#2,006 |
| 72. | Atkinson | 15.2% | 4.7%(+10.5)#72 | 4.9%(+10.3)#2,012 |
| 73. | Hoffman | 15.2% | 4.7%(+10.4)#73 | 4.9%(+10.3)#2,021 |
| 74. | Mount Morris | 15.1% | 4.7%(+10.4)#74 | 4.9%(+10.2)#2,028 |
| 75. | Naplate | 15.0% | 4.7%(+10.3)#75 | 4.9%(+10.1)#2,047 |
| 76. | Hanna City | 14.9% | 4.7%(+10.2)#76 | 4.9%(+10.0)#2,063 |
| 77. | Millington | 14.9% | 4.7%(+10.2)#77 | 4.9%(+10.0)#2,067 |
| 78. | Southern View | 14.9% | 4.7%(+10.1)#78 | 4.9%(+9.98)#2,075 |
| 79. | Fayetteville | 14.8% | 4.7%(+10.1)#79 | 4.9%(+9.94)#2,082 |
| 80. | Loda | 14.7% | 4.7%(+9.99)#80 | 4.9%(+9.83)#2,106 |
| 81. | Hardin | 14.7% | 4.7%(+9.94)#81 | 4.9%(+9.78)#2,114 |
| 82. | New Boston | 14.6% | 4.7%(+9.92)#82 | 4.9%(+9.76)#2,120 |
| 83. | Mechanicsburg | 14.6% | 4.7%(+9.87)#83 | 4.9%(+9.71)#2,134 |
| 84. | Irvington | 14.6% | 4.7%(+9.87)#84 | 4.9%(+9.71)#2,137 |
| 85. | Fulton | 14.5% | 4.7%(+9.77)#85 | 4.9%(+9.61)#2,152 |
| 86. | Tallula | 14.5% | 4.7%(+9.76)#86 | 4.9%(+9.60)#2,156 |
| 87. | Durand | 14.5% | 4.7%(+9.74)#87 | 4.9%(+9.58)#2,161 |
| 88. | Candlewick Lake | 14.3% | 4.7%(+9.59)#88 | 4.9%(+9.43)#2,186 |
| 89. | Valier | 14.3% | 4.7%(+9.57)#89 | 4.9%(+9.41)#2,195 |
| 90. | Prairie City | 14.3% | 4.7%(+9.57)#90 | 4.9%(+9.41)#2,212 |
| 91. | Cisco | 14.3% | 4.7%(+9.57)#91 | 4.9%(+9.41)#2,220 |
| 92. | Ellsworth | 14.3% | 4.7%(+9.57)#92 | 4.9%(+9.41)#2,232 |
| 93. | Erie | 13.9% | 4.7%(+9.21)#93 | 4.9%(+9.05)#2,324 |
| 94. | Neponset | 13.6% | 4.7%(+8.92)#94 | 4.9%(+8.76)#2,409 |
| 95. | Virgil | 13.6% | 4.7%(+8.92)#95 | 4.9%(+8.76)#2,415 |
| 96. | Middletown | 13.3% | 4.7%(+8.62)#96 | 4.9%(+8.46)#2,515 |
| 97. | Plattville | 13.3% | 4.7%(+8.62)#97 | 4.9%(+8.46)#2,520 |
| 98. | Walnut Hill | 13.3% | 4.7%(+8.62)#98 | 4.9%(+8.46)#2,527 |
| 99. | Colona | 13.3% | 4.7%(+8.60)#99 | 4.9%(+8.44)#2,535 |
| 100. | Sauk Village | 13.2% | 4.7%(+8.48)#100 | 4.9%(+8.32)#2,557 |
Common Questions
What are the Top 10 Cities with the Highest Percentage of Population with a Degree in Liberal Arts and History in Illinois?
Top 10 Cities with the Highest Percentage of Population with a Degree in Liberal Arts and History in Illinois are:
#1
100.0%
#2
66.7%
#3
54.5%
#4
54.5%
#5
50.0%
#6
50.0%
#7
41.9%
#8
40.5%
#9
33.3%
#10
33.3%
What city has the Highest Percentage of Population with a Degree in Liberal Arts and History in Illinois?
Langleyville has the Highest Percentage of Population with a Degree in Liberal Arts and History in Illinois with 100.0%.
What is the Percentage of Population with a Degree in Liberal Arts and History in the State of Illinois?
Percentage of Population with a Degree in Liberal Arts and History in Illinois is 4.7%.
What is the Percentage of Population with a Degree in Liberal Arts and History in the United States?
Percentage of Population with a Degree in Liberal Arts and History in the United States is 4.9%.