Zip Codes with the Highest Percentage of Population with a Degree in Liberal Arts and History in Whittier, CA
RELATED REPORTS & OPTIONS
Liberal Arts and History
Whittier
Compare Zip Codes
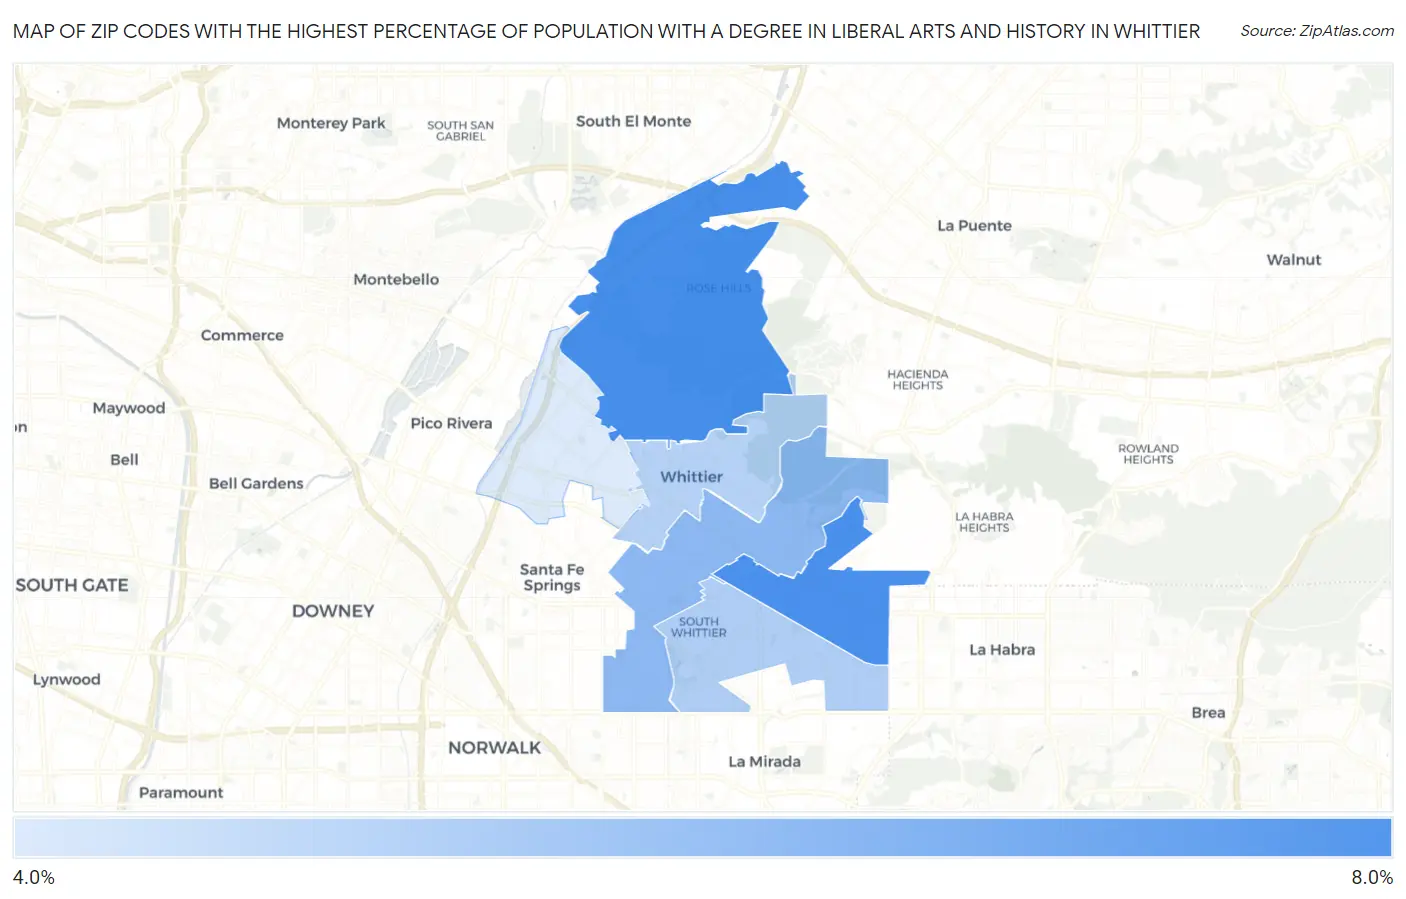
Map of Zip Codes with the Highest Percentage of Population with a Degree in Liberal Arts and History in Whittier
4.5%
7.8%
Zip Codes with the Highest Percentage of Population with a Degree in Liberal Arts and History in Whittier, CA
| Zip Code | % Graduates | vs State | vs National | |
| 1. | 90601 | 7.8% | 5.5%(+2.30)#413 | 4.9%(+2.92)#5,189 |
| 2. | 90603 | 7.7% | 5.5%(+2.23)#424 | 4.9%(+2.85)#5,265 |
| 3. | 90605 | 6.3% | 5.5%(+0.803)#662 | 4.9%(+1.43)#7,792 |
| 4. | 90604 | 5.5% | 5.5%(+0.021)#855 | 4.9%(+0.645)#9,832 |
| 5. | 90602 | 5.4% | 5.5%(-0.126)#890 | 4.9%(+0.498)#10,204 |
| 6. | 90606 | 4.5% | 5.5%(-0.960)#1,070 | 4.9%(-0.336)#12,864 |
1
Common Questions
What are the Top 5 Zip Codes with the Highest Percentage of Population with a Degree in Liberal Arts and History in Whittier, CA?
Top 5 Zip Codes with the Highest Percentage of Population with a Degree in Liberal Arts and History in Whittier, CA are:
What zip code has the Highest Percentage of Population with a Degree in Liberal Arts and History in Whittier, CA?
90601 has the Highest Percentage of Population with a Degree in Liberal Arts and History in Whittier, CA with 7.8%.
What is the Percentage of Population with a Degree in Liberal Arts and History in Whittier, CA?
Percentage of Population with a Degree in Liberal Arts and History in Whittier is 6.9%.
What is the Percentage of Population with a Degree in Liberal Arts and History in California?
Percentage of Population with a Degree in Liberal Arts and History in California is 5.5%.
What is the Percentage of Population with a Degree in Liberal Arts and History in the United States?
Percentage of Population with a Degree in Liberal Arts and History in the United States is 4.9%.