Zip Codes with the Highest Percentage of Population with a Degree in Liberal Arts and History in Carson, CA
RELATED REPORTS & OPTIONS
Liberal Arts and History
Carson
Compare Zip Codes
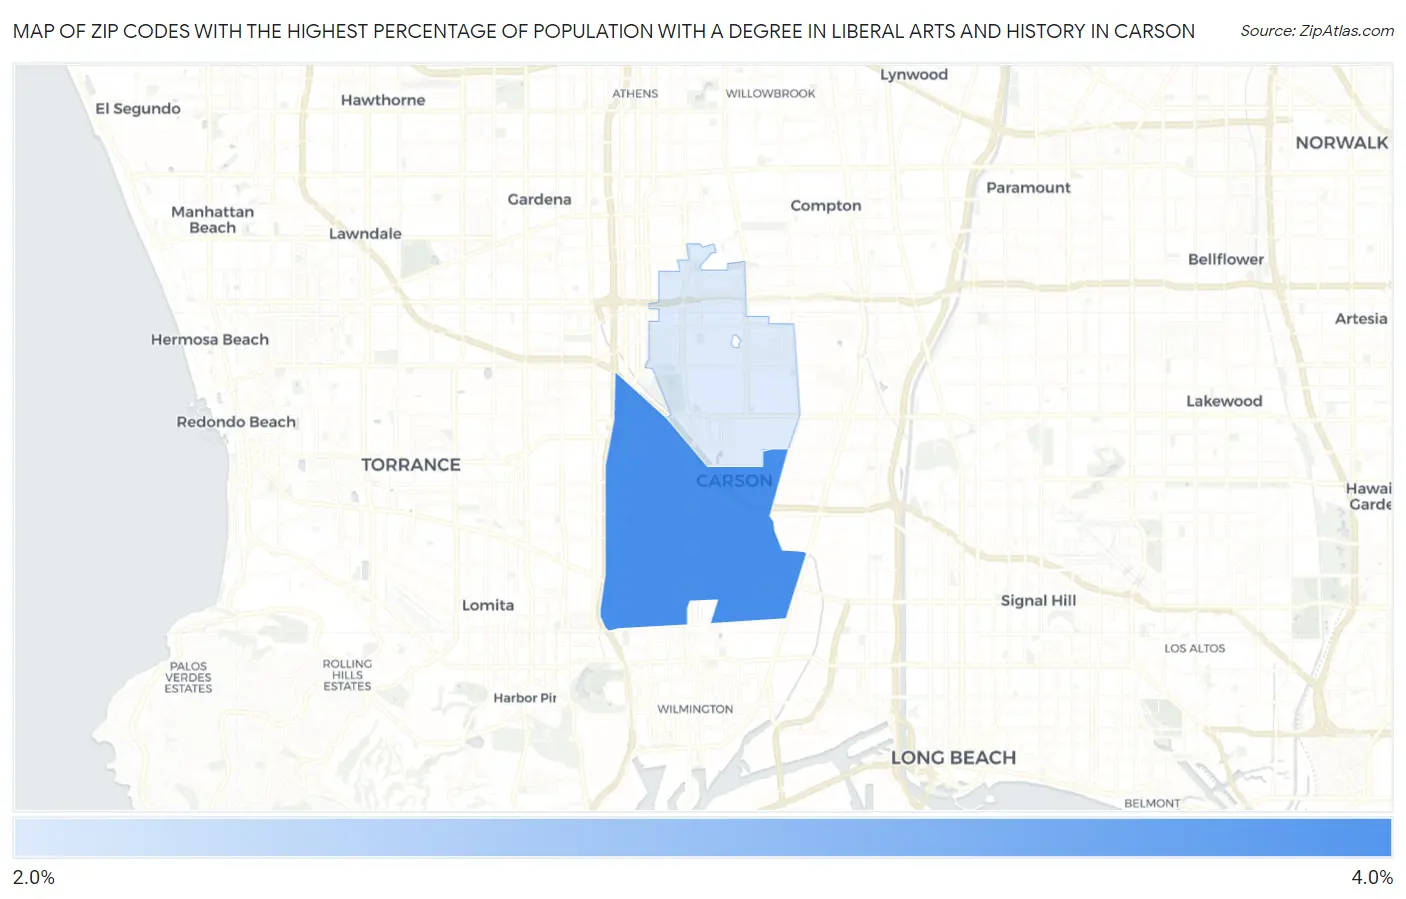
Map of Zip Codes with the Highest Percentage of Population with a Degree in Liberal Arts and History in Carson
2.6%
3.4%
Zip Codes with the Highest Percentage of Population with a Degree in Liberal Arts and History in Carson, CA
| Zip Code | % Graduates | vs State | vs National | |
| 1. | 90745 | 3.4% | 5.5%(-2.05)#1,288 | 4.9%(-1.43)#16,841 |
| 2. | 90746 | 2.6% | 5.5%(-2.90)#1,388 | 4.9%(-2.27)#19,658 |
1
Common Questions
What are the Top Zip Codes with the Highest Percentage of Population with a Degree in Liberal Arts and History in Carson, CA?
Top Zip Codes with the Highest Percentage of Population with a Degree in Liberal Arts and History in Carson, CA are:
What zip code has the Highest Percentage of Population with a Degree in Liberal Arts and History in Carson, CA?
90745 has the Highest Percentage of Population with a Degree in Liberal Arts and History in Carson, CA with 3.4%.
What is the Percentage of Population with a Degree in Liberal Arts and History in Carson, CA?
Percentage of Population with a Degree in Liberal Arts and History in Carson is 3.3%.
What is the Percentage of Population with a Degree in Liberal Arts and History in California?
Percentage of Population with a Degree in Liberal Arts and History in California is 5.5%.
What is the Percentage of Population with a Degree in Liberal Arts and History in the United States?
Percentage of Population with a Degree in Liberal Arts and History in the United States is 4.9%.