Cities with the Highest Percentage of Population with a Degree in Liberal Arts and History in Texas
RELATED REPORTS & OPTIONS
Liberal Arts and History
Texas
Compare Cities
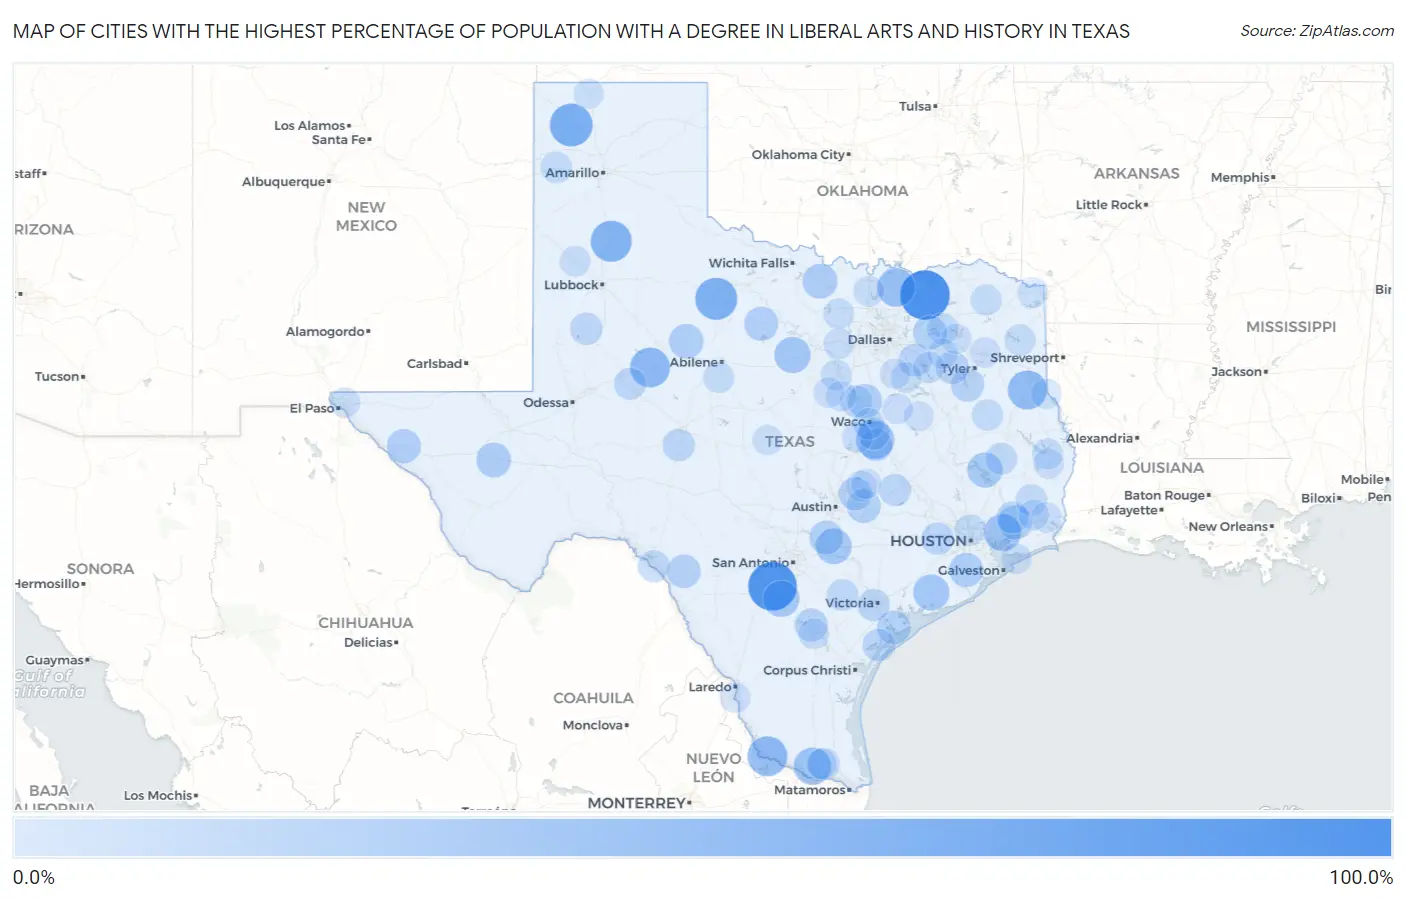
Map of Cities with the Highest Percentage of Population with a Degree in Liberal Arts and History in Texas
0.0%
100.0%
Cities with the Highest Percentage of Population with a Degree in Liberal Arts and History in Texas
| City | % Graduates | vs State | vs National | |
| 1. | Bailey | 100.0% | 4.2%(+95.8)#1 | 4.9%(+95.1)#26 |
| 2. | Bigfoot | 95.5% | 4.2%(+91.4)#2 | 4.9%(+90.7)#92 |
| 3. | Lelia Lake | 71.4% | 4.2%(+67.3)#3 | 4.9%(+66.6)#127 |
| 4. | Mccaulley | 71.4% | 4.2%(+67.3)#4 | 4.9%(+66.6)#129 |
| 5. | Hartley | 69.9% | 4.2%(+65.7)#5 | 4.9%(+65.0)#133 |
| 6. | O Brien | 66.7% | 4.2%(+62.5)#6 | 4.9%(+61.8)#147 |
| 7. | Seth Ward | 62.2% | 4.2%(+58.0)#7 | 4.9%(+57.3)#160 |
| 8. | Westbrook | 57.1% | 4.2%(+53.0)#8 | 4.9%(+52.3)#187 |
| 9. | Garceno | 57.1% | 4.2%(+53.0)#9 | 4.9%(+52.3)#189 |
| 10. | Gary City | 53.8% | 4.2%(+49.7)#10 | 4.9%(+49.0)#208 |
| 11. | Chilton | 50.0% | 4.2%(+45.8)#11 | 4.9%(+45.1)#223 |
| 12. | Dorchester | 50.0% | 4.2%(+45.8)#12 | 4.9%(+45.1)#275 |
| 13. | Lopezville | 46.3% | 4.2%(+42.2)#13 | 4.9%(+41.5)#296 |
| 14. | Old River Winfree | 45.8% | 4.2%(+41.7)#14 | 4.9%(+41.0)#302 |
| 15. | Charlotte | 42.1% | 4.2%(+38.0)#15 | 4.9%(+37.2)#353 |
| 16. | Strawn | 41.7% | 4.2%(+37.5)#16 | 4.9%(+36.8)#357 |
| 17. | Markham | 41.0% | 4.2%(+36.8)#17 | 4.9%(+36.1)#367 |
| 18. | Kingsbury | 40.0% | 4.2%(+35.8)#18 | 4.9%(+35.1)#381 |
| 19. | Onalaska | 36.8% | 4.2%(+32.7)#19 | 4.9%(+32.0)#436 |
| 20. | Allison | 36.4% | 4.2%(+32.2)#20 | 4.9%(+31.5)#452 |
| 21. | Bellevue | 36.0% | 4.2%(+31.8)#21 | 4.9%(+31.1)#459 |
| 22. | Balmorhea | 35.7% | 4.2%(+31.6)#22 | 4.9%(+30.8)#466 |
| 23. | Roby | 34.5% | 4.2%(+30.4)#23 | 4.9%(+29.7)#497 |
| 24. | Sierra Blanca | 33.3% | 4.2%(+29.2)#24 | 4.9%(+28.5)#520 |
| 25. | Devers | 33.3% | 4.2%(+29.2)#25 | 4.9%(+28.5)#523 |
| 26. | Bonney | 33.3% | 4.2%(+29.2)#26 | 4.9%(+28.5)#532 |
| 27. | Aquilla | 33.3% | 4.2%(+29.2)#27 | 4.9%(+28.5)#547 |
| 28. | Woodson | 32.8% | 4.2%(+28.6)#28 | 4.9%(+27.9)#573 |
| 29. | Hawk Cove | 31.8% | 4.2%(+27.7)#29 | 4.9%(+26.9)#599 |
| 30. | Mcdade | 31.8% | 4.2%(+27.6)#30 | 4.9%(+26.9)#601 |
| 31. | Redwood | 31.6% | 4.2%(+27.4)#31 | 4.9%(+26.7)#609 |
| 32. | Seadrift | 31.2% | 4.2%(+27.0)#32 | 4.9%(+26.3)#623 |
| 33. | Fort Clark Springs | 30.7% | 4.2%(+26.5)#33 | 4.9%(+25.8)#637 |
| 34. | Shadybrook | 29.1% | 4.2%(+24.9)#34 | 4.9%(+24.2)#694 |
| 35. | Three Rivers | 28.6% | 4.2%(+24.4)#35 | 4.9%(+23.7)#702 |
| 36. | Coupland | 28.6% | 4.2%(+24.4)#36 | 4.9%(+23.7)#706 |
| 37. | Callender Lake | 27.6% | 4.2%(+23.5)#37 | 4.9%(+22.8)#755 |
| 38. | Grays Prairie | 27.1% | 4.2%(+22.9)#38 | 4.9%(+22.2)#786 |
| 39. | Lingleville | 26.3% | 4.2%(+22.2)#39 | 4.9%(+21.4)#828 |
| 40. | Brookshire | 25.9% | 4.2%(+21.8)#40 | 4.9%(+21.0)#853 |
| 41. | Lamar | 25.8% | 4.2%(+21.6)#41 | 4.9%(+20.9)#858 |
| 42. | Lott | 25.8% | 4.2%(+21.6)#42 | 4.9%(+20.9)#860 |
| 43. | Christoval | 25.6% | 4.2%(+21.5)#43 | 4.9%(+20.8)#865 |
| 44. | Quail Creek | 25.2% | 4.2%(+21.1)#44 | 4.9%(+20.4)#879 |
| 45. | Welch | 25.0% | 4.2%(+20.8)#45 | 4.9%(+20.1)#898 |
| 46. | Golinda | 24.7% | 4.2%(+20.5)#46 | 4.9%(+19.8)#930 |
| 47. | Caldwell | 24.1% | 4.2%(+19.9)#47 | 4.9%(+19.2)#959 |
| 48. | Daisetta | 24.0% | 4.2%(+19.8)#48 | 4.9%(+19.1)#962 |
| 49. | Forsan | 24.0% | 4.2%(+19.8)#49 | 4.9%(+19.1)#964 |
| 50. | Edcouch | 23.4% | 4.2%(+19.2)#50 | 4.9%(+18.5)#1,006 |
| 51. | Corrigan | 23.3% | 4.2%(+19.2)#51 | 4.9%(+18.5)#1,008 |
| 52. | Cienegas Terrace | 23.3% | 4.2%(+19.2)#52 | 4.9%(+18.5)#1,009 |
| 53. | Laguna Park | 23.3% | 4.2%(+19.2)#53 | 4.9%(+18.4)#1,015 |
| 54. | Nordheim | 23.3% | 4.2%(+19.1)#54 | 4.9%(+18.4)#1,018 |
| 55. | Kountze | 22.5% | 4.2%(+18.3)#55 | 4.9%(+17.6)#1,064 |
| 56. | Adrian | 22.5% | 4.2%(+18.3)#56 | 4.9%(+17.6)#1,067 |
| 57. | Alto | 21.7% | 4.2%(+17.5)#57 | 4.9%(+16.8)#1,129 |
| 58. | Point | 21.3% | 4.2%(+17.2)#58 | 4.9%(+16.4)#1,169 |
| 59. | Beverly Hills | 21.3% | 4.2%(+17.1)#59 | 4.9%(+16.4)#1,173 |
| 60. | Rock Island | 21.1% | 4.2%(+16.9)#60 | 4.9%(+16.2)#1,185 |
| 61. | Huckabay | 20.9% | 4.2%(+16.8)#61 | 4.9%(+16.1)#1,193 |
| 62. | Pine Harbor | 20.8% | 4.2%(+16.6)#62 | 4.9%(+15.9)#1,208 |
| 63. | Aldine | 20.7% | 4.2%(+16.6)#63 | 4.9%(+15.8)#1,215 |
| 64. | Mabank | 20.4% | 4.2%(+16.2)#64 | 4.9%(+15.5)#1,237 |
| 65. | Tuscola | 20.0% | 4.2%(+15.8)#65 | 4.9%(+15.1)#1,267 |
| 66. | Talco | 20.0% | 4.2%(+15.8)#66 | 4.9%(+15.1)#1,270 |
| 67. | Sam Rayburn | 19.9% | 4.2%(+15.8)#67 | 4.9%(+15.1)#1,310 |
| 68. | Paradise | 19.6% | 4.2%(+15.5)#68 | 4.9%(+14.8)#1,327 |
| 69. | Littlefield | 19.6% | 4.2%(+15.4)#69 | 4.9%(+14.7)#1,330 |
| 70. | Glen Rose | 19.2% | 4.2%(+15.0)#70 | 4.9%(+14.3)#1,373 |
| 71. | Valley View | 19.2% | 4.2%(+15.0)#71 | 4.9%(+14.3)#1,375 |
| 72. | Annetta North | 19.1% | 4.2%(+14.9)#72 | 4.9%(+14.2)#1,385 |
| 73. | George West | 18.8% | 4.2%(+14.7)#73 | 4.9%(+14.0)#1,416 |
| 74. | Rice | 18.5% | 4.2%(+14.4)#74 | 4.9%(+13.6)#1,447 |
| 75. | Thrall | 18.3% | 4.2%(+14.2)#75 | 4.9%(+13.5)#1,463 |
| 76. | Santo | 18.3% | 4.2%(+14.1)#76 | 4.9%(+13.4)#1,467 |
| 77. | Elsa | 18.3% | 4.2%(+14.1)#77 | 4.9%(+13.4)#1,468 |
| 78. | Chula Vista Cdp Maverick County | 18.2% | 4.2%(+14.0)#78 | 4.9%(+13.3)#1,473 |
| 79. | Moody | 18.2% | 4.2%(+14.0)#79 | 4.9%(+13.3)#1,476 |
| 80. | Bardwell | 18.2% | 4.2%(+14.0)#80 | 4.9%(+13.3)#1,480 |
| 81. | Carter | 18.1% | 4.2%(+14.0)#81 | 4.9%(+13.3)#1,507 |
| 82. | Coolidge | 18.1% | 4.2%(+13.9)#82 | 4.9%(+13.2)#1,508 |
| 83. | Big Sandy | 18.0% | 4.2%(+13.8)#83 | 4.9%(+13.1)#1,516 |
| 84. | Jasper | 17.9% | 4.2%(+13.8)#84 | 4.9%(+13.0)#1,524 |
| 85. | Rose City | 17.9% | 4.2%(+13.7)#85 | 4.9%(+13.0)#1,535 |
| 86. | Bolivar Peninsula | 17.8% | 4.2%(+13.7)#86 | 4.9%(+13.0)#1,539 |
| 87. | Meridian | 17.6% | 4.2%(+13.4)#87 | 4.9%(+12.7)#1,566 |
| 88. | Alba | 17.5% | 4.2%(+13.3)#88 | 4.9%(+12.6)#1,579 |
| 89. | Bevil Oaks | 17.4% | 4.2%(+13.3)#89 | 4.9%(+12.6)#1,581 |
| 90. | Fort Bliss | 17.4% | 4.2%(+13.3)#90 | 4.9%(+12.5)#1,584 |
| 91. | El Cenizo | 17.4% | 4.2%(+13.2)#91 | 4.9%(+12.5)#1,586 |
| 92. | Joaquin | 17.4% | 4.2%(+13.2)#92 | 4.9%(+12.5)#1,590 |
| 93. | Iredell | 17.4% | 4.2%(+13.2)#93 | 4.9%(+12.5)#1,597 |
| 94. | Richland Springs | 17.4% | 4.2%(+13.2)#94 | 4.9%(+12.5)#1,600 |
| 95. | Canton | 17.0% | 4.2%(+12.8)#95 | 4.9%(+12.1)#1,655 |
| 96. | Thorndale | 16.9% | 4.2%(+12.8)#96 | 4.9%(+12.1)#1,666 |
| 97. | Hooks | 16.8% | 4.2%(+12.6)#97 | 4.9%(+11.9)#1,690 |
| 98. | Teague | 16.7% | 4.2%(+12.6)#98 | 4.9%(+11.8)#1,691 |
| 99. | Rockwell Place | 16.4% | 4.2%(+12.3)#99 | 4.9%(+11.6)#1,782 |
| 100. | Stratford | 16.3% | 4.2%(+12.1)#100 | 4.9%(+11.4)#1,797 |
Common Questions
What are the Top 10 Cities with the Highest Percentage of Population with a Degree in Liberal Arts and History in Texas?
Top 10 Cities with the Highest Percentage of Population with a Degree in Liberal Arts and History in Texas are:
What city has the Highest Percentage of Population with a Degree in Liberal Arts and History in Texas?
Bailey has the Highest Percentage of Population with a Degree in Liberal Arts and History in Texas with 100.0%.
What is the Percentage of Population with a Degree in Liberal Arts and History in the State of Texas?
Percentage of Population with a Degree in Liberal Arts and History in Texas is 4.2%.
What is the Percentage of Population with a Degree in Liberal Arts and History in the United States?
Percentage of Population with a Degree in Liberal Arts and History in the United States is 4.9%.