Cities with the Highest Percentage of Population with a Degree in Liberal Arts and History in Vermont
RELATED REPORTS & OPTIONS
Liberal Arts and History
Vermont
Compare Cities
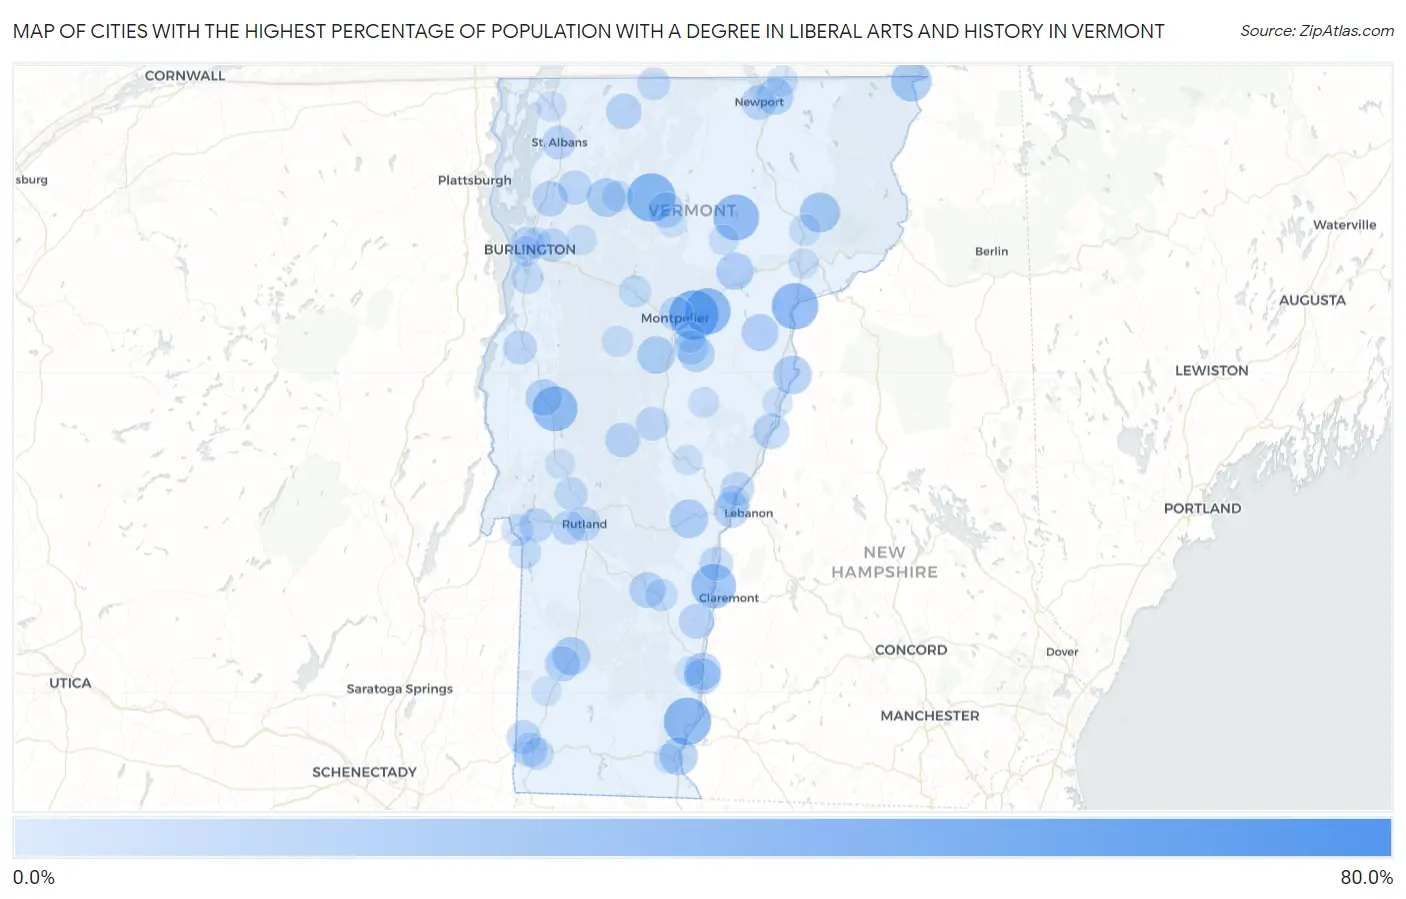
Map of Cities with the Highest Percentage of Population with a Degree in Liberal Arts and History in Vermont
0.0%
80.0%
Cities with the Highest Percentage of Population with a Degree in Liberal Arts and History in Vermont
| City | % Graduates | vs State | vs National | |
| 1. | Stratton Mountain | 61.9% | 7.2%(+54.7)#1 | 4.9%(+57.0)#161 |
| 2. | Gilman | 42.5% | 7.2%(+35.3)#2 | 4.9%(+37.6)#347 |
| 3. | Lyndon Center | 40.1% | 7.2%(+32.9)#3 | 4.9%(+35.3)#374 |
| 4. | Highgate Center | 37.9% | 7.2%(+30.7)#4 | 4.9%(+33.1)#411 |
| 5. | New Haven | 35.9% | 7.2%(+28.7)#5 | 4.9%(+31.0)#462 |
| 6. | East Montpelier | 34.9% | 7.2%(+27.7)#6 | 4.9%(+30.0)#485 |
| 7. | North Hyde Park | 34.6% | 7.2%(+27.4)#7 | 4.9%(+29.7)#493 |
| 8. | Johnson | 33.2% | 7.2%(+25.9)#8 | 4.9%(+28.3)#566 |
| 9. | Putney | 31.5% | 7.2%(+24.2)#9 | 4.9%(+26.6)#611 |
| 10. | Barnet | 30.0% | 7.2%(+22.8)#10 | 4.9%(+25.1)#657 |
| 11. | Plainfield | 29.7% | 7.2%(+22.4)#11 | 4.9%(+24.8)#670 |
| 12. | Greensboro | 28.8% | 7.2%(+21.6)#12 | 4.9%(+23.9)#700 |
| 13. | Bolton | 28.6% | 7.2%(+21.3)#13 | 4.9%(+23.7)#722 |
| 14. | East Middlebury | 27.5% | 7.2%(+20.2)#14 | 4.9%(+22.6)#764 |
| 15. | Ascutney | 26.7% | 7.2%(+19.4)#15 | 4.9%(+21.8)#809 |
| 16. | Grafton | 23.5% | 7.2%(+16.3)#16 | 4.9%(+18.7)#998 |
| 17. | West Woodstock | 23.2% | 7.2%(+16.0)#17 | 4.9%(+18.3)#1,020 |
| 18. | Canaan | 20.0% | 7.2%(+12.8)#18 | 4.9%(+15.1)#1,282 |
| 19. | East Burke | 19.2% | 7.2%(+11.9)#19 | 4.9%(+14.3)#1,376 |
| 20. | East Poultney | 19.0% | 7.2%(+11.8)#20 | 4.9%(+14.1)#1,397 |
| 21. | Woodstock | 16.9% | 7.2%(+9.71)#21 | 4.9%(+12.1)#1,665 |
| 22. | Jamaica | 16.9% | 7.2%(+9.69)#22 | 4.9%(+12.1)#1,670 |
| 23. | Cambridge | 16.7% | 7.2%(+9.43)#23 | 4.9%(+11.8)#1,734 |
| 24. | Newbury | 16.4% | 7.2%(+9.21)#24 | 4.9%(+11.6)#1,781 |
| 25. | Manchester Center | 15.9% | 7.2%(+8.71)#25 | 4.9%(+11.1)#1,862 |
| 26. | Brattleboro | 15.9% | 7.2%(+8.69)#26 | 4.9%(+11.1)#1,865 |
| 27. | Northfield | 15.2% | 7.2%(+7.95)#27 | 4.9%(+10.3)#2,016 |
| 28. | Cabot | 14.9% | 7.2%(+7.66)#28 | 4.9%(+10.0)#2,069 |
| 29. | Bellows Falls | 14.4% | 7.2%(+7.15)#29 | 4.9%(+9.51)#2,177 |
| 30. | Groton | 14.2% | 7.2%(+6.93)#30 | 4.9%(+9.29)#2,269 |
| 31. | Middlebury | 13.9% | 7.2%(+6.66)#31 | 4.9%(+9.02)#2,330 |
| 32. | Derby Center | 13.9% | 7.2%(+6.66)#32 | 4.9%(+9.02)#2,332 |
| 33. | South Lincoln | 13.2% | 7.2%(+5.97)#33 | 4.9%(+8.34)#2,554 |
| 34. | Graniteville | 13.0% | 7.2%(+5.81)#34 | 4.9%(+8.17)#2,598 |
| 35. | North Westminster | 12.8% | 7.2%(+5.59)#35 | 4.9%(+7.95)#2,673 |
| 36. | Ludlow | 12.3% | 7.2%(+5.10)#36 | 4.9%(+7.46)#2,843 |
| 37. | White River Junction | 12.2% | 7.2%(+4.92)#37 | 4.9%(+7.28)#2,906 |
| 38. | Enosburg Falls | 12.0% | 7.2%(+4.77)#38 | 4.9%(+7.13)#2,964 |
| 39. | Hyde Park | 12.0% | 7.2%(+4.77)#39 | 4.9%(+7.13)#2,973 |
| 40. | Fairlee | 12.0% | 7.2%(+4.77)#40 | 4.9%(+7.13)#2,984 |
| 41. | Milton | 11.8% | 7.2%(+4.58)#41 | 4.9%(+6.94)#3,055 |
| 42. | Manchester | 11.5% | 7.2%(+4.26)#42 | 4.9%(+6.62)#3,186 |
| 43. | Springfield | 10.9% | 7.2%(+3.64)#43 | 4.9%(+6.00)#3,492 |
| 44. | Newport | 10.6% | 7.2%(+3.36)#44 | 4.9%(+5.72)#3,638 |
| 45. | Rochester | 10.4% | 7.2%(+3.20)#45 | 4.9%(+5.56)#3,748 |
| 46. | Fairfax | 10.0% | 7.2%(+2.73)#46 | 4.9%(+5.09)#4,029 |
| 47. | Rutland | 9.9% | 7.2%(+2.71)#47 | 4.9%(+5.07)#4,034 |
| 48. | South Barre | 9.9% | 7.2%(+2.65)#48 | 4.9%(+5.01)#4,062 |
| 49. | Old Bennington | 9.7% | 7.2%(+2.48)#49 | 4.9%(+4.84)#4,170 |
| 50. | North Bennington | 9.6% | 7.2%(+2.40)#50 | 4.9%(+4.76)#4,229 |
| 51. | West Rutland | 9.3% | 7.2%(+2.10)#51 | 4.9%(+4.46)#4,447 |
| 52. | Montpelier | 9.3% | 7.2%(+2.03)#52 | 4.9%(+4.39)#4,493 |
| 53. | Castleton | 9.3% | 7.2%(+2.03)#53 | 4.9%(+4.39)#4,500 |
| 54. | Windsor | 9.2% | 7.2%(+1.96)#54 | 4.9%(+4.32)#4,562 |
| 55. | Vergennes | 9.1% | 7.2%(+1.91)#55 | 4.9%(+4.27)#4,593 |
| 56. | Randolph | 9.1% | 7.2%(+1.91)#56 | 4.9%(+4.27)#4,594 |
| 57. | Whitingham | 9.1% | 7.2%(+1.86)#57 | 4.9%(+4.22)#4,679 |
| 58. | Norwich | 9.1% | 7.2%(+1.82)#58 | 4.9%(+4.18)#4,699 |
| 59. | St Albans | 8.9% | 7.2%(+1.71)#59 | 4.9%(+4.07)#4,778 |
| 60. | Burlington | 8.9% | 7.2%(+1.68)#60 | 4.9%(+4.04)#4,808 |
| 61. | Weston | 8.8% | 7.2%(+1.59)#61 | 4.9%(+3.95)#4,868 |
| 62. | Essex Junction | 8.5% | 7.2%(+1.23)#62 | 4.9%(+3.59)#5,161 |
| 63. | Pittsford | 8.2% | 7.2%(+0.954)#63 | 4.9%(+3.31)#5,474 |
| 64. | Richford | 7.6% | 7.2%(+0.325)#64 | 4.9%(+2.69)#6,151 |
| 65. | Proctorsville | 6.9% | 7.2%(-0.370)#65 | 4.9%(+1.99)#7,073 |
| 66. | Bennington | 6.8% | 7.2%(-0.460)#66 | 4.9%(+1.90)#7,192 |
| 67. | Shelburne | 6.8% | 7.2%(-0.469)#67 | 4.9%(+1.89)#7,205 |
| 68. | Waterbury | 6.7% | 7.2%(-0.505)#68 | 4.9%(+1.86)#7,252 |
| 69. | Poultney | 6.6% | 7.2%(-0.681)#69 | 4.9%(+1.68)#7,515 |
| 70. | Fair Haven | 6.5% | 7.2%(-0.772)#70 | 4.9%(+1.59)#7,646 |
| 71. | Killington | 5.8% | 7.2%(-1.39)#71 | 4.9%(+0.967)#8,704 |
| 72. | Wilder | 5.8% | 7.2%(-1.47)#72 | 4.9%(+0.895)#8,844 |
| 73. | Lyndonville | 5.7% | 7.2%(-1.55)#73 | 4.9%(+0.815)#9,004 |
| 74. | Wardsboro | 5.3% | 7.2%(-1.97)#74 | 4.9%(+0.391)#9,866 |
| 75. | Huntington | 5.0% | 7.2%(-2.28)#75 | 4.9%(+0.078)#10,520 |
| 76. | Jeffersonville | 4.9% | 7.2%(-2.38)#76 | 4.9%(-0.018)#10,756 |
| 77. | Waitsfield | 4.8% | 7.2%(-2.44)#77 | 4.9%(-0.082)#10,896 |
| 78. | Derby Line | 4.6% | 7.2%(-2.60)#78 | 4.9%(-0.243)#11,283 |
| 79. | Barre | 4.6% | 7.2%(-2.63)#79 | 4.9%(-0.270)#11,348 |
| 80. | Chelsea | 4.6% | 7.2%(-2.64)#80 | 4.9%(-0.274)#11,361 |
| 81. | Lincoln | 4.6% | 7.2%(-2.64)#81 | 4.9%(-0.274)#11,364 |
| 82. | Middletown Springs | 4.5% | 7.2%(-2.69)#82 | 4.9%(-0.327)#11,484 |
| 83. | Bakersfield | 4.4% | 7.2%(-2.86)#83 | 4.9%(-0.497)#11,855 |
| 84. | Winooski | 4.2% | 7.2%(-3.05)#84 | 4.9%(-0.694)#12,318 |
| 85. | Townshend | 4.1% | 7.2%(-3.18)#85 | 4.9%(-0.818)#12,608 |
| 86. | South Hero | 4.0% | 7.2%(-3.23)#86 | 4.9%(-0.872)#12,742 |
| 87. | Jericho | 3.9% | 7.2%(-3.37)#87 | 4.9%(-1.01)#13,041 |
| 88. | Swanton | 3.8% | 7.2%(-3.42)#88 | 4.9%(-1.06)#13,187 |
| 89. | South Burlington | 3.8% | 7.2%(-3.47)#89 | 4.9%(-1.11)#13,301 |
| 90. | St Johnsbury | 3.7% | 7.2%(-3.49)#90 | 4.9%(-1.13)#13,361 |
| 91. | South Royalton | 3.7% | 7.2%(-3.56)#91 | 4.9%(-1.20)#13,530 |
| 92. | Bradford | 3.7% | 7.2%(-3.56)#92 | 4.9%(-1.20)#13,537 |
| 93. | Hardwick | 3.7% | 7.2%(-3.57)#93 | 4.9%(-1.21)#13,575 |
| 94. | Stamford | 3.5% | 7.2%(-3.74)#94 | 4.9%(-1.38)#13,974 |
| 95. | Proctor | 3.4% | 7.2%(-3.78)#95 | 4.9%(-1.42)#14,074 |
| 96. | Saxtons River | 3.1% | 7.2%(-4.18)#96 | 4.9%(-1.81)#15,028 |
| 97. | Brandon | 3.0% | 7.2%(-4.21)#97 | 4.9%(-1.85)#15,130 |
| 98. | Morrisville | 2.9% | 7.2%(-4.32)#98 | 4.9%(-1.96)#15,351 |
| 99. | Arlington | 2.9% | 7.2%(-4.33)#99 | 4.9%(-1.97)#15,374 |
| 100. | West Brattleboro | 2.8% | 7.2%(-4.39)#100 | 4.9%(-2.02)#15,501 |
1
2Common Questions
What are the Top 10 Cities with the Highest Percentage of Population with a Degree in Liberal Arts and History in Vermont?
Top 10 Cities with the Highest Percentage of Population with a Degree in Liberal Arts and History in Vermont are:
#1
34.9%
#2
33.2%
#3
31.5%
#4
30.0%
#5
29.7%
#6
28.8%
#7
27.5%
#8
26.7%
#9
20.0%
#10
19.2%
What city has the Highest Percentage of Population with a Degree in Liberal Arts and History in Vermont?
East Montpelier has the Highest Percentage of Population with a Degree in Liberal Arts and History in Vermont with 34.9%.
What is the Percentage of Population with a Degree in Liberal Arts and History in the State of Vermont?
Percentage of Population with a Degree in Liberal Arts and History in Vermont is 7.2%.
What is the Percentage of Population with a Degree in Liberal Arts and History in the United States?
Percentage of Population with a Degree in Liberal Arts and History in the United States is 4.9%.