Kerman, CA Map & Demographics
Kerman Map
Kerman Overview
$21,308
PER CAPITA INCOME
$58,234
AVG FAMILY INCOME
$53,956
AVG HOUSEHOLD INCOME
33.8%
WAGE / INCOME GAP [ % ]
66.2¢/ $1
WAGE / INCOME GAP [ $ ]
$10,623
FAMILY INCOME DEFICIT
0.46
INEQUALITY / GINI INDEX
15,980
TOTAL POPULATION
7,891
MALE POPULATION
8,089
FEMALE POPULATION
97.55
MALES / 100 FEMALES
102.51
FEMALES / 100 MALES
27.8
MEDIAN AGE
4.0
AVG FAMILY SIZE
3.6
AVG HOUSEHOLD SIZE
6,912
LABOR FORCE [ PEOPLE ]
61.1%
PERCENT IN LABOR FORCE
12.8%
UNEMPLOYMENT RATE
Kerman Zip Codes
Kerman Area Codes
Income in Kerman
Income Overview in Kerman
Per Capita Income in Kerman is $21,308, while median incomes of families and households are $58,234 and $53,956 respectively.
| Characteristic | Number | Measure |
| Per Capita Income | 15,980 | $21,308 |
| Median Family Income | 3,385 | $58,234 |
| Mean Family Income | 3,385 | $75,765 |
| Median Household Income | 4,446 | $53,956 |
| Mean Household Income | 4,446 | $73,690 |
| Income Deficit | 3,385 | $10,623 |
| Wage / Income Gap (%) | 15,980 | 33.80% |
| Wage / Income Gap ($) | 15,980 | 66.20¢ per $1 |
| Gini / Inequality Index | 15,980 | 0.46 |
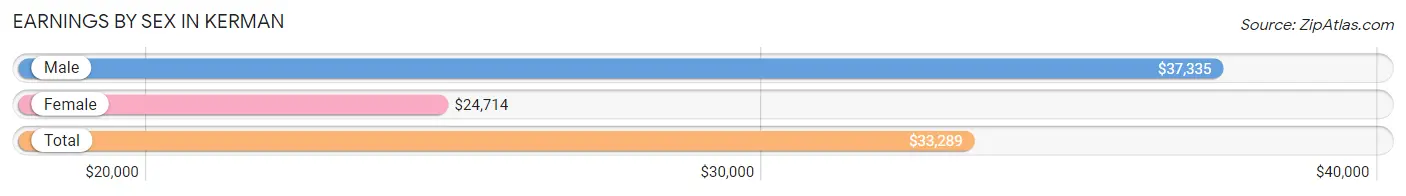
Earnings by Sex in Kerman
Average Earnings in Kerman are $33,289, $37,335 for men and $24,714 for women, a difference of 33.8%.
| Sex | Number | Average Earnings |
| Male | 3,835 (54.9%) | $37,335 |
| Female | 3,154 (45.1%) | $24,714 |
| Total | 6,989 (100.0%) | $33,289 |
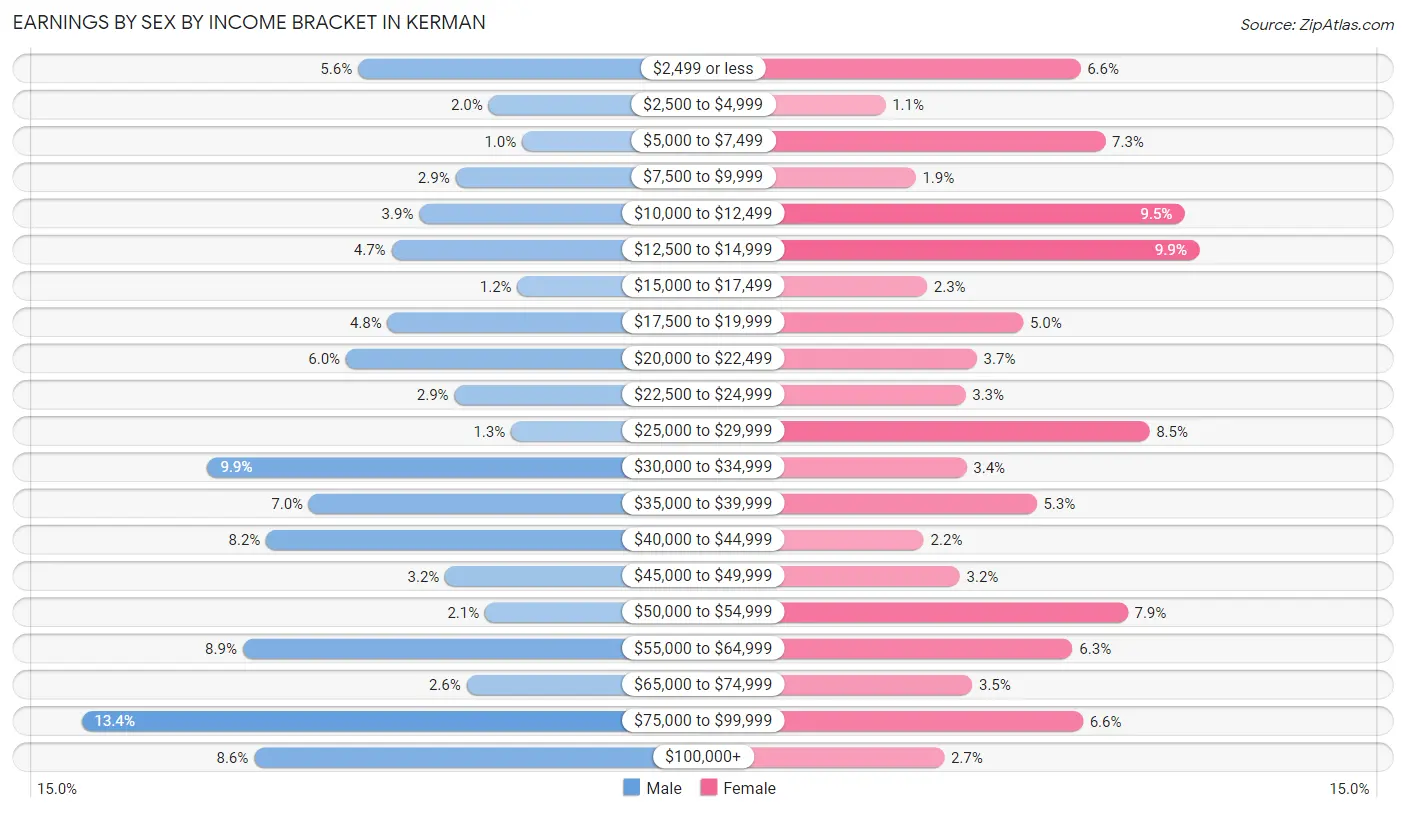
Earnings by Sex by Income Bracket in Kerman
The most common earnings brackets in Kerman are $75,000 to $99,999 for men (514 | 13.4%) and $12,500 to $14,999 for women (312 | 9.9%).
| Income | Male | Female |
| $2,499 or less | 216 (5.6%) | 207 (6.6%) |
| $2,500 to $4,999 | 75 (2.0%) | 34 (1.1%) |
| $5,000 to $7,499 | 39 (1.0%) | 229 (7.3%) |
| $7,500 to $9,999 | 111 (2.9%) | 61 (1.9%) |
| $10,000 to $12,499 | 150 (3.9%) | 299 (9.5%) |
| $12,500 to $14,999 | 180 (4.7%) | 312 (9.9%) |
| $15,000 to $17,499 | 44 (1.1%) | 71 (2.2%) |
| $17,500 to $19,999 | 184 (4.8%) | 156 (5.0%) |
| $20,000 to $22,499 | 229 (6.0%) | 115 (3.6%) |
| $22,500 to $24,999 | 112 (2.9%) | 105 (3.3%) |
| $25,000 to $29,999 | 51 (1.3%) | 268 (8.5%) |
| $30,000 to $34,999 | 378 (9.9%) | 106 (3.4%) |
| $35,000 to $39,999 | 269 (7.0%) | 168 (5.3%) |
| $40,000 to $44,999 | 315 (8.2%) | 68 (2.2%) |
| $45,000 to $49,999 | 122 (3.2%) | 100 (3.2%) |
| $50,000 to $54,999 | 79 (2.1%) | 249 (7.9%) |
| $55,000 to $64,999 | 340 (8.9%) | 200 (6.3%) |
| $65,000 to $74,999 | 99 (2.6%) | 111 (3.5%) |
| $75,000 to $99,999 | 514 (13.4%) | 209 (6.6%) |
| $100,000+ | 328 (8.6%) | 86 (2.7%) |
| Total | 3,835 (100.0%) | 3,154 (100.0%) |
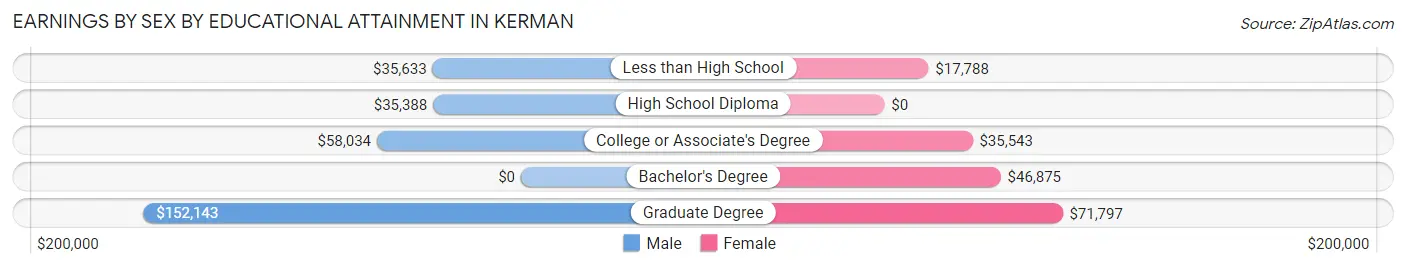
Earnings by Sex by Educational Attainment in Kerman
Average earnings in Kerman are $40,557 for men and $28,741 for women, a difference of 29.1%. Men with an educational attainment of graduate degree enjoy the highest average annual earnings of $152,143, while those with high school diploma education earn the least with $35,388. Women with an educational attainment of graduate degree earn the most with the average annual earnings of $71,797, while those with less than high school education have the smallest earnings of $17,788.
| Educational Attainment | Male Income | Female Income |
| Less than High School | $35,633 | $17,788 |
| High School Diploma | $35,388 | $0 |
| College or Associate's Degree | $58,034 | $35,543 |
| Bachelor's Degree | - | - |
| Graduate Degree | $152,143 | $71,797 |
| Total | $40,557 | $28,741 |
Family Income in Kerman
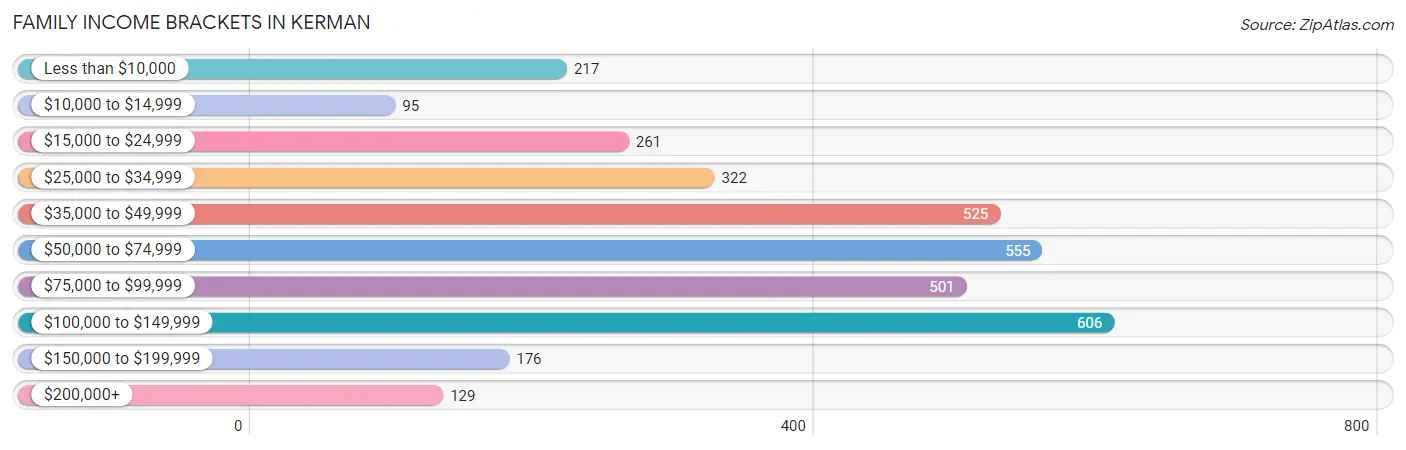
Family Income Brackets in Kerman
According to the Kerman family income data, there are 606 families falling into the $100,000 to $149,999 income range, which is the most common income bracket and makes up 17.9% of all families. Conversely, the $10,000 to $14,999 income bracket is the least frequent group with only 95 families (2.8%) belonging to this category.
| Income Bracket | # Families | % Families |
| Less than $10,000 | 217 | 6.4% |
| $10,000 to $14,999 | 95 | 2.8% |
| $15,000 to $24,999 | 261 | 7.7% |
| $25,000 to $34,999 | 322 | 9.5% |
| $35,000 to $49,999 | 525 | 15.5% |
| $50,000 to $74,999 | 555 | 16.4% |
| $75,000 to $99,999 | 501 | 14.8% |
| $100,000 to $149,999 | 606 | 17.9% |
| $150,000 to $199,999 | 176 | 5.2% |
| $200,000+ | 129 | 3.8% |
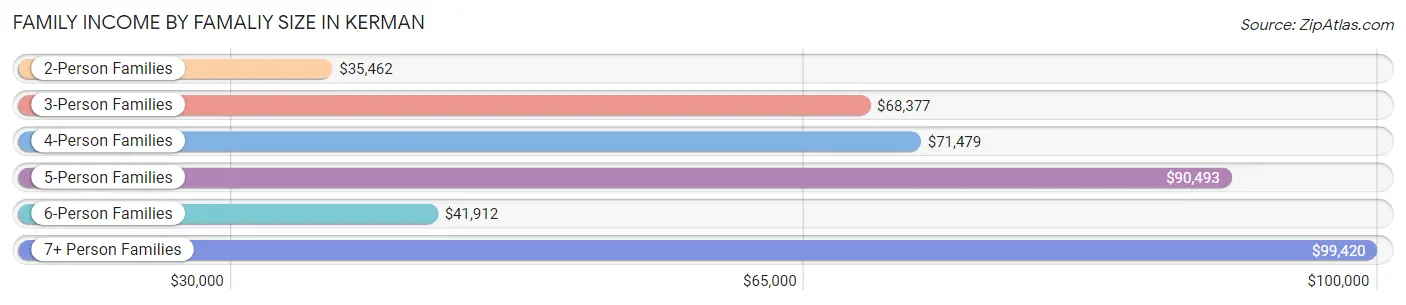
Family Income by Famaliy Size in Kerman
7+ person families (189 | 5.6%) account for the highest median family income in Kerman with $99,420 per family, while 3-person families (688 | 20.3%) have the highest median income of $22,792 per family member.
| Income Bracket | # Families | Median Income |
| 2-Person Families | 821 (24.2%) | $35,462 |
| 3-Person Families | 688 (20.3%) | $68,377 |
| 4-Person Families | 946 (28.0%) | $71,479 |
| 5-Person Families | 461 (13.6%) | $90,493 |
| 6-Person Families | 280 (8.3%) | $41,912 |
| 7+ Person Families | 189 (5.6%) | $99,420 |
| Total | 3,385 (100.0%) | $58,234 |
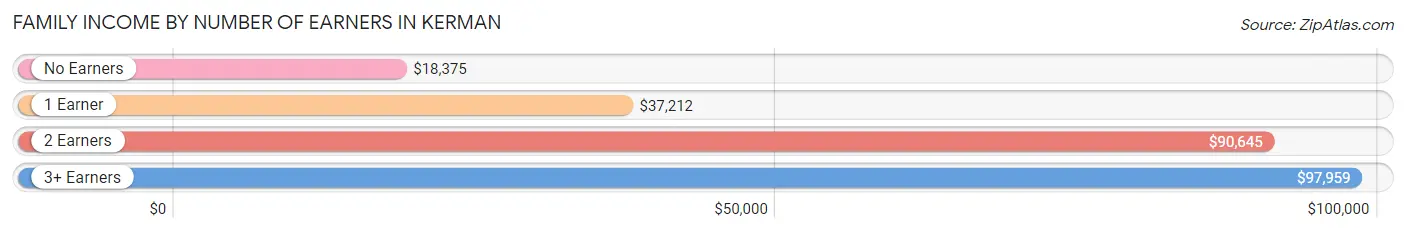
Family Income by Number of Earners in Kerman
The median family income in Kerman is $58,234, with families comprising 3+ earners (430) having the highest median family income of $97,959, while families with no earners (343) have the lowest median family income of $18,375, accounting for 12.7% and 10.1% of families, respectively.
| Number of Earners | # Families | Median Income |
| No Earners | 343 (10.1%) | $18,375 |
| 1 Earner | 1,387 (41.0%) | $37,212 |
| 2 Earners | 1,225 (36.2%) | $90,645 |
| 3+ Earners | 430 (12.7%) | $97,959 |
| Total | 3,385 (100.0%) | $58,234 |
Household Income in Kerman
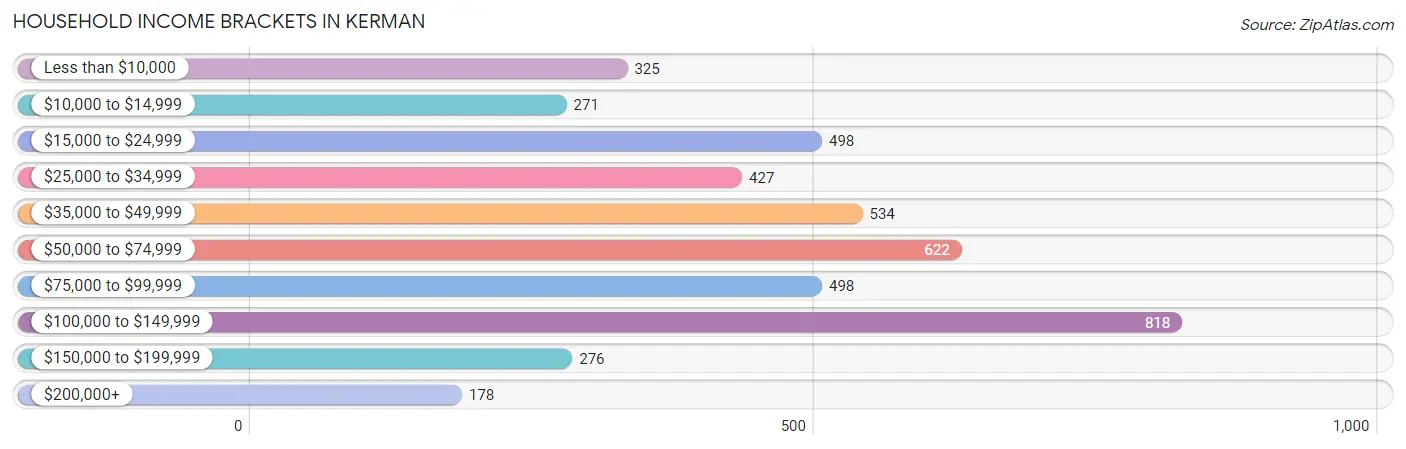
Household Income Brackets in Kerman
With 818 households falling in the category, the $100,000 to $149,999 income range is the most frequent in Kerman, accounting for 18.4% of all households. In contrast, only 178 households (4.0%) fall into the $200,000+ income bracket, making it the least populous group.
| Income Bracket | # Households | % Households |
| Less than $10,000 | 325 | 7.3% |
| $10,000 to $14,999 | 271 | 6.1% |
| $15,000 to $24,999 | 498 | 11.2% |
| $25,000 to $34,999 | 427 | 9.6% |
| $35,000 to $49,999 | 534 | 12.0% |
| $50,000 to $74,999 | 622 | 14.0% |
| $75,000 to $99,999 | 498 | 11.2% |
| $100,000 to $149,999 | 818 | 18.4% |
| $150,000 to $199,999 | 276 | 6.2% |
| $200,000+ | 178 | 4.0% |
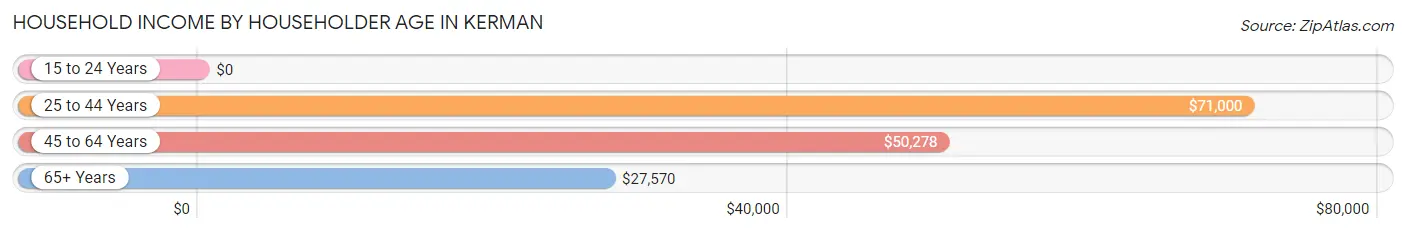
Household Income by Householder Age in Kerman
The median household income in Kerman is $53,956, with the highest median household income of $71,000 found in the 25 to 44 years age bracket for the primary householder. A total of 1,714 households (38.6%) fall into this category. Meanwhile, the 15 to 24 years age bracket for the primary householder has the lowest median household income of $0, with 194 households (4.4%) in this group.
| Income Bracket | # Households | Median Income |
| 15 to 24 Years | 194 (4.4%) | $0 |
| 25 to 44 Years | 1,714 (38.6%) | $71,000 |
| 45 to 64 Years | 1,800 (40.5%) | $50,278 |
| 65+ Years | 738 (16.6%) | $27,570 |
| Total | 4,446 (100.0%) | $53,956 |
Poverty in Kerman
Income Below Poverty by Sex and Age in Kerman
With 19.6% poverty level for males and 24.2% for females among the residents of Kerman, 5 year old males and 15 year old females are the most vulnerable to poverty, with 86 males (45.0%) and 82 females (70.7%) in their respective age groups living below the poverty level.
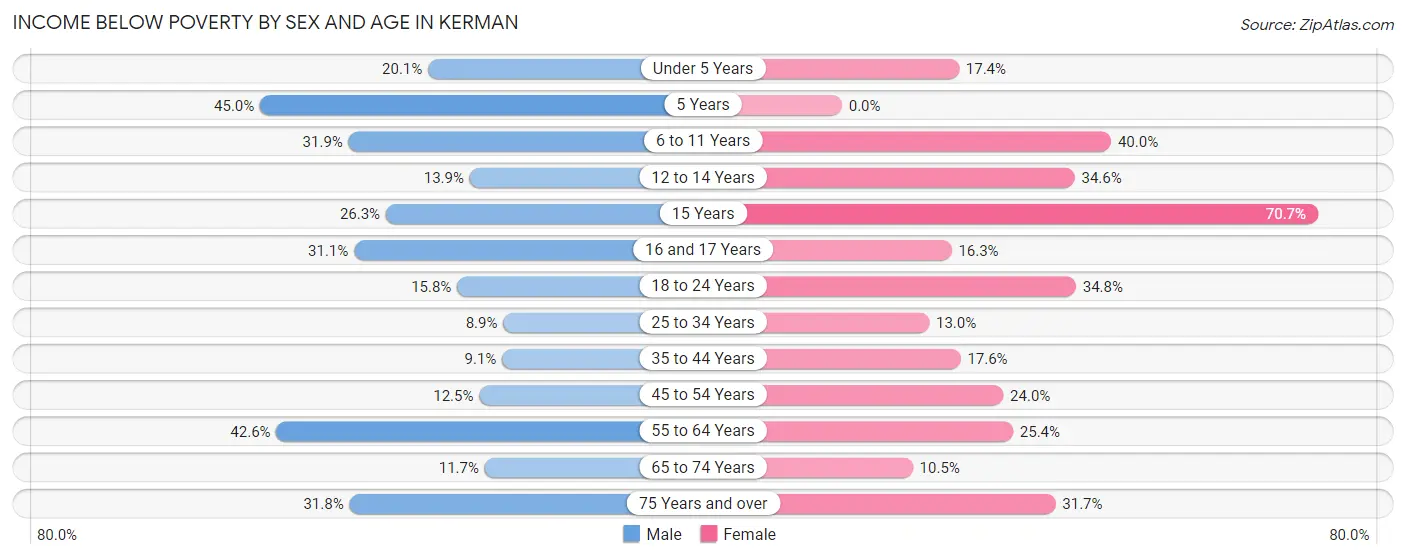
| Age Bracket | Male | Female |
| Under 5 Years | 99 (20.1%) | 114 (17.4%) |
| 5 Years | 86 (45.0%) | 0 (0.0%) |
| 6 to 11 Years | 256 (31.9%) | 307 (40.0%) |
| 12 to 14 Years | 70 (13.9%) | 169 (34.6%) |
| 15 Years | 54 (26.3%) | 82 (70.7%) |
| 16 and 17 Years | 64 (31.1%) | 63 (16.3%) |
| 18 to 24 Years | 139 (15.8%) | 318 (34.7%) |
| 25 to 34 Years | 97 (8.9%) | 150 (13.0%) |
| 35 to 44 Years | 110 (9.1%) | 160 (17.6%) |
| 45 to 54 Years | 98 (12.5%) | 265 (24.0%) |
| 55 to 64 Years | 349 (42.6%) | 159 (25.4%) |
| 65 to 74 Years | 47 (11.7%) | 53 (10.5%) |
| 75 Years and over | 47 (31.8%) | 52 (31.7%) |
| Total | 1,516 (19.6%) | 1,892 (24.2%) |
Income Above Poverty by Sex and Age in Kerman
According to the poverty statistics in Kerman, males aged 25 to 34 years and females aged 5 years are the age groups that are most secure financially, with 91.1% of males and 100.0% of females in these age groups living above the poverty line.
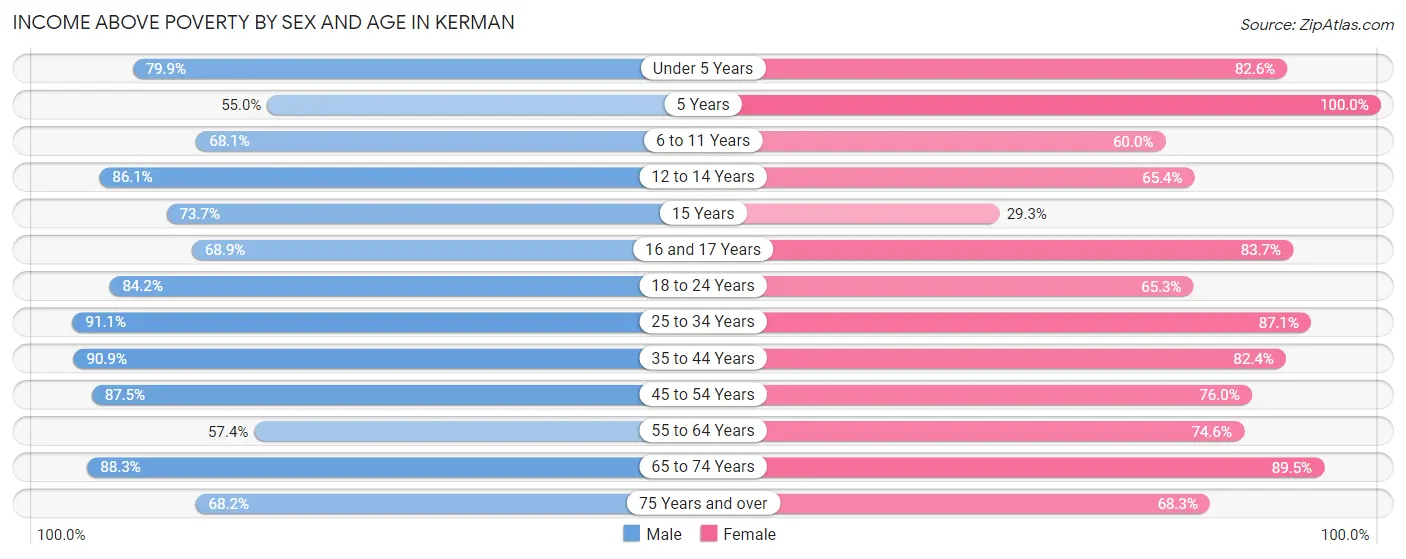
| Age Bracket | Male | Female |
| Under 5 Years | 394 (79.9%) | 542 (82.6%) |
| 5 Years | 105 (55.0%) | 28 (100.0%) |
| 6 to 11 Years | 547 (68.1%) | 461 (60.0%) |
| 12 to 14 Years | 434 (86.1%) | 320 (65.4%) |
| 15 Years | 151 (73.7%) | 34 (29.3%) |
| 16 and 17 Years | 142 (68.9%) | 324 (83.7%) |
| 18 to 24 Years | 743 (84.2%) | 597 (65.2%) |
| 25 to 34 Years | 991 (91.1%) | 1,008 (87.1%) |
| 35 to 44 Years | 1,102 (90.9%) | 748 (82.4%) |
| 45 to 54 Years | 687 (87.5%) | 841 (76.0%) |
| 55 to 64 Years | 470 (57.4%) | 467 (74.6%) |
| 65 to 74 Years | 356 (88.3%) | 451 (89.5%) |
| 75 Years and over | 101 (68.2%) | 112 (68.3%) |
| Total | 6,223 (80.4%) | 5,933 (75.8%) |
Income Below Poverty Among Married-Couple Families in Kerman
The poverty statistics for married-couple families in Kerman show that 16.9% or 369 of the total 2,178 families live below the poverty line. Families with 5 or more children have the highest poverty rate of 88.3%, comprising of 53 families. On the other hand, families with 1 or 2 children have the lowest poverty rate of 5.2%, which includes 56 families.
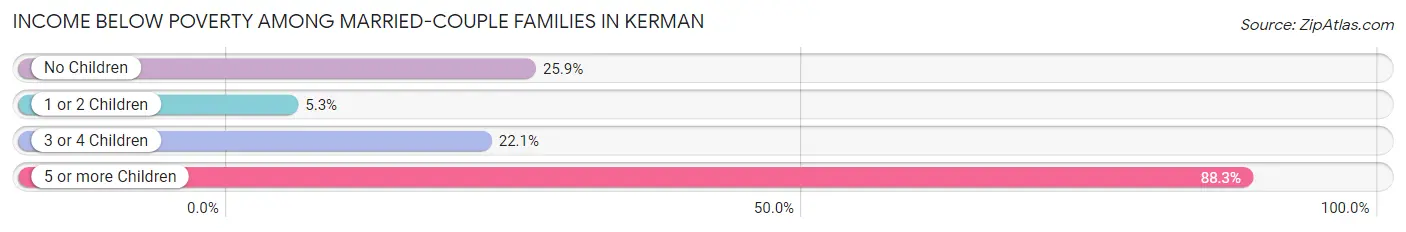
| Children | Above Poverty | Below Poverty |
| No Children | 531 (74.1%) | 186 (25.9%) |
| 1 or 2 Children | 1,010 (94.8%) | 56 (5.2%) |
| 3 or 4 Children | 261 (77.9%) | 74 (22.1%) |
| 5 or more Children | 7 (11.7%) | 53 (88.3%) |
| Total | 1,809 (83.1%) | 369 (16.9%) |
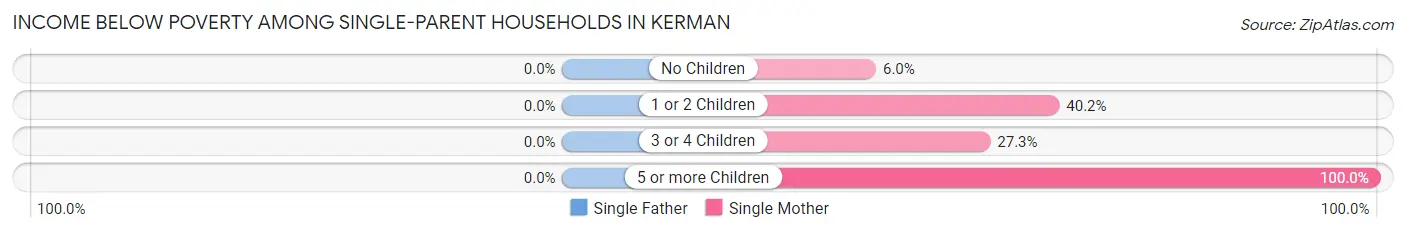
Income Below Poverty Among Single-Parent Households in Kerman
| Children | Single Father | Single Mother |
| No Children | 0 (0.0%) | 14 (6.0%) |
| 1 or 2 Children | 0 (0.0%) | 221 (40.2%) |
| 3 or 4 Children | 0 (0.0%) | 50 (27.3%) |
| 5 or more Children | 0 (0.0%) | 36 (100.0%) |
| Total | 0 (0.0%) | 321 (32.1%) |
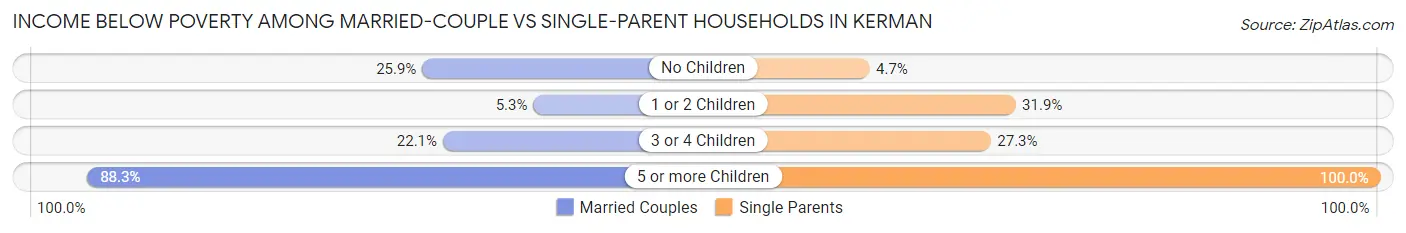
Income Below Poverty Among Married-Couple vs Single-Parent Households in Kerman
The poverty data for Kerman shows that 369 of the married-couple family households (16.9%) and 321 of the single-parent households (26.6%) are living below the poverty level. Within the married-couple family households, those with 5 or more children have the highest poverty rate, with 53 households (88.3%) falling below the poverty line. Among the single-parent households, those with 5 or more children have the highest poverty rate, with 36 household (100.0%) living below poverty.
| Children | Married-Couple Families | Single-Parent Households |
| No Children | 186 (25.9%) | 14 (4.7%) |
| 1 or 2 Children | 56 (5.2%) | 221 (31.9%) |
| 3 or 4 Children | 74 (22.1%) | 50 (27.3%) |
| 5 or more Children | 53 (88.3%) | 36 (100.0%) |
| Total | 369 (16.9%) | 321 (26.6%) |
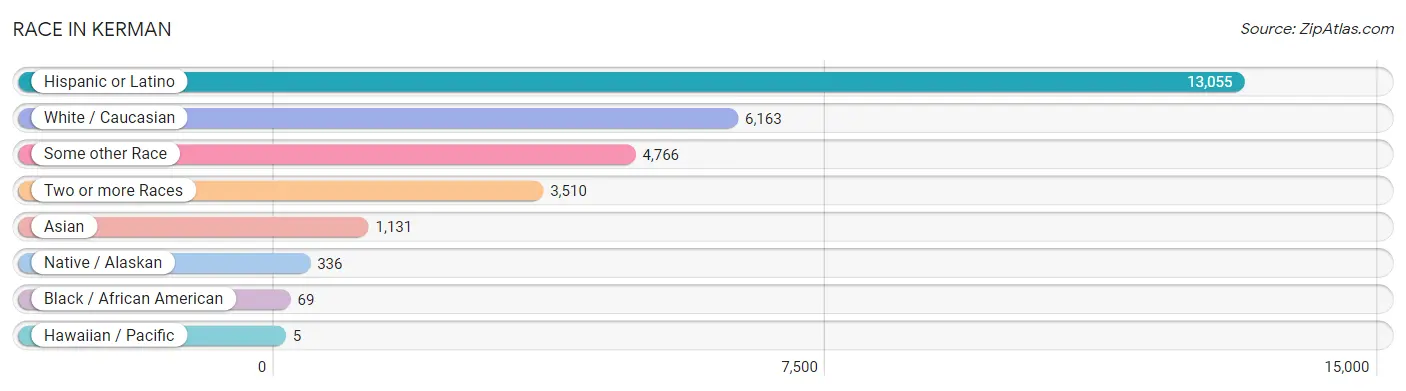
Race in Kerman
The most populous races in Kerman are Hispanic or Latino (13,055 | 81.7%), White / Caucasian (6,163 | 38.6%), and Some other Race (4,766 | 29.8%).
| Race | # Population | % Population |
| Asian | 1,131 | 7.1% |
| Black / African American | 69 | 0.4% |
| Hawaiian / Pacific | 5 | 0.0% |
| Hispanic or Latino | 13,055 | 81.7% |
| Native / Alaskan | 336 | 2.1% |
| White / Caucasian | 6,163 | 38.6% |
| Two or more Races | 3,510 | 22.0% |
| Some other Race | 4,766 | 29.8% |
| Total | 15,980 | 100.0% |
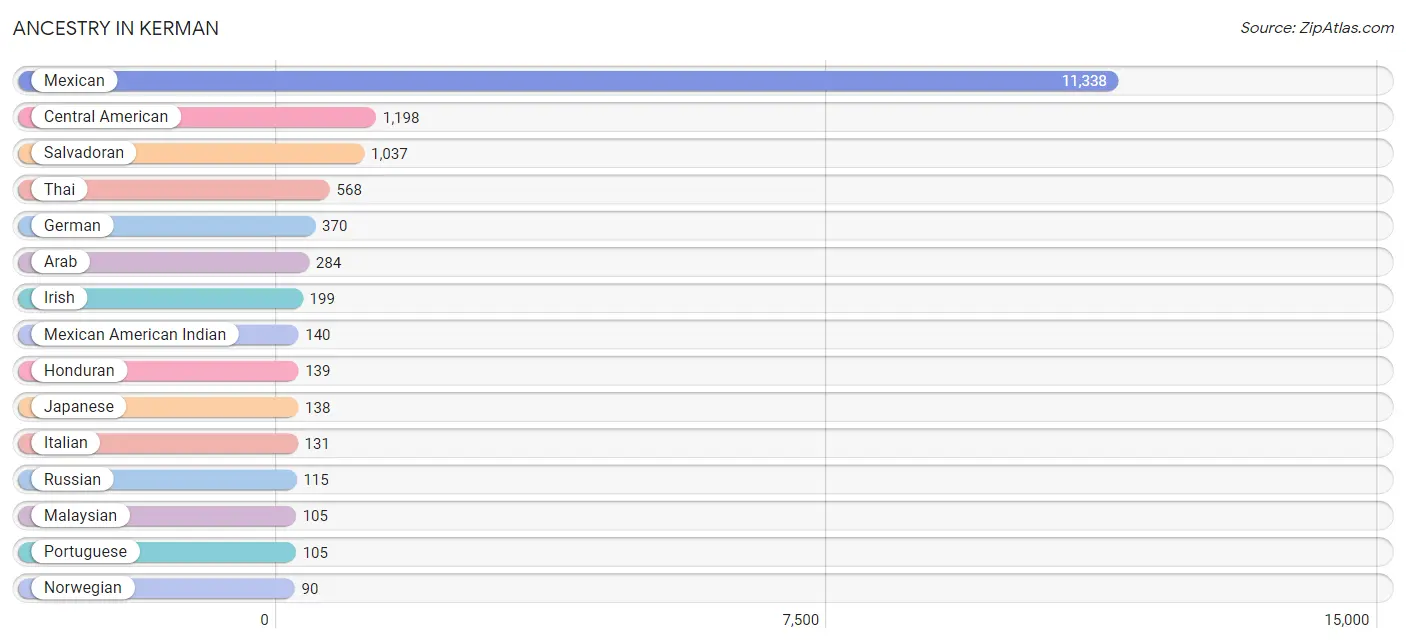
Ancestry in Kerman
The most populous ancestries reported in Kerman are Mexican (11,338 | 71.0%), Central American (1,198 | 7.5%), Salvadoran (1,037 | 6.5%), Thai (568 | 3.5%), and German (370 | 2.3%), together accounting for 90.8% of all Kerman residents.
| Ancestry | # Population | % Population |
| African | 1 | 0.0% |
| American | 51 | 0.3% |
| Arab | 284 | 1.8% |
| Armenian | 44 | 0.3% |
| Austrian | 69 | 0.4% |
| Basque | 83 | 0.5% |
| Blackfeet | 1 | 0.0% |
| British | 15 | 0.1% |
| Central American | 1,198 | 7.5% |
| Cherokee | 15 | 0.1% |
| Chippewa | 15 | 0.1% |
| Colombian | 36 | 0.2% |
| Croatian | 7 | 0.0% |
| Danish | 23 | 0.1% |
| Dominican | 1 | 0.0% |
| Dutch | 77 | 0.5% |
| English | 84 | 0.5% |
| French | 40 | 0.3% |
| German | 370 | 2.3% |
| Honduran | 139 | 0.9% |
| Indian (Asian) | 44 | 0.3% |
| Irish | 199 | 1.3% |
| Italian | 131 | 0.8% |
| Japanese | 138 | 0.9% |
| Korean | 53 | 0.3% |
| Malaysian | 105 | 0.7% |
| Mexican | 11,338 | 71.0% |
| Mexican American Indian | 140 | 0.9% |
| Native Hawaiian | 5 | 0.0% |
| Navajo | 18 | 0.1% |
| Nicaraguan | 15 | 0.1% |
| Norwegian | 90 | 0.6% |
| Panamanian | 7 | 0.0% |
| Portuguese | 105 | 0.7% |
| Puerto Rican | 5 | 0.0% |
| Russian | 115 | 0.7% |
| Salvadoran | 1,037 | 6.5% |
| Scotch-Irish | 9 | 0.1% |
| Scottish | 2 | 0.0% |
| South American | 36 | 0.2% |
| Spaniard | 71 | 0.4% |
| Subsaharan African | 1 | 0.0% |
| Swedish | 3 | 0.0% |
| Thai | 568 | 3.5% |
| West Indian | 1 | 0.0% | View All 45 Rows |
Immigrants in Kerman
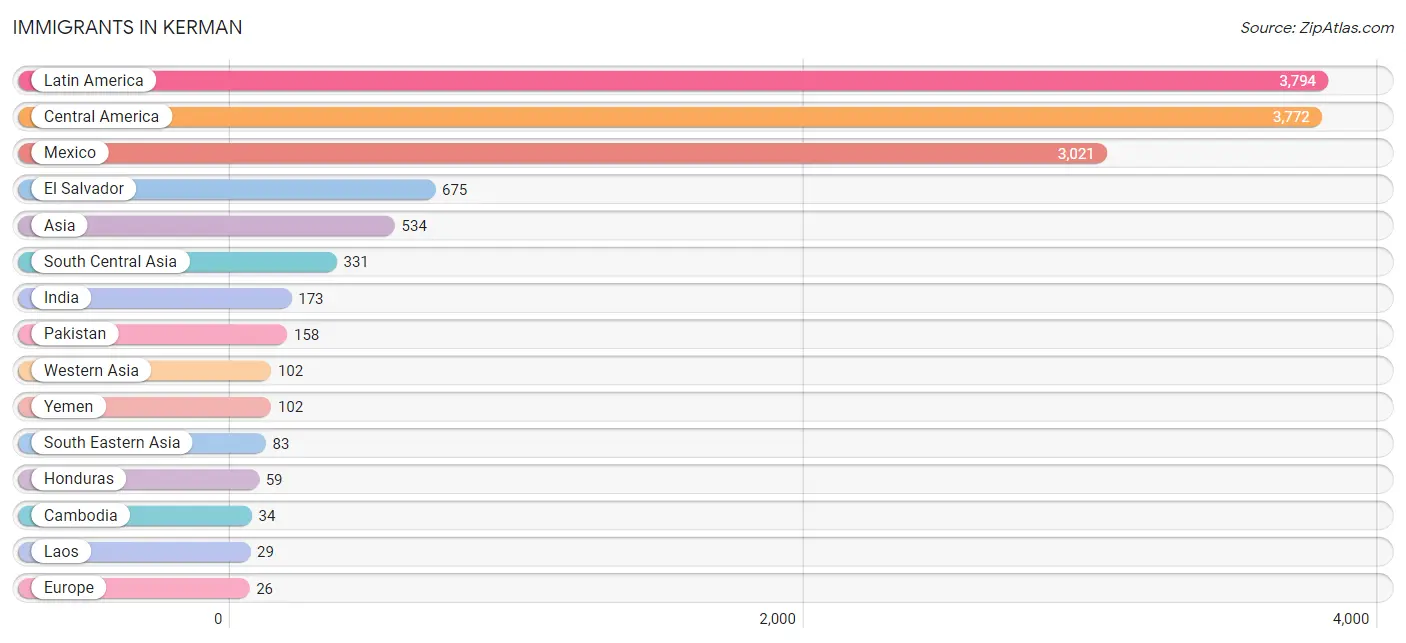
The most numerous immigrant groups reported in Kerman came from Latin America (3,794 | 23.7%), Central America (3,772 | 23.6%), Mexico (3,021 | 18.9%), El Salvador (675 | 4.2%), and Asia (534 | 3.3%), together accounting for 73.8% of all Kerman residents.
| Immigration Origin | # Population | % Population |
| Africa | 1 | 0.0% |
| Asia | 534 | 3.3% |
| Cambodia | 34 | 0.2% |
| Central America | 3,772 | 23.6% |
| Colombia | 22 | 0.1% |
| Eastern Africa | 1 | 0.0% |
| El Salvador | 675 | 4.2% |
| Europe | 26 | 0.2% |
| Honduras | 59 | 0.4% |
| India | 173 | 1.1% |
| Laos | 29 | 0.2% |
| Latin America | 3,794 | 23.7% |
| Mexico | 3,021 | 18.9% |
| Nicaragua | 17 | 0.1% |
| Northern Europe | 3 | 0.0% |
| Pakistan | 158 | 1.0% |
| Philippines | 20 | 0.1% |
| South America | 22 | 0.1% |
| South Central Asia | 331 | 2.1% |
| South Eastern Asia | 83 | 0.5% |
| Southern Europe | 23 | 0.1% |
| Spain | 23 | 0.1% |
| Uganda | 1 | 0.0% |
| Western Asia | 102 | 0.6% |
| Yemen | 102 | 0.6% | View All 25 Rows |
Sex and Age in Kerman
Sex and Age in Kerman
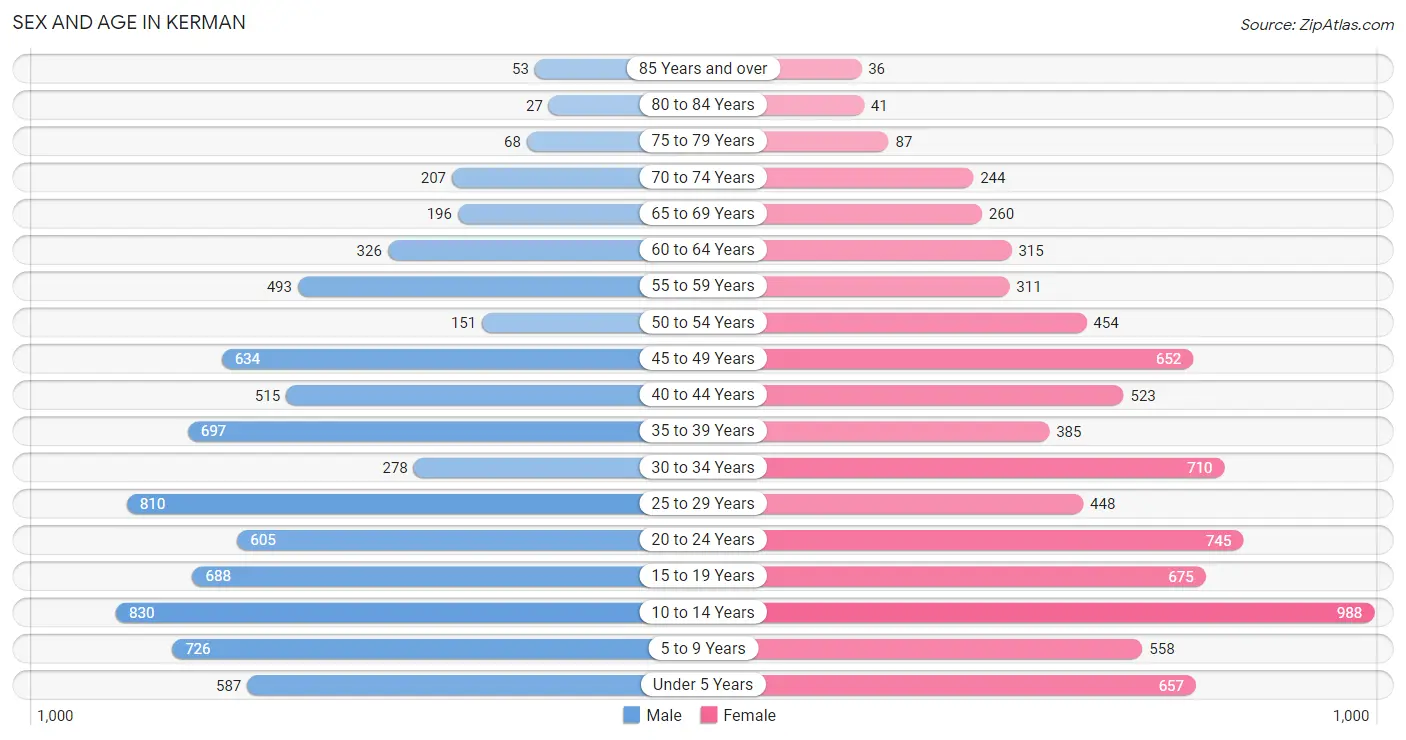
The most populous age groups in Kerman are 10 to 14 Years (830 | 10.5%) for men and 10 to 14 Years (988 | 12.2%) for women.
| Age Bracket | Male | Female |
| Under 5 Years | 587 (7.4%) | 657 (8.1%) |
| 5 to 9 Years | 726 (9.2%) | 558 (6.9%) |
| 10 to 14 Years | 830 (10.5%) | 988 (12.2%) |
| 15 to 19 Years | 688 (8.7%) | 675 (8.3%) |
| 20 to 24 Years | 605 (7.7%) | 745 (9.2%) |
| 25 to 29 Years | 810 (10.3%) | 448 (5.5%) |
| 30 to 34 Years | 278 (3.5%) | 710 (8.8%) |
| 35 to 39 Years | 697 (8.8%) | 385 (4.8%) |
| 40 to 44 Years | 515 (6.5%) | 523 (6.5%) |
| 45 to 49 Years | 634 (8.0%) | 652 (8.1%) |
| 50 to 54 Years | 151 (1.9%) | 454 (5.6%) |
| 55 to 59 Years | 493 (6.2%) | 311 (3.8%) |
| 60 to 64 Years | 326 (4.1%) | 315 (3.9%) |
| 65 to 69 Years | 196 (2.5%) | 260 (3.2%) |
| 70 to 74 Years | 207 (2.6%) | 244 (3.0%) |
| 75 to 79 Years | 68 (0.9%) | 87 (1.1%) |
| 80 to 84 Years | 27 (0.3%) | 41 (0.5%) |
| 85 Years and over | 53 (0.7%) | 36 (0.4%) |
| Total | 7,891 (100.0%) | 8,089 (100.0%) |
Families and Households in Kerman
Median Family Size in Kerman
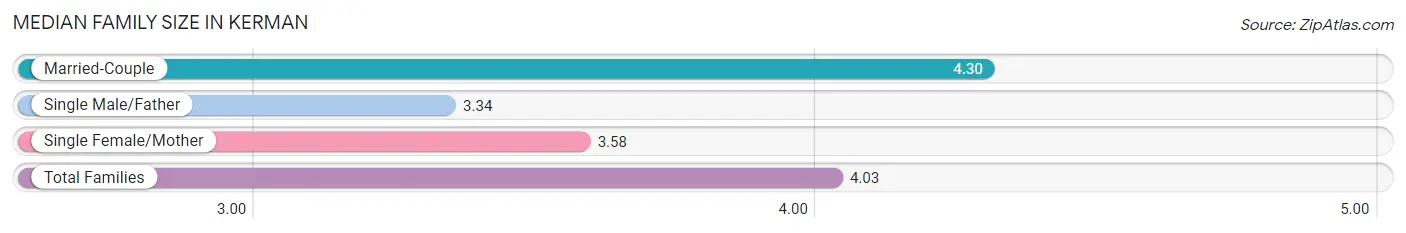
The median family size in Kerman is 4.03 persons per family, with married-couple families (2,178 | 64.3%) accounting for the largest median family size of 4.3 persons per family. On the other hand, single male/father families (206 | 6.1%) represent the smallest median family size with 3.34 persons per family.
| Family Type | # Families | Family Size |
| Married-Couple | 2,178 (64.3%) | 4.30 |
| Single Male/Father | 206 (6.1%) | 3.34 |
| Single Female/Mother | 1,001 (29.6%) | 3.58 |
| Total Families | 3,385 (100.0%) | 4.03 |
Median Household Size in Kerman
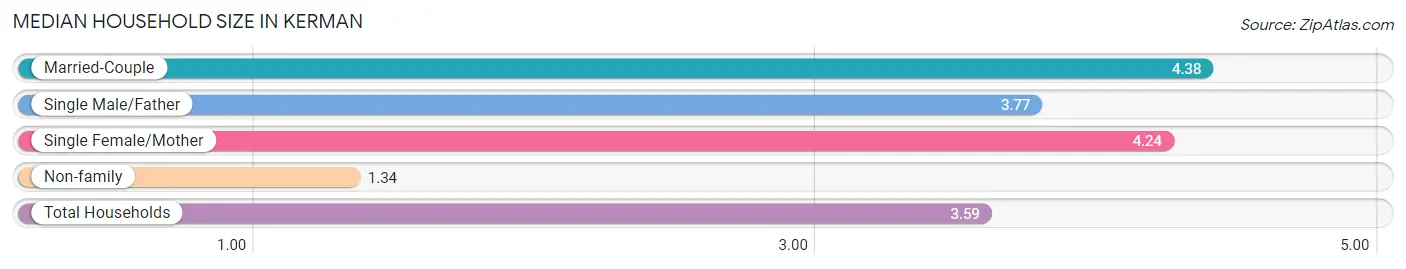
The median household size in Kerman is 3.59 persons per household, with married-couple households (2,178 | 49.0%) accounting for the largest median household size of 4.38 persons per household. non-family households (1,061 | 23.9%) represent the smallest median household size with 1.34 persons per household.
| Household Type | # Households | Household Size |
| Married-Couple | 2,178 (49.0%) | 4.38 |
| Single Male/Father | 206 (4.6%) | 3.77 |
| Single Female/Mother | 1,001 (22.5%) | 4.24 |
| Non-family | 1,061 (23.9%) | 1.34 |
| Total Households | 4,446 (100.0%) | 3.59 |
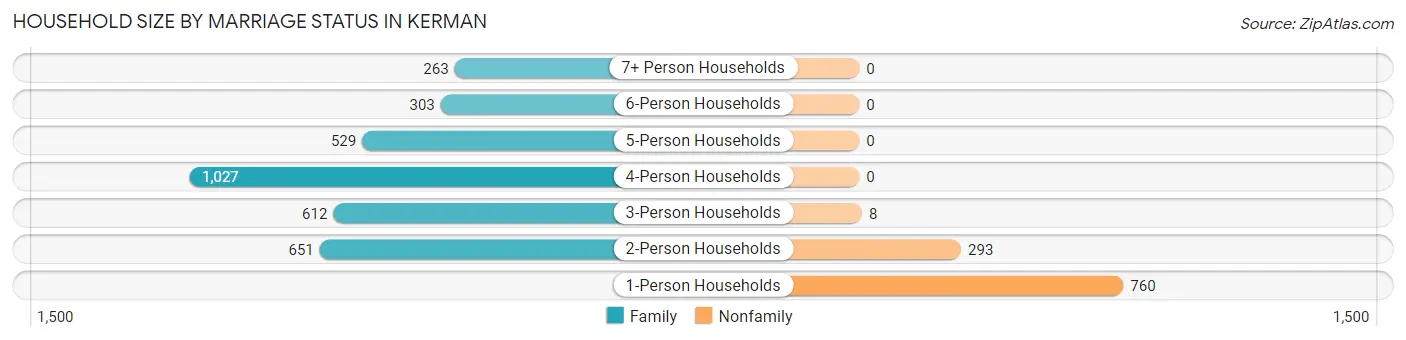
Household Size by Marriage Status in Kerman
Out of a total of 4,446 households in Kerman, 3,385 (76.1%) are family households, while 1,061 (23.9%) are nonfamily households. The most numerous type of family households are 4-person households, comprising 1,027, and the most common type of nonfamily households are 1-person households, comprising 760.
| Household Size | Family Households | Nonfamily Households |
| 1-Person Households | - | 760 (17.1%) |
| 2-Person Households | 651 (14.6%) | 293 (6.6%) |
| 3-Person Households | 612 (13.8%) | 8 (0.2%) |
| 4-Person Households | 1,027 (23.1%) | 0 (0.0%) |
| 5-Person Households | 529 (11.9%) | 0 (0.0%) |
| 6-Person Households | 303 (6.8%) | 0 (0.0%) |
| 7+ Person Households | 263 (5.9%) | 0 (0.0%) |
| Total | 3,385 (76.1%) | 1,061 (23.9%) |
Female Fertility in Kerman
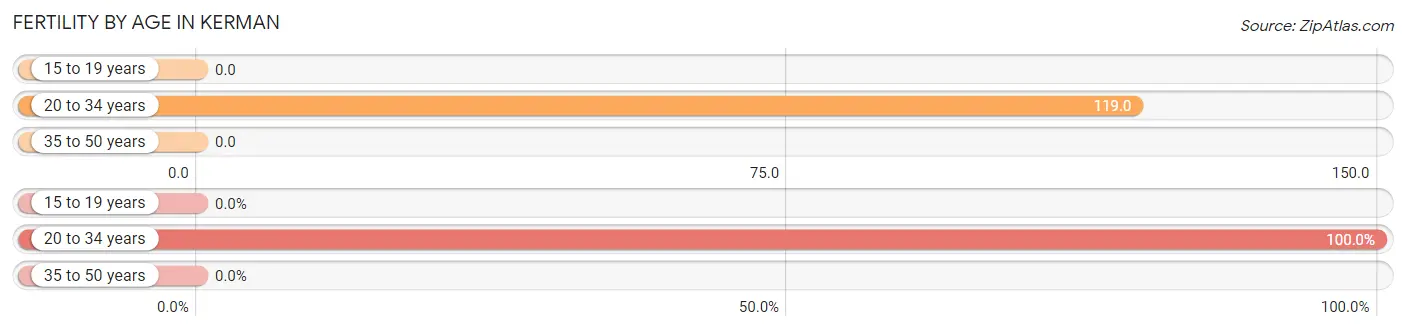
Fertility by Age in Kerman
Average fertility rate in Kerman is 54.0 births per 1,000 women. Women in the age bracket of 20 to 34 years have the highest fertility rate with 119.0 births per 1,000 women. Women in the age bracket of 20 to 34 years acount for 100.0% of all women with births.
| Age Bracket | Women with Births | Births / 1,000 Women |
| 15 to 19 years | 0 (0.0%) | 0.0 |
| 20 to 34 years | 226 (100.0%) | 119.0 |
| 35 to 50 years | 0 (0.0%) | 0.0 |
| Total | 226 (100.0%) | 54.0 |
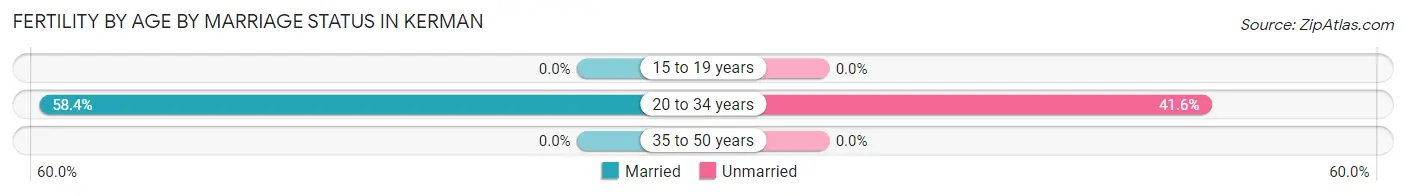
Fertility by Age by Marriage Status in Kerman
58.4% of women with births (226) in Kerman are married. The highest percentage of unmarried women with births falls into 20 to 34 years age bracket with 41.6% of them unmarried at the time of birth, while the lowest percentage of unmarried women with births belong to 20 to 34 years age bracket with 41.6% of them unmarried.
| Age Bracket | Married | Unmarried |
| 15 to 19 years | 0 (0.0%) | 0 (0.0%) |
| 20 to 34 years | 132 (58.4%) | 94 (41.6%) |
| 35 to 50 years | 0 (0.0%) | 0 (0.0%) |
| Total | 132 (58.4%) | 94 (41.6%) |
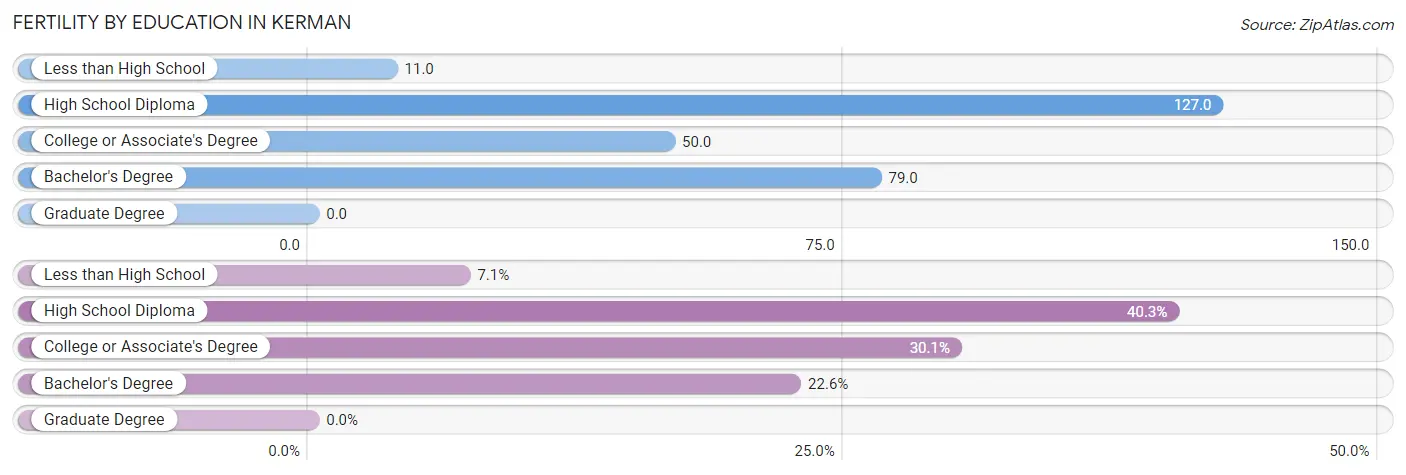
Fertility by Education in Kerman
| Educational Attainment | Women with Births | Births / 1,000 Women |
| Less than High School | 16 (7.1%) | 11.0 |
| High School Diploma | 91 (40.3%) | 127.0 |
| College or Associate's Degree | 68 (30.1%) | 50.0 |
| Bachelor's Degree | 51 (22.6%) | 79.0 |
| Graduate Degree | 0 (0.0%) | 0.0 |
| Total | 226 (100.0%) | 54.0 |
Fertility by Education by Marriage Status in Kerman
41.6% of women with births in Kerman are unmarried. Women with the educational attainment of less than high school are most likely to be married with 100.0% of them married at childbirth, while women with the educational attainment of college or associate's degree are least likely to be married with 75.0% of them unmarried at childbirth.
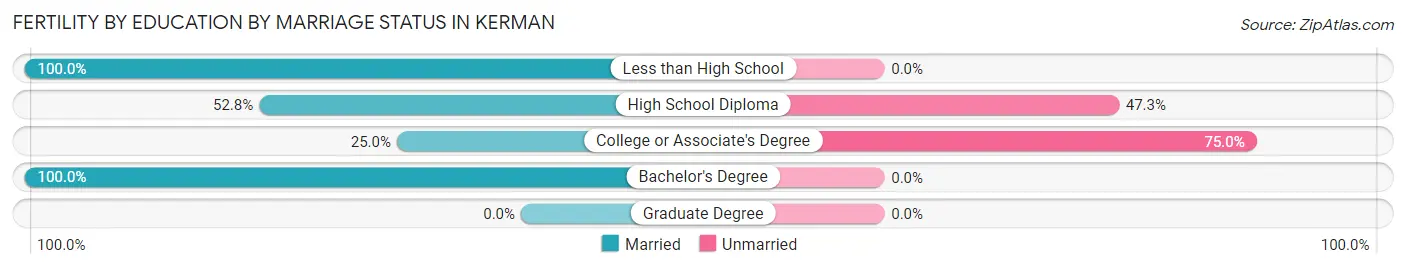
| Educational Attainment | Married | Unmarried |
| Less than High School | 16 (100.0%) | 0 (0.0%) |
| High School Diploma | 48 (52.7%) | 43 (47.2%) |
| College or Associate's Degree | 17 (25.0%) | 51 (75.0%) |
| Bachelor's Degree | 51 (100.0%) | 0 (0.0%) |
| Graduate Degree | 0 (0.0%) | 0 (0.0%) |
| Total | 132 (58.4%) | 94 (41.6%) |
Employment Characteristics in Kerman
Employment by Class of Employer in Kerman
Among the 5,851 employed individuals in Kerman, private company employees (4,348 | 74.3%), local government employees (532 | 9.1%), and self-employed (not incorporated) (322 | 5.5%) make up the most common classes of employment.
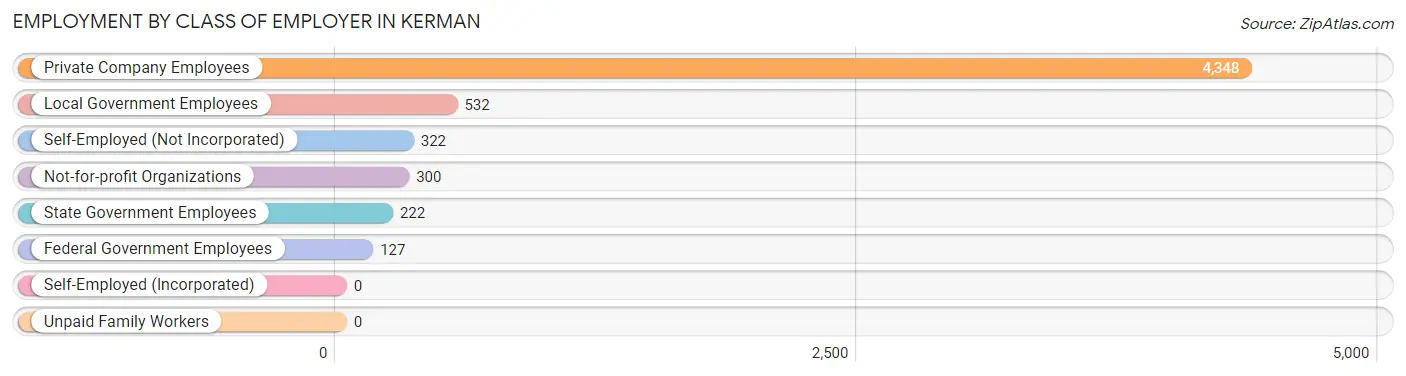
| Employer Class | # Employees | % Employees |
| Private Company Employees | 4,348 | 74.3% |
| Self-Employed (Incorporated) | 0 | 0.0% |
| Self-Employed (Not Incorporated) | 322 | 5.5% |
| Not-for-profit Organizations | 300 | 5.1% |
| Local Government Employees | 532 | 9.1% |
| State Government Employees | 222 | 3.8% |
| Federal Government Employees | 127 | 2.2% |
| Unpaid Family Workers | 0 | 0.0% |
| Total | 5,851 | 100.0% |
Employment Status by Age in Kerman
According to the labor force statistics for Kerman, out of the total population over 16 years of age (11,313), 61.1% or 6,912 individuals are in the labor force, with 12.8% or 885 of them unemployed. The age group with the highest labor force participation rate is 35 to 44 years, with 91.8% or 1,946 individuals in the labor force. Within the labor force, the 16 to 19 years age range has the highest percentage of unemployed individuals, with 27.0% or 66 of them being unemployed.
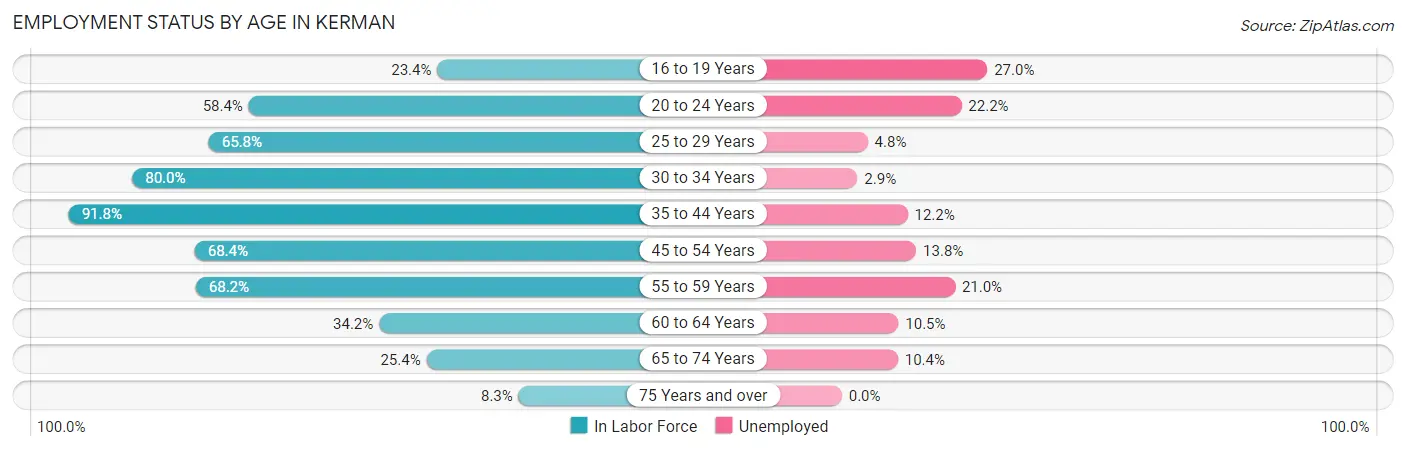
| Age Bracket | In Labor Force | Unemployed |
| 16 to 19 Years | 244 (23.4%) | 66 (27.0%) |
| 20 to 24 Years | 788 (58.4%) | 175 (22.2%) |
| 25 to 29 Years | 828 (65.8%) | 40 (4.8%) |
| 30 to 34 Years | 790 (80.0%) | 23 (2.9%) |
| 35 to 44 Years | 1,946 (91.8%) | 237 (12.2%) |
| 45 to 54 Years | 1,293 (68.4%) | 178 (13.8%) |
| 55 to 59 Years | 548 (68.2%) | 115 (21.0%) |
| 60 to 64 Years | 219 (34.2%) | 23 (10.5%) |
| 65 to 74 Years | 230 (25.4%) | 24 (10.4%) |
| 75 Years and over | 26 (8.3%) | 0 (0.0%) |
| Total | 6,912 (61.1%) | 885 (12.8%) |
Employment Status by Educational Attainment in Kerman
According to labor force statistics for Kerman, 73.0% of individuals (5,622) out of the total population between 25 and 64 years of age (7,702) are in the labor force, with 11.0% or 618 of them being unemployed. The group with the highest labor force participation rate are those with the educational attainment of bachelor's degree or higher, with 86.5% or 939 individuals in the labor force. Within the labor force, individuals with less than high school education have the highest percentage of unemployment, with 14.4% or 313 of them being unemployed.
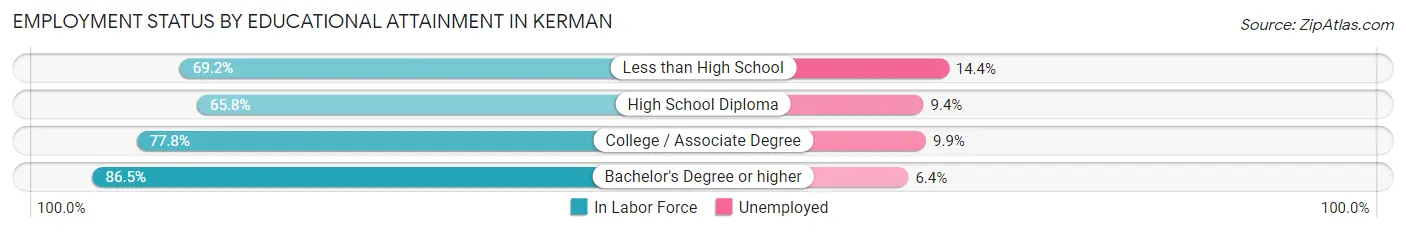
| Educational Attainment | In Labor Force | Unemployed |
| Less than High School | 2,177 (69.2%) | 453 (14.4%) |
| High School Diploma | 1,042 (65.8%) | 149 (9.4%) |
| College / Associate Degree | 1,469 (77.8%) | 187 (9.9%) |
| Bachelor's Degree or higher | 939 (86.5%) | 69 (6.4%) |
| Total | 5,622 (73.0%) | 847 (11.0%) |
Employment Occupations by Sex in Kerman
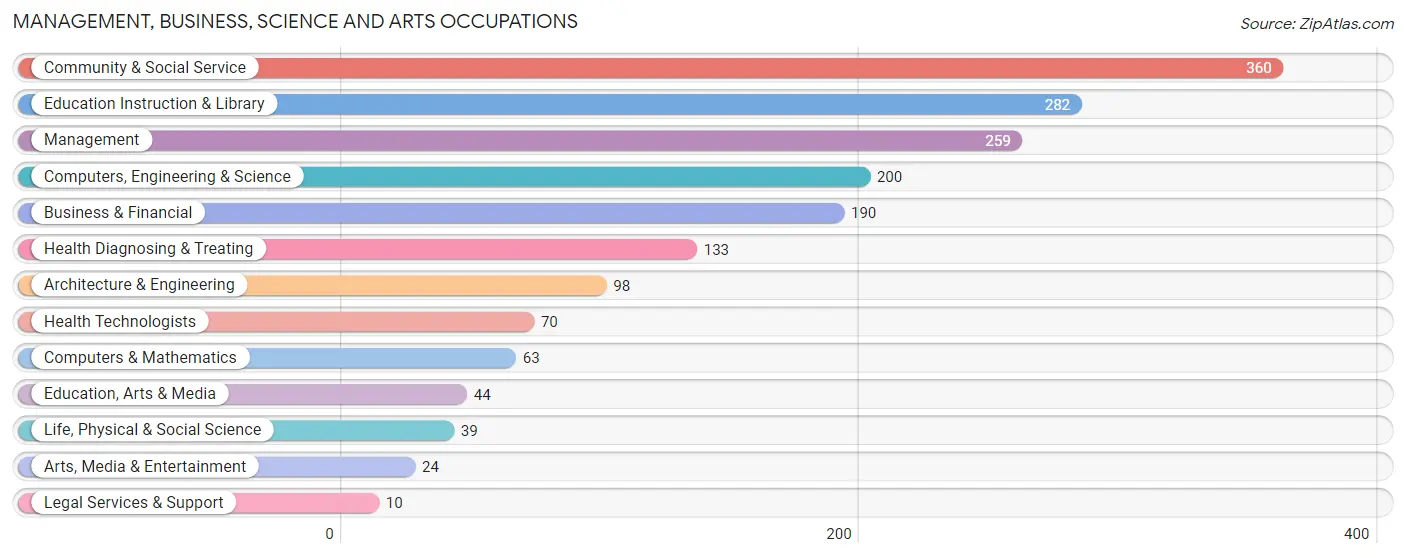
Management, Business, Science and Arts Occupations
The most common Management, Business, Science and Arts occupations in Kerman are Community & Social Service (360 | 6.0%), Education Instruction & Library (282 | 4.7%), Management (259 | 4.3%), Computers, Engineering & Science (200 | 3.3%), and Business & Financial (190 | 3.2%).
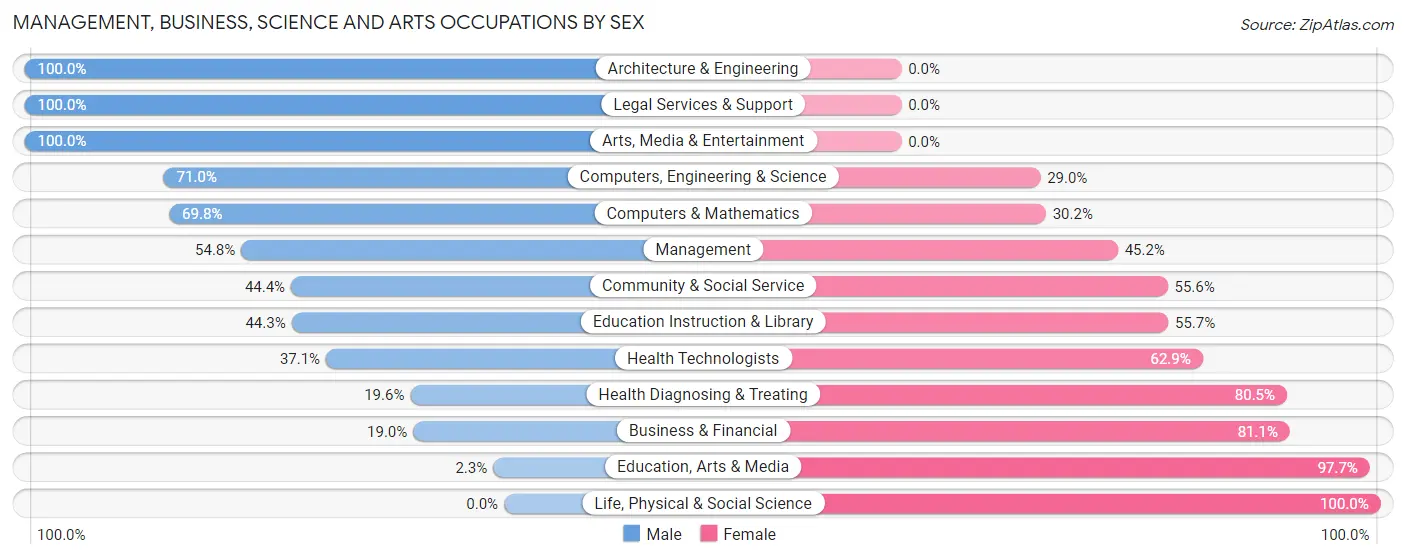
Management, Business, Science and Arts Occupations by Sex
Within the Management, Business, Science and Arts occupations in Kerman, the most male-oriented occupations are Architecture & Engineering (100.0%), Legal Services & Support (100.0%), and Arts, Media & Entertainment (100.0%), while the most female-oriented occupations are Life, Physical & Social Science (100.0%), Education, Arts & Media (97.7%), and Business & Financial (81.0%).
| Occupation | Male | Female |
| Management | 142 (54.8%) | 117 (45.2%) |
| Business & Financial | 36 (19.0%) | 154 (81.0%) |
| Computers, Engineering & Science | 142 (71.0%) | 58 (29.0%) |
| Computers & Mathematics | 44 (69.8%) | 19 (30.2%) |
| Architecture & Engineering | 98 (100.0%) | 0 (0.0%) |
| Life, Physical & Social Science | 0 (0.0%) | 39 (100.0%) |
| Community & Social Service | 160 (44.4%) | 200 (55.6%) |
| Education, Arts & Media | 1 (2.3%) | 43 (97.7%) |
| Legal Services & Support | 10 (100.0%) | 0 (0.0%) |
| Education Instruction & Library | 125 (44.3%) | 157 (55.7%) |
| Arts, Media & Entertainment | 24 (100.0%) | 0 (0.0%) |
| Health Diagnosing & Treating | 26 (19.6%) | 107 (80.4%) |
| Health Technologists | 26 (37.1%) | 44 (62.9%) |
| Total (Category) | 506 (44.3%) | 636 (55.7%) |
| Total (Overall) | 3,427 (56.8%) | 2,603 (43.2%) |
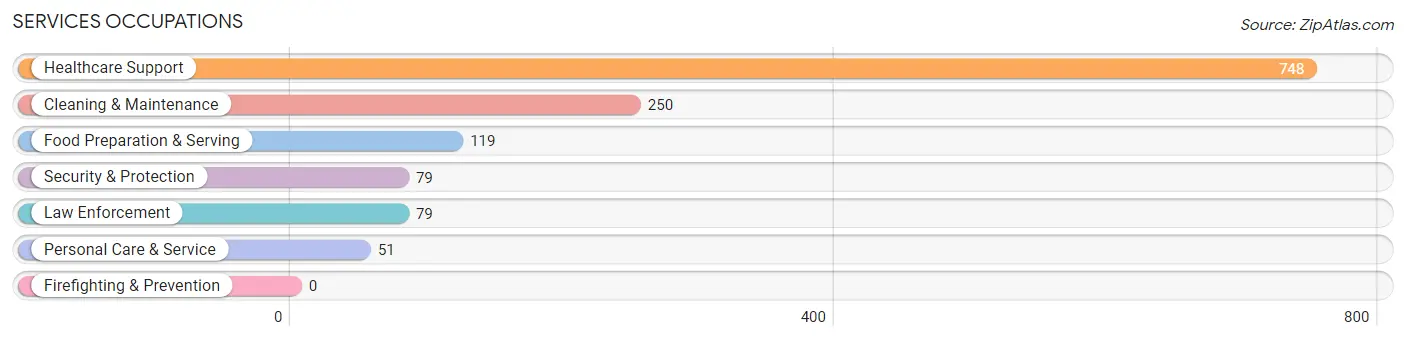
Services Occupations
The most common Services occupations in Kerman are Healthcare Support (748 | 12.4%), Cleaning & Maintenance (250 | 4.2%), Food Preparation & Serving (119 | 2.0%), Security & Protection (79 | 1.3%), and Law Enforcement (79 | 1.3%).
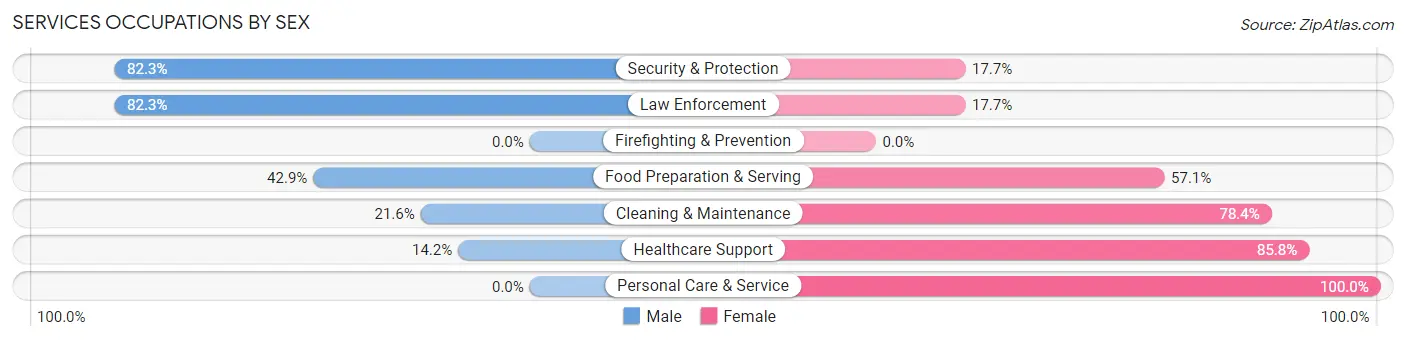
Services Occupations by Sex
Within the Services occupations in Kerman, the most male-oriented occupations are Security & Protection (82.3%), Law Enforcement (82.3%), and Food Preparation & Serving (42.9%), while the most female-oriented occupations are Personal Care & Service (100.0%), Healthcare Support (85.8%), and Cleaning & Maintenance (78.4%).
| Occupation | Male | Female |
| Healthcare Support | 106 (14.2%) | 642 (85.8%) |
| Security & Protection | 65 (82.3%) | 14 (17.7%) |
| Firefighting & Prevention | 0 (0.0%) | 0 (0.0%) |
| Law Enforcement | 65 (82.3%) | 14 (17.7%) |
| Food Preparation & Serving | 51 (42.9%) | 68 (57.1%) |
| Cleaning & Maintenance | 54 (21.6%) | 196 (78.4%) |
| Personal Care & Service | 0 (0.0%) | 51 (100.0%) |
| Total (Category) | 276 (22.1%) | 971 (77.9%) |
| Total (Overall) | 3,427 (56.8%) | 2,603 (43.2%) |
Sales and Office Occupations
The most common Sales and Office occupations in Kerman are Sales & Related (523 | 8.7%), and Office & Administration (469 | 7.8%).
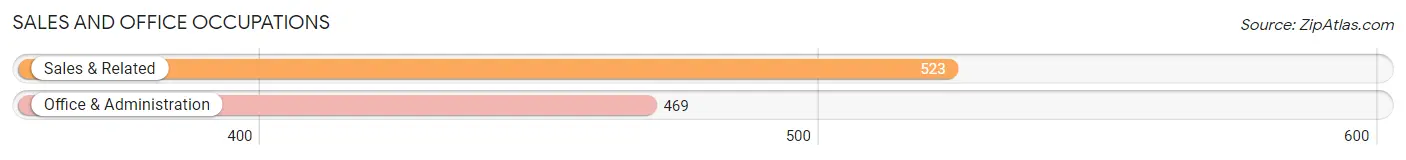
Sales and Office Occupations by Sex
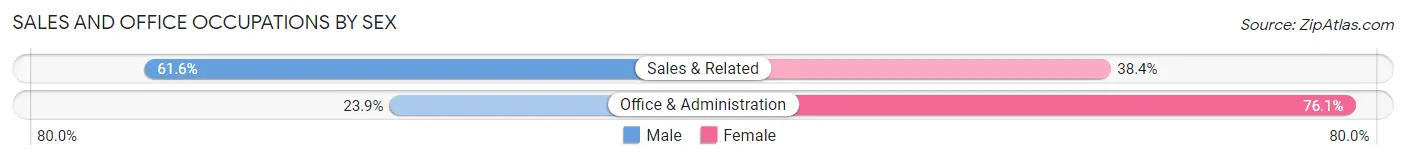
| Occupation | Male | Female |
| Sales & Related | 322 (61.6%) | 201 (38.4%) |
| Office & Administration | 112 (23.9%) | 357 (76.1%) |
| Total (Category) | 434 (43.8%) | 558 (56.2%) |
| Total (Overall) | 3,427 (56.8%) | 2,603 (43.2%) |
Natural Resources, Construction and Maintenance Occupations
The most common Natural Resources, Construction and Maintenance occupations in Kerman are Farming, Fishing & Forestry (870 | 14.4%), Construction & Extraction (691 | 11.5%), and Installation, Maintenance & Repair (165 | 2.7%).
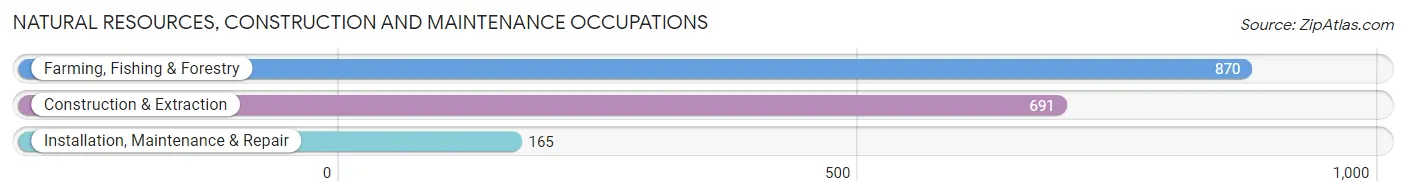
Natural Resources, Construction and Maintenance Occupations by Sex
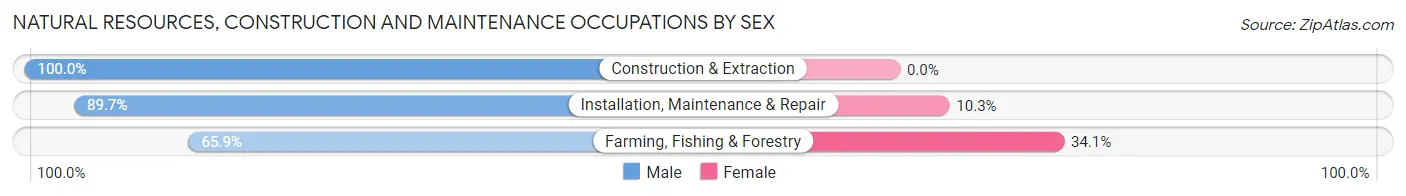
| Occupation | Male | Female |
| Farming, Fishing & Forestry | 573 (65.9%) | 297 (34.1%) |
| Construction & Extraction | 691 (100.0%) | 0 (0.0%) |
| Installation, Maintenance & Repair | 148 (89.7%) | 17 (10.3%) |
| Total (Category) | 1,412 (81.8%) | 314 (18.2%) |
| Total (Overall) | 3,427 (56.8%) | 2,603 (43.2%) |
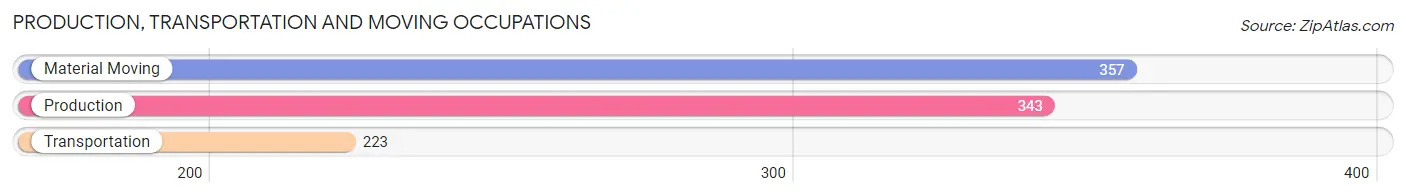
Production, Transportation and Moving Occupations
The most common Production, Transportation and Moving occupations in Kerman are Material Moving (357 | 5.9%), Production (343 | 5.7%), and Transportation (223 | 3.7%).
Production, Transportation and Moving Occupations by Sex
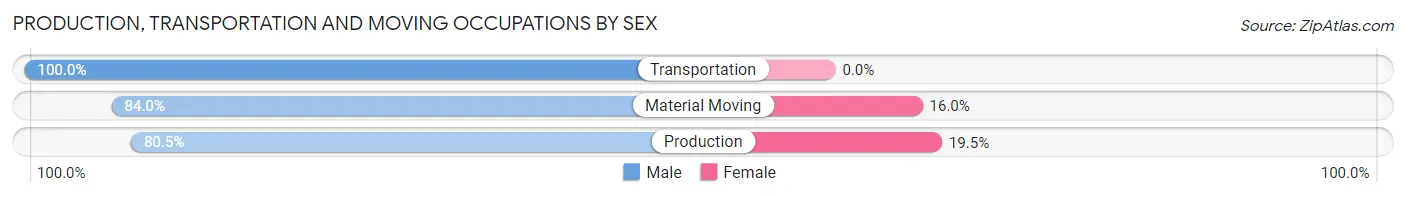
| Occupation | Male | Female |
| Production | 276 (80.5%) | 67 (19.5%) |
| Transportation | 223 (100.0%) | 0 (0.0%) |
| Material Moving | 300 (84.0%) | 57 (16.0%) |
| Total (Category) | 799 (86.6%) | 124 (13.4%) |
| Total (Overall) | 3,427 (56.8%) | 2,603 (43.2%) |
Employment Industries by Sex in Kerman
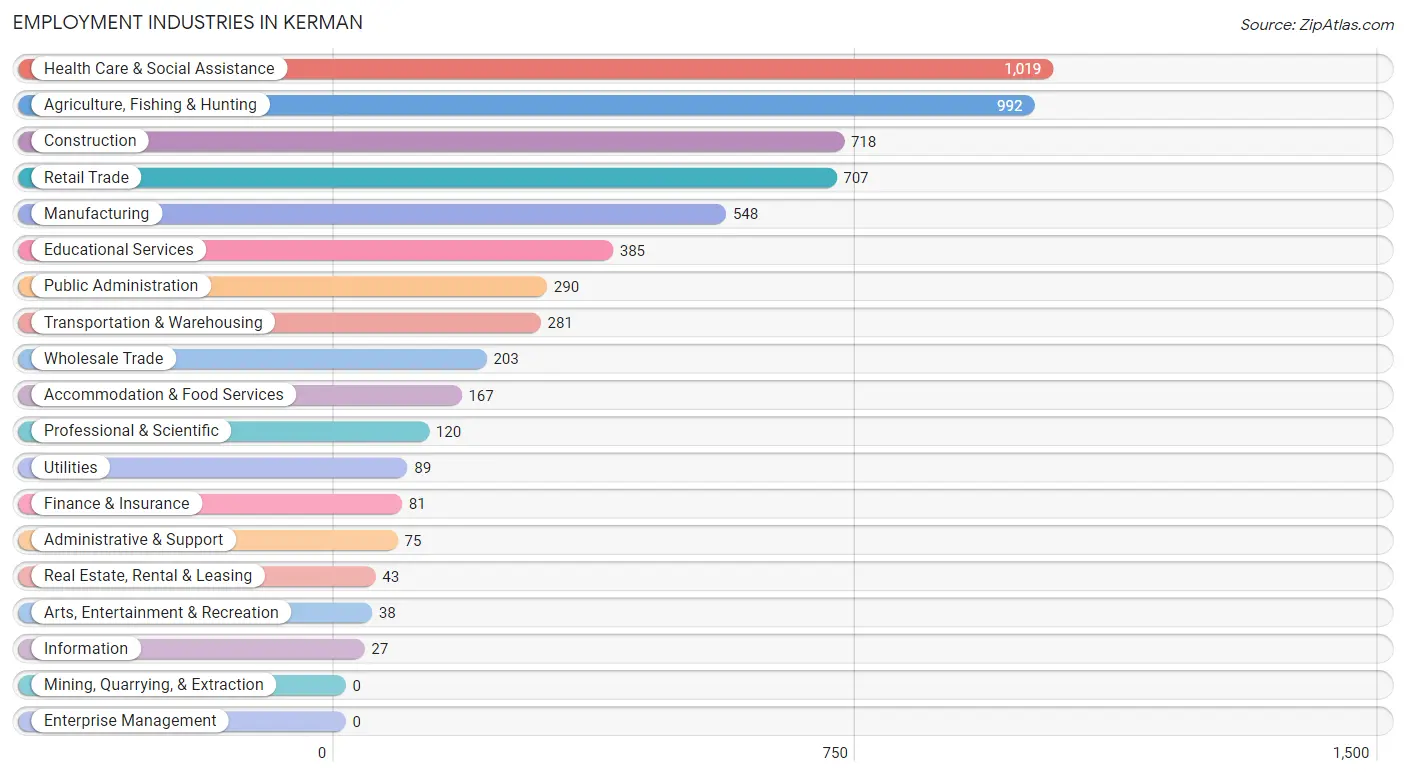
Employment Industries in Kerman
The major employment industries in Kerman include Health Care & Social Assistance (1,019 | 16.9%), Agriculture, Fishing & Hunting (992 | 16.5%), Construction (718 | 11.9%), Retail Trade (707 | 11.7%), and Manufacturing (548 | 9.1%).
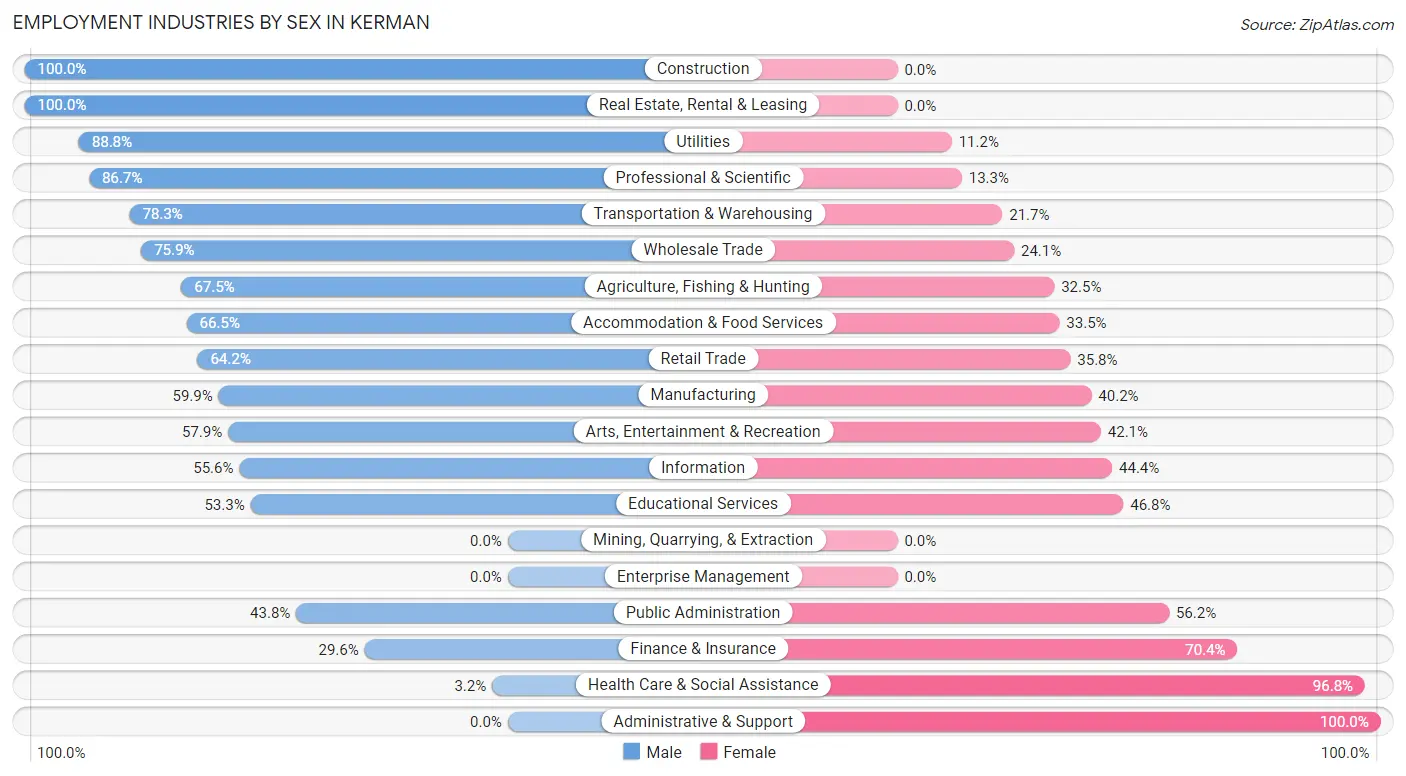
Employment Industries by Sex in Kerman
The Kerman industries that see more men than women are Construction (100.0%), Real Estate, Rental & Leasing (100.0%), and Utilities (88.8%), whereas the industries that tend to have a higher number of women are Administrative & Support (100.0%), Health Care & Social Assistance (96.8%), and Finance & Insurance (70.4%).
| Industry | Male | Female |
| Agriculture, Fishing & Hunting | 670 (67.5%) | 322 (32.5%) |
| Mining, Quarrying, & Extraction | 0 (0.0%) | 0 (0.0%) |
| Construction | 718 (100.0%) | 0 (0.0%) |
| Manufacturing | 328 (59.9%) | 220 (40.2%) |
| Wholesale Trade | 154 (75.9%) | 49 (24.1%) |
| Retail Trade | 454 (64.2%) | 253 (35.8%) |
| Transportation & Warehousing | 220 (78.3%) | 61 (21.7%) |
| Utilities | 79 (88.8%) | 10 (11.2%) |
| Information | 15 (55.6%) | 12 (44.4%) |
| Finance & Insurance | 24 (29.6%) | 57 (70.4%) |
| Real Estate, Rental & Leasing | 43 (100.0%) | 0 (0.0%) |
| Professional & Scientific | 104 (86.7%) | 16 (13.3%) |
| Enterprise Management | 0 (0.0%) | 0 (0.0%) |
| Administrative & Support | 0 (0.0%) | 75 (100.0%) |
| Educational Services | 205 (53.2%) | 180 (46.8%) |
| Health Care & Social Assistance | 33 (3.2%) | 986 (96.8%) |
| Arts, Entertainment & Recreation | 22 (57.9%) | 16 (42.1%) |
| Accommodation & Food Services | 111 (66.5%) | 56 (33.5%) |
| Public Administration | 127 (43.8%) | 163 (56.2%) |
| Total | 3,427 (56.8%) | 2,603 (43.2%) |
Education in Kerman
School Enrollment in Kerman
The most common levels of schooling among the 5,242 students in Kerman are high school (1,455 | 27.8%), middle school (1,342 | 25.6%), and elementary school (1,056 | 20.1%).
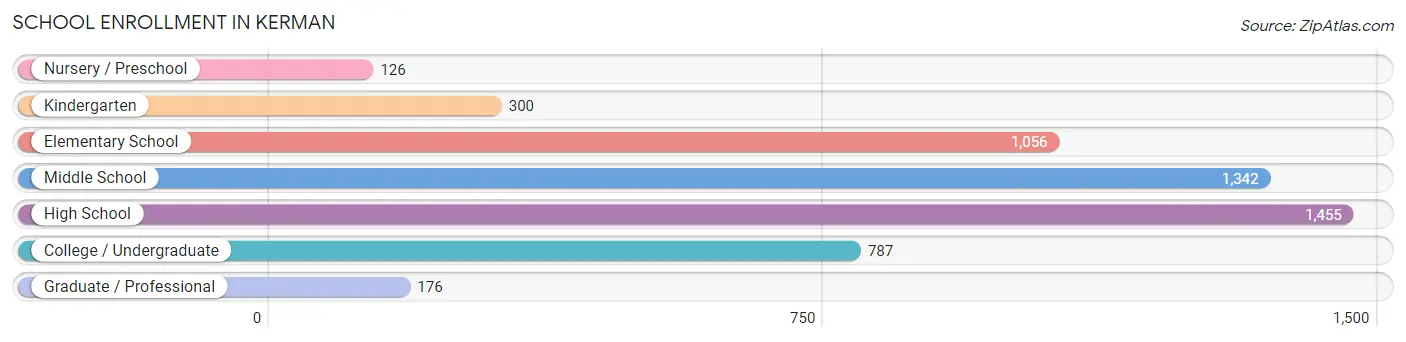
| School Level | # Students | % Students |
| Nursery / Preschool | 126 | 2.4% |
| Kindergarten | 300 | 5.7% |
| Elementary School | 1,056 | 20.1% |
| Middle School | 1,342 | 25.6% |
| High School | 1,455 | 27.8% |
| College / Undergraduate | 787 | 15.0% |
| Graduate / Professional | 176 | 3.4% |
| Total | 5,242 | 100.0% |
School Enrollment by Age by Funding Source in Kerman
Out of a total of 5,242 students who are enrolled in schools in Kerman, 79 (1.5%) attend a private institution, while the remaining 5,163 (98.5%) are enrolled in public schools. The age group of 35 years and over has the highest likelihood of being enrolled in private schools, with 17 (13.5% in the age bracket) enrolled. Conversely, the age group of 3 to 4 year olds has the lowest likelihood of being enrolled in a private school, with 116 (100.0% in the age bracket) attending a public institution.
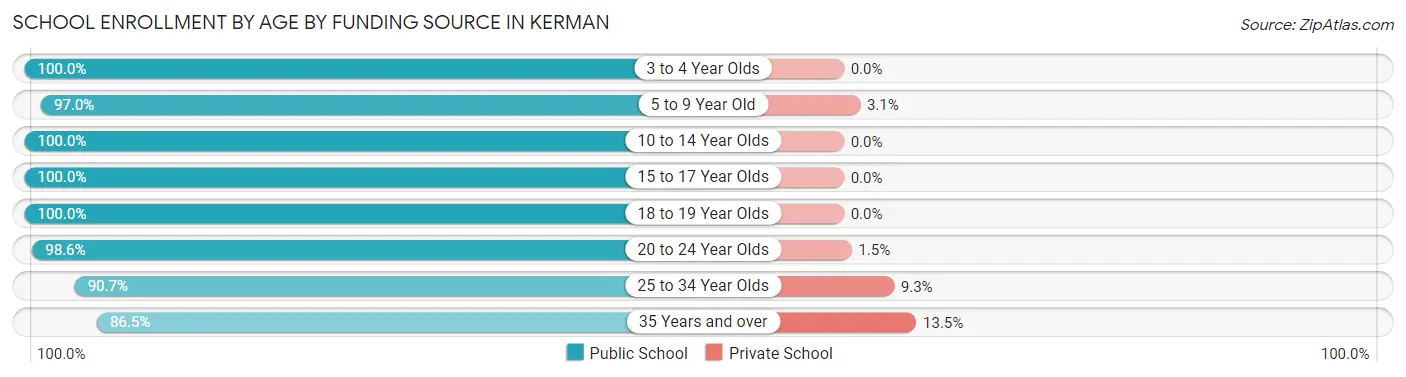
| Age Bracket | Public School | Private School |
| 3 to 4 Year Olds | 116 (100.0%) | 0 (0.0%) |
| 5 to 9 Year Old | 1,175 (97.0%) | 37 (3.0%) |
| 10 to 14 Year Olds | 1,814 (100.0%) | 0 (0.0%) |
| 15 to 17 Year Olds | 916 (100.0%) | 0 (0.0%) |
| 18 to 19 Year Olds | 256 (100.0%) | 0 (0.0%) |
| 20 to 24 Year Olds | 611 (98.6%) | 9 (1.5%) |
| 25 to 34 Year Olds | 165 (90.7%) | 17 (9.3%) |
| 35 Years and over | 109 (86.5%) | 17 (13.5%) |
| Total | 5,163 (98.5%) | 79 (1.5%) |
Educational Attainment by Field of Study in Kerman
Business (381 | 29.2%), liberal arts & history (276 | 21.1%), social sciences (150 | 11.5%), engineering (105 | 8.0%), and bio, nature & agricultural (95 | 7.3%) are the most common fields of study among 1,306 individuals in Kerman who have obtained a bachelor's degree or higher.
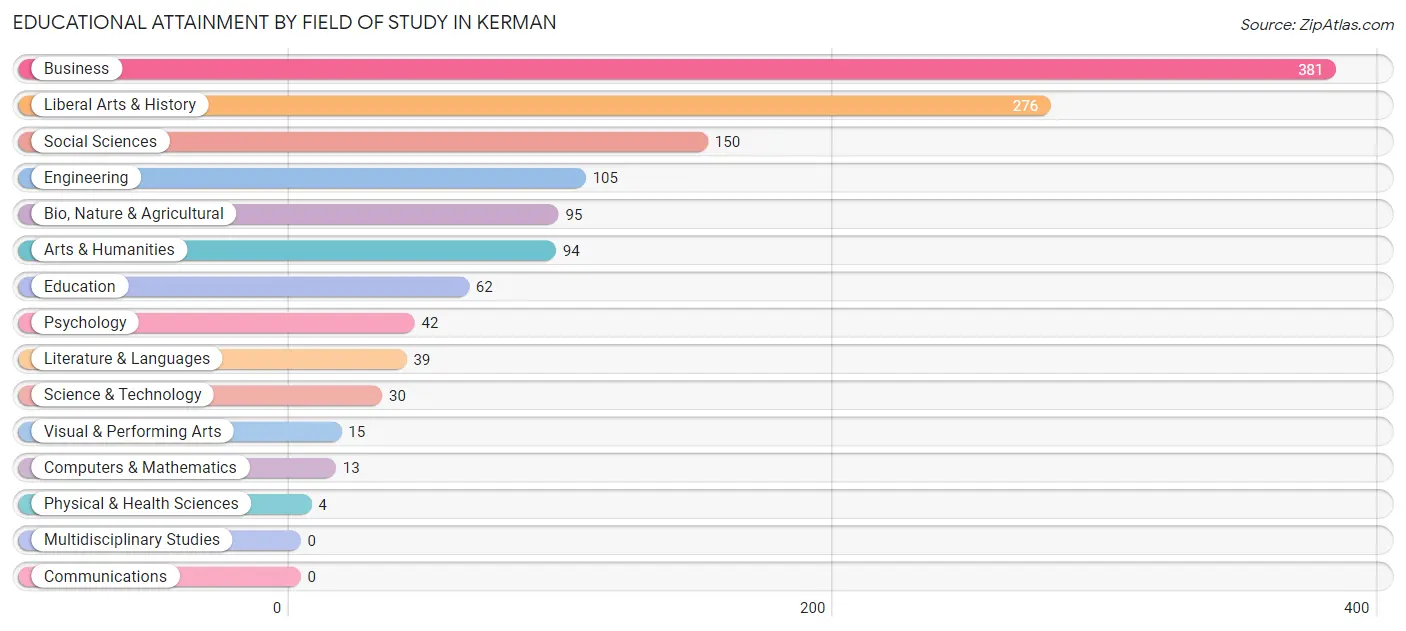
| Field of Study | # Graduates | % Graduates |
| Computers & Mathematics | 13 | 1.0% |
| Bio, Nature & Agricultural | 95 | 7.3% |
| Physical & Health Sciences | 4 | 0.3% |
| Psychology | 42 | 3.2% |
| Social Sciences | 150 | 11.5% |
| Engineering | 105 | 8.0% |
| Multidisciplinary Studies | 0 | 0.0% |
| Science & Technology | 30 | 2.3% |
| Business | 381 | 29.2% |
| Education | 62 | 4.8% |
| Literature & Languages | 39 | 3.0% |
| Liberal Arts & History | 276 | 21.1% |
| Visual & Performing Arts | 15 | 1.1% |
| Communications | 0 | 0.0% |
| Arts & Humanities | 94 | 7.2% |
| Total | 1,306 | 100.0% |
Transportation & Commute in Kerman
Vehicle Availability by Sex in Kerman
The most prevalent vehicle ownership categories in Kerman are males with 2 vehicles (1,334, accounting for 39.6%) and females with 2 vehicles (1,075, making up 53.8%).
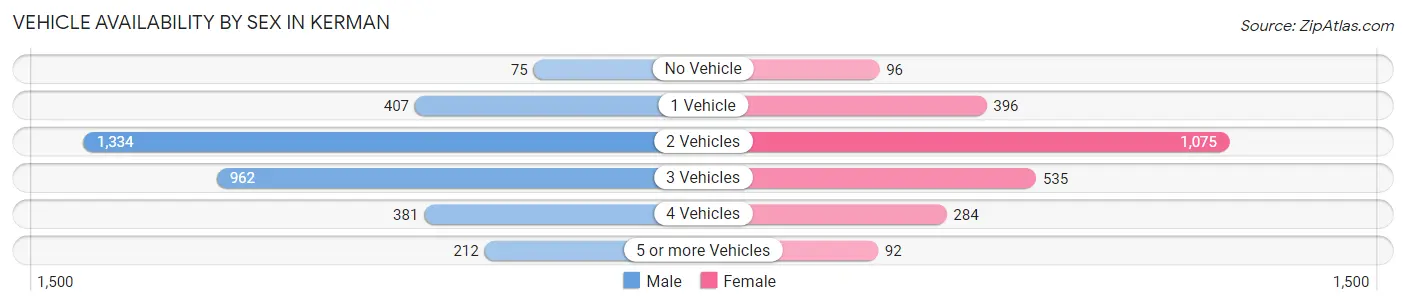
| Vehicles Available | Male | Female |
| No Vehicle | 75 (2.2%) | 96 (3.9%) |
| 1 Vehicle | 407 (12.1%) | 396 (16.0%) |
| 2 Vehicles | 1,334 (39.6%) | 1,075 (43.4%) |
| 3 Vehicles | 962 (28.5%) | 535 (21.6%) |
| 4 Vehicles | 381 (11.3%) | 284 (11.5%) |
| 5 or more Vehicles | 212 (6.3%) | 92 (3.7%) |
| Total | 3,371 (100.0%) | 2,478 (100.0%) |
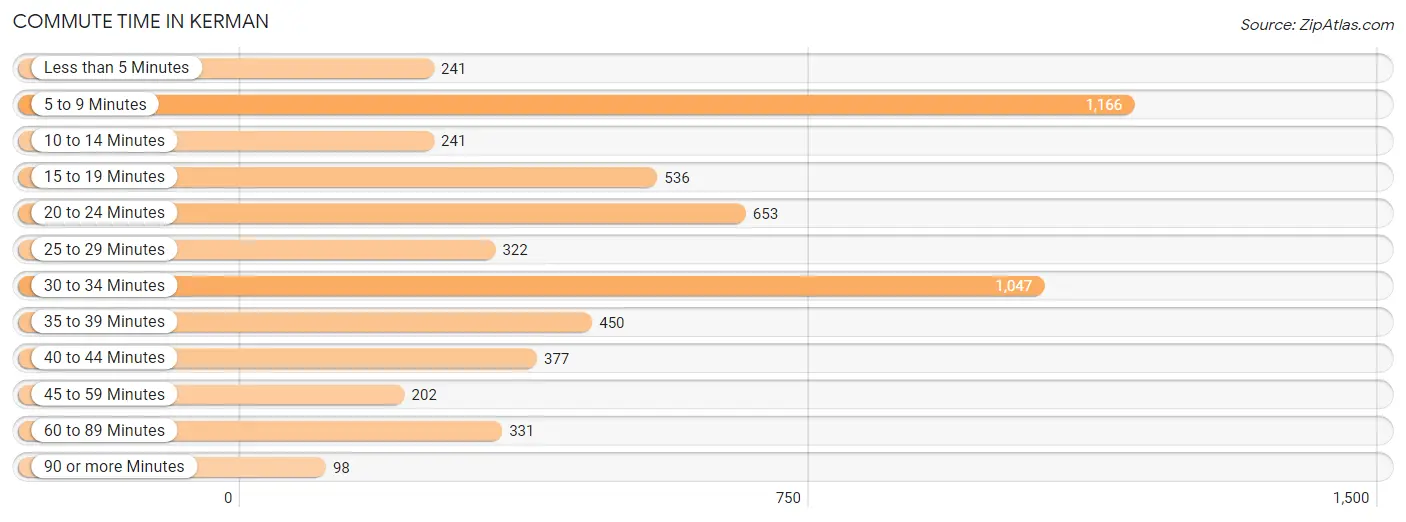
Commute Time in Kerman
The most frequently occuring commute durations in Kerman are 5 to 9 minutes (1,166 commuters, 20.6%), 30 to 34 minutes (1,047 commuters, 18.5%), and 20 to 24 minutes (653 commuters, 11.5%).
| Commute Time | # Commuters | % Commuters |
| Less than 5 Minutes | 241 | 4.3% |
| 5 to 9 Minutes | 1,166 | 20.6% |
| 10 to 14 Minutes | 241 | 4.3% |
| 15 to 19 Minutes | 536 | 9.5% |
| 20 to 24 Minutes | 653 | 11.5% |
| 25 to 29 Minutes | 322 | 5.7% |
| 30 to 34 Minutes | 1,047 | 18.5% |
| 35 to 39 Minutes | 450 | 7.9% |
| 40 to 44 Minutes | 377 | 6.7% |
| 45 to 59 Minutes | 202 | 3.6% |
| 60 to 89 Minutes | 331 | 5.8% |
| 90 or more Minutes | 98 | 1.7% |
Commute Time by Sex in Kerman
The most common commute times in Kerman are 5 to 9 minutes (678 commuters, 20.6%) for males and 30 to 34 minutes (560 commuters, 23.6%) for females.
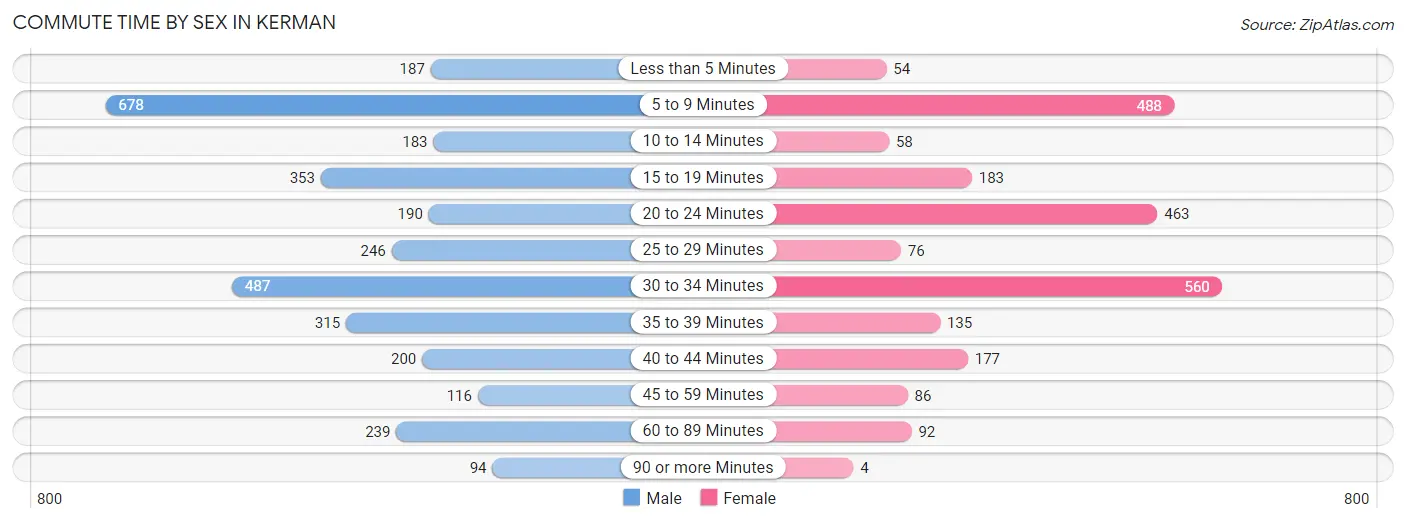
| Commute Time | Male | Female |
| Less than 5 Minutes | 187 (5.7%) | 54 (2.3%) |
| 5 to 9 Minutes | 678 (20.6%) | 488 (20.5%) |
| 10 to 14 Minutes | 183 (5.6%) | 58 (2.4%) |
| 15 to 19 Minutes | 353 (10.7%) | 183 (7.7%) |
| 20 to 24 Minutes | 190 (5.8%) | 463 (19.5%) |
| 25 to 29 Minutes | 246 (7.5%) | 76 (3.2%) |
| 30 to 34 Minutes | 487 (14.8%) | 560 (23.6%) |
| 35 to 39 Minutes | 315 (9.6%) | 135 (5.7%) |
| 40 to 44 Minutes | 200 (6.1%) | 177 (7.4%) |
| 45 to 59 Minutes | 116 (3.5%) | 86 (3.6%) |
| 60 to 89 Minutes | 239 (7.3%) | 92 (3.9%) |
| 90 or more Minutes | 94 (2.9%) | 4 (0.2%) |
Time of Departure to Work by Sex in Kerman
The most frequent times of departure to work in Kerman are 6:00 AM to 6:29 AM (954, 29.0%) for males and 7:00 AM to 7:29 AM (513, 21.6%) for females.
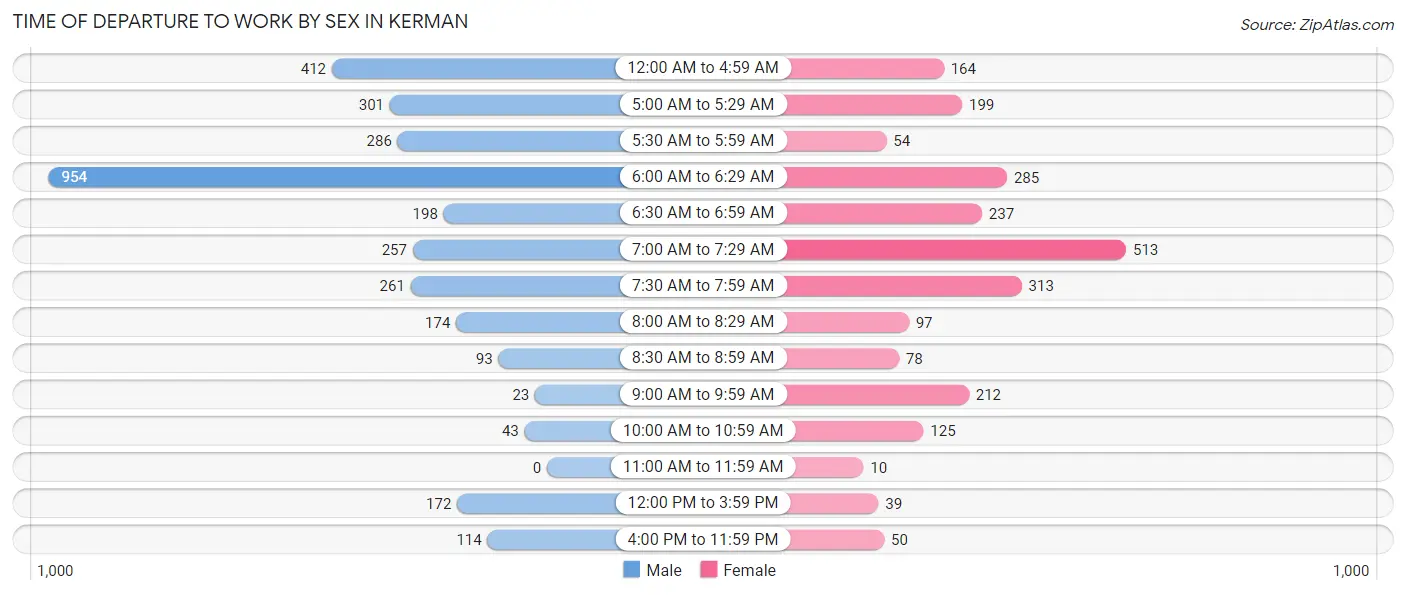
| Time of Departure | Male | Female |
| 12:00 AM to 4:59 AM | 412 (12.5%) | 164 (6.9%) |
| 5:00 AM to 5:29 AM | 301 (9.1%) | 199 (8.4%) |
| 5:30 AM to 5:59 AM | 286 (8.7%) | 54 (2.3%) |
| 6:00 AM to 6:29 AM | 954 (29.0%) | 285 (12.0%) |
| 6:30 AM to 6:59 AM | 198 (6.0%) | 237 (10.0%) |
| 7:00 AM to 7:29 AM | 257 (7.8%) | 513 (21.6%) |
| 7:30 AM to 7:59 AM | 261 (7.9%) | 313 (13.2%) |
| 8:00 AM to 8:29 AM | 174 (5.3%) | 97 (4.1%) |
| 8:30 AM to 8:59 AM | 93 (2.8%) | 78 (3.3%) |
| 9:00 AM to 9:59 AM | 23 (0.7%) | 212 (8.9%) |
| 10:00 AM to 10:59 AM | 43 (1.3%) | 125 (5.3%) |
| 11:00 AM to 11:59 AM | 0 (0.0%) | 10 (0.4%) |
| 12:00 PM to 3:59 PM | 172 (5.2%) | 39 (1.6%) |
| 4:00 PM to 11:59 PM | 114 (3.5%) | 50 (2.1%) |
| Total | 3,288 (100.0%) | 2,376 (100.0%) |
Housing Occupancy in Kerman
Occupancy by Ownership in Kerman
Of the total 4,446 dwellings in Kerman, owner-occupied units account for 2,117 (47.6%), while renter-occupied units make up 2,329 (52.4%).
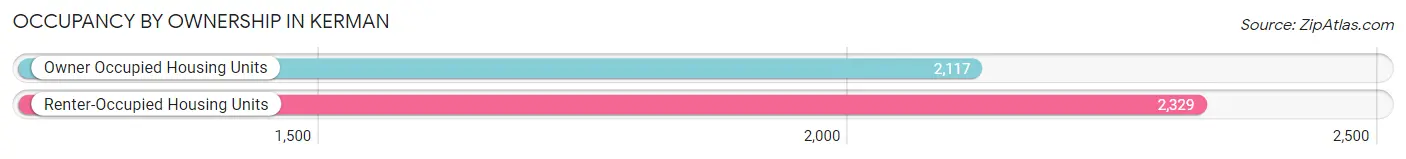
| Occupancy | # Housing Units | % Housing Units |
| Owner Occupied Housing Units | 2,117 | 47.6% |
| Renter-Occupied Housing Units | 2,329 | 52.4% |
| Total Occupied Housing Units | 4,446 | 100.0% |
Occupancy by Household Size in Kerman
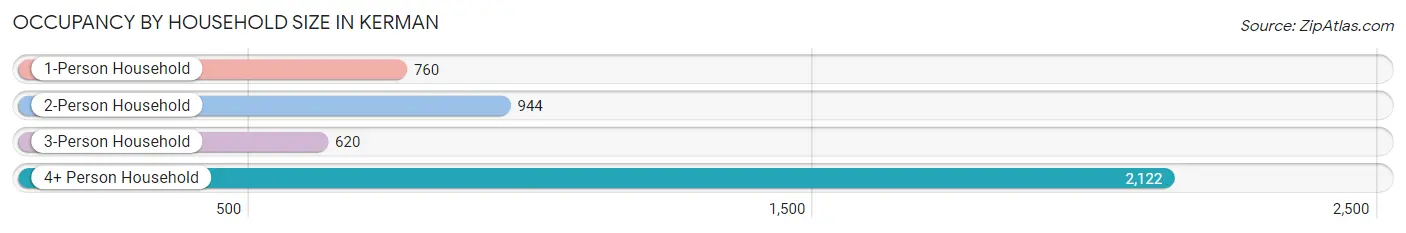
| Household Size | # Housing Units | % Housing Units |
| 1-Person Household | 760 | 17.1% |
| 2-Person Household | 944 | 21.2% |
| 3-Person Household | 620 | 14.0% |
| 4+ Person Household | 2,122 | 47.7% |
| Total Housing Units | 4,446 | 100.0% |
Occupancy by Ownership by Household Size in Kerman
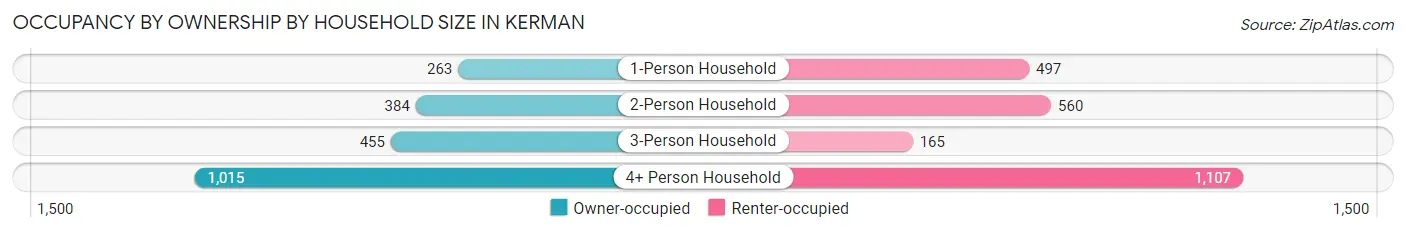
| Household Size | Owner-occupied | Renter-occupied |
| 1-Person Household | 263 (34.6%) | 497 (65.4%) |
| 2-Person Household | 384 (40.7%) | 560 (59.3%) |
| 3-Person Household | 455 (73.4%) | 165 (26.6%) |
| 4+ Person Household | 1,015 (47.8%) | 1,107 (52.2%) |
| Total Housing Units | 2,117 (47.6%) | 2,329 (52.4%) |
Occupancy by Educational Attainment in Kerman

| Household Size | Owner-occupied | Renter-occupied |
| Less than High School | 677 (37.0%) | 1,152 (63.0%) |
| High School Diploma | 443 (55.1%) | 361 (44.9%) |
| College/Associate Degree | 353 (32.0%) | 749 (68.0%) |
| Bachelor's Degree or higher | 644 (90.6%) | 67 (9.4%) |
Occupancy by Age of Householder in Kerman
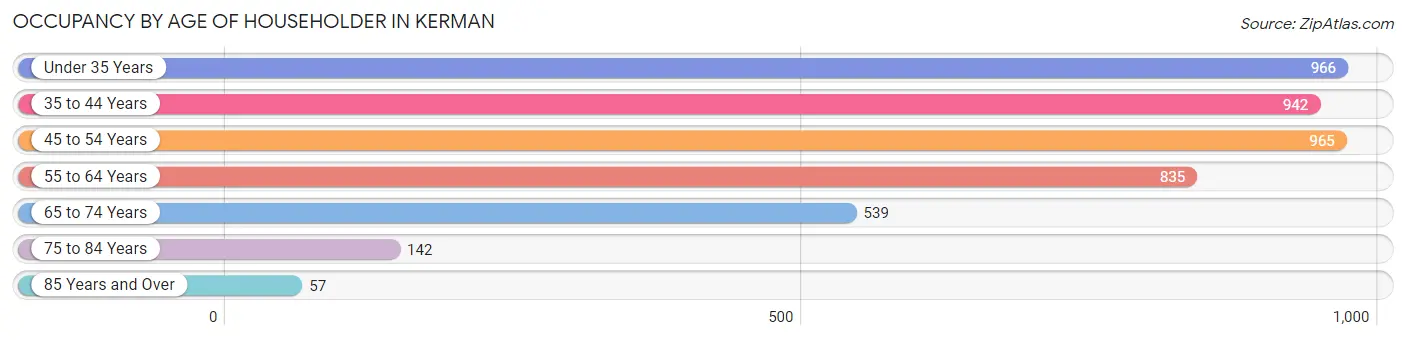
| Age Bracket | # Households | % Households |
| Under 35 Years | 966 | 21.7% |
| 35 to 44 Years | 942 | 21.2% |
| 45 to 54 Years | 965 | 21.7% |
| 55 to 64 Years | 835 | 18.8% |
| 65 to 74 Years | 539 | 12.1% |
| 75 to 84 Years | 142 | 3.2% |
| 85 Years and Over | 57 | 1.3% |
| Total | 4,446 | 100.0% |
Housing Finances in Kerman
Median Income by Occupancy in Kerman
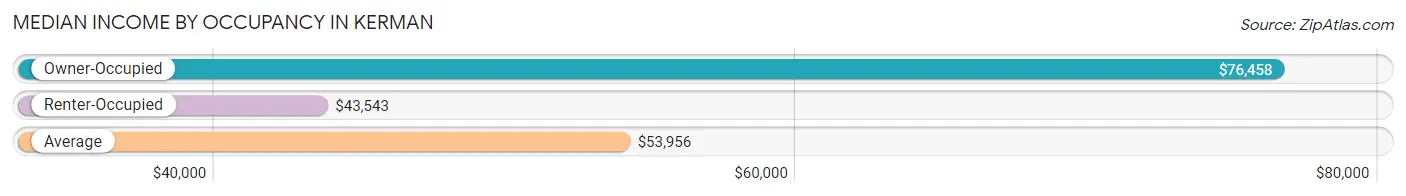
| Occupancy Type | # Households | Median Income |
| Owner-Occupied | 2,117 (47.6%) | $76,458 |
| Renter-Occupied | 2,329 (52.4%) | $43,543 |
| Average | 4,446 (100.0%) | $53,956 |
Occupancy by Householder Income Bracket in Kerman
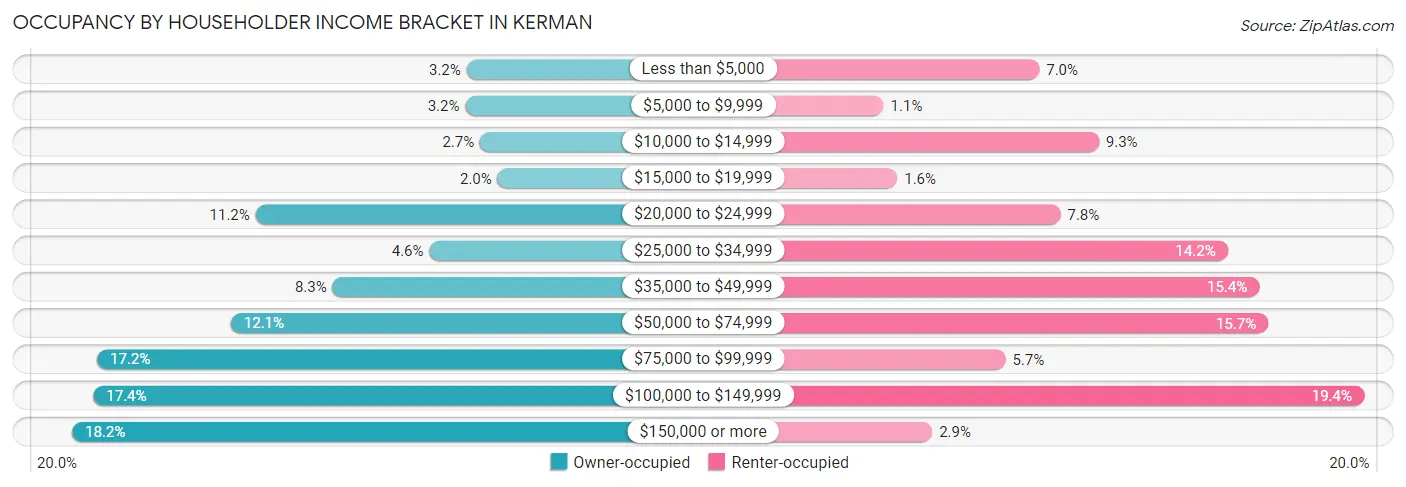
| Income Bracket | Owner-occupied | Renter-occupied |
| Less than $5,000 | 67 (3.2%) | 163 (7.0%) |
| $5,000 to $9,999 | 68 (3.2%) | 25 (1.1%) |
| $10,000 to $14,999 | 56 (2.6%) | 216 (9.3%) |
| $15,000 to $19,999 | 42 (2.0%) | 37 (1.6%) |
| $20,000 to $24,999 | 237 (11.2%) | 182 (7.8%) |
| $25,000 to $34,999 | 97 (4.6%) | 330 (14.2%) |
| $35,000 to $49,999 | 175 (8.3%) | 358 (15.4%) |
| $50,000 to $74,999 | 257 (12.1%) | 366 (15.7%) |
| $75,000 to $99,999 | 365 (17.2%) | 133 (5.7%) |
| $100,000 to $149,999 | 368 (17.4%) | 451 (19.4%) |
| $150,000 or more | 385 (18.2%) | 68 (2.9%) |
| Total | 2,117 (100.0%) | 2,329 (100.0%) |
Monthly Housing Cost Tiers in Kerman
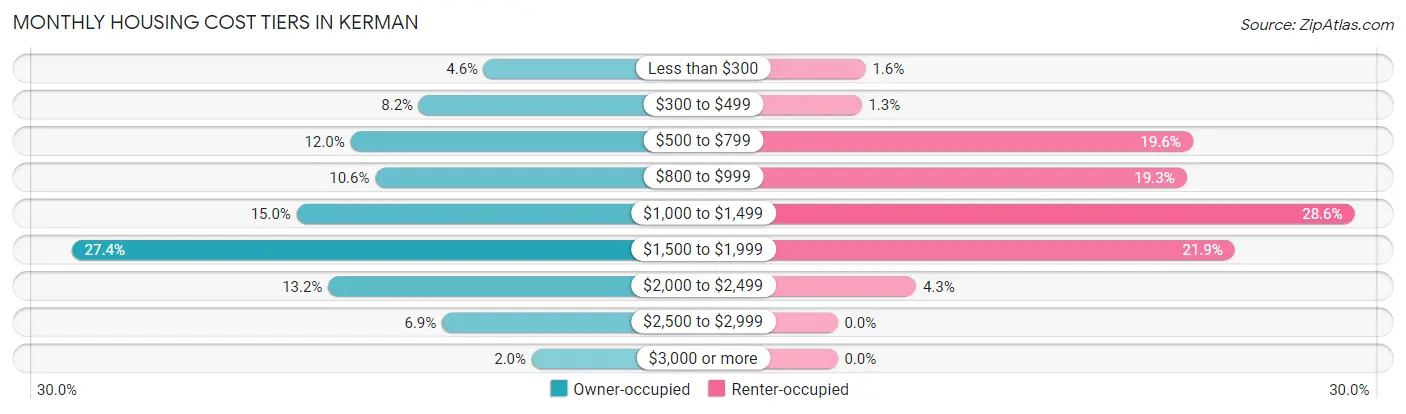
| Monthly Cost | Owner-occupied | Renter-occupied |
| Less than $300 | 98 (4.6%) | 36 (1.5%) |
| $300 to $499 | 174 (8.2%) | 31 (1.3%) |
| $500 to $799 | 254 (12.0%) | 457 (19.6%) |
| $800 to $999 | 225 (10.6%) | 449 (19.3%) |
| $1,000 to $1,499 | 317 (15.0%) | 665 (28.5%) |
| $1,500 to $1,999 | 580 (27.4%) | 511 (21.9%) |
| $2,000 to $2,499 | 280 (13.2%) | 101 (4.3%) |
| $2,500 to $2,999 | 147 (6.9%) | 0 (0.0%) |
| $3,000 or more | 42 (2.0%) | 0 (0.0%) |
| Total | 2,117 (100.0%) | 2,329 (100.0%) |
Physical Housing Characteristics in Kerman
Housing Structures in Kerman
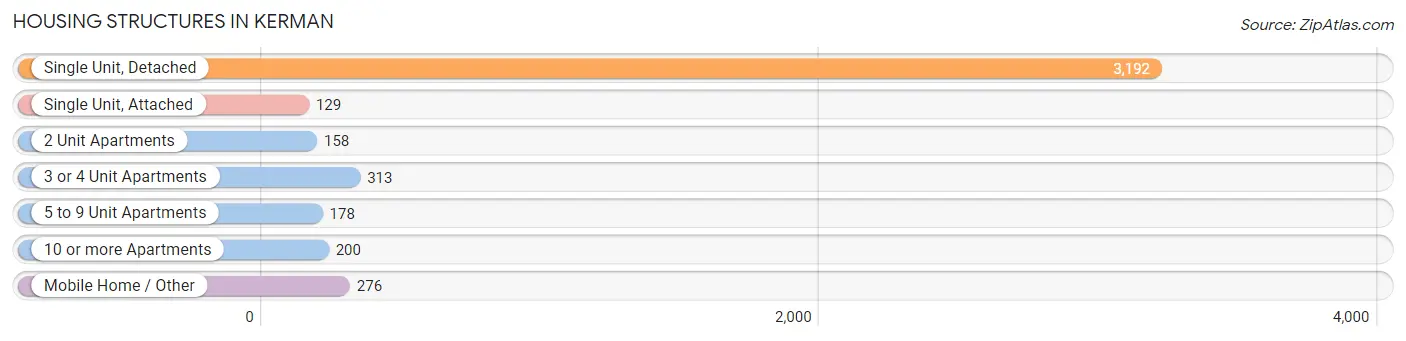
| Structure Type | # Housing Units | % Housing Units |
| Single Unit, Detached | 3,192 | 71.8% |
| Single Unit, Attached | 129 | 2.9% |
| 2 Unit Apartments | 158 | 3.5% |
| 3 or 4 Unit Apartments | 313 | 7.0% |
| 5 to 9 Unit Apartments | 178 | 4.0% |
| 10 or more Apartments | 200 | 4.5% |
| Mobile Home / Other | 276 | 6.2% |
| Total | 4,446 | 100.0% |
Housing Structures by Occupancy in Kerman
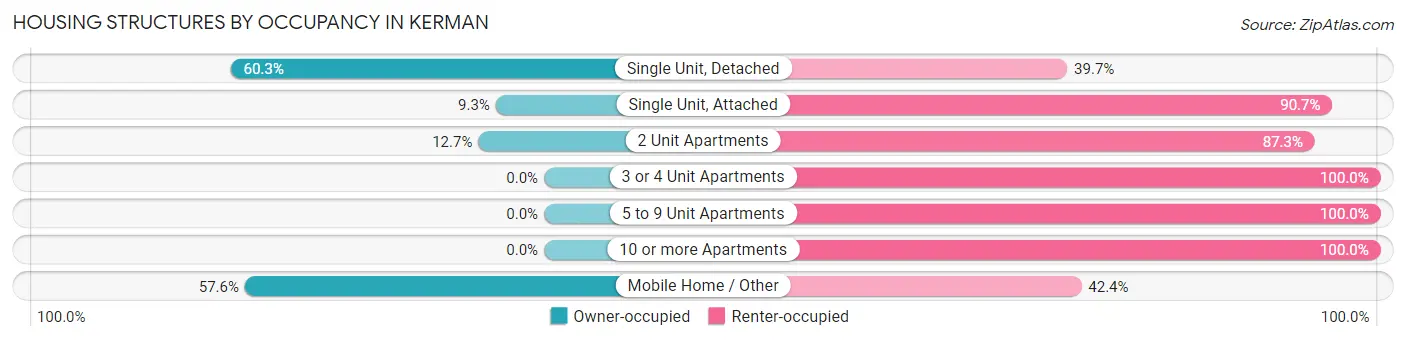
| Structure Type | Owner-occupied | Renter-occupied |
| Single Unit, Detached | 1,926 (60.3%) | 1,266 (39.7%) |
| Single Unit, Attached | 12 (9.3%) | 117 (90.7%) |
| 2 Unit Apartments | 20 (12.7%) | 138 (87.3%) |
| 3 or 4 Unit Apartments | 0 (0.0%) | 313 (100.0%) |
| 5 to 9 Unit Apartments | 0 (0.0%) | 178 (100.0%) |
| 10 or more Apartments | 0 (0.0%) | 200 (100.0%) |
| Mobile Home / Other | 159 (57.6%) | 117 (42.4%) |
| Total | 2,117 (47.6%) | 2,329 (52.4%) |
Housing Structures by Number of Rooms in Kerman
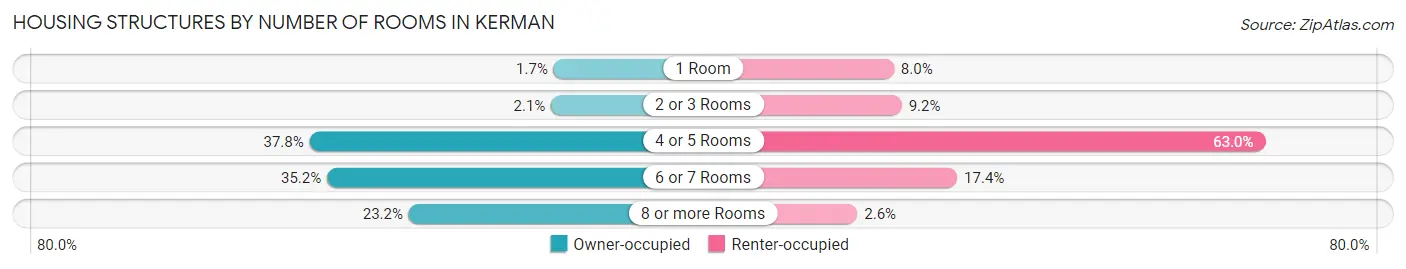
| Number of Rooms | Owner-occupied | Renter-occupied |
| 1 Room | 36 (1.7%) | 186 (8.0%) |
| 2 or 3 Rooms | 44 (2.1%) | 213 (9.1%) |
| 4 or 5 Rooms | 801 (37.8%) | 1,466 (62.9%) |
| 6 or 7 Rooms | 746 (35.2%) | 404 (17.3%) |
| 8 or more Rooms | 490 (23.2%) | 60 (2.6%) |
| Total | 2,117 (100.0%) | 2,329 (100.0%) |
Housing Structure by Heating Type in Kerman
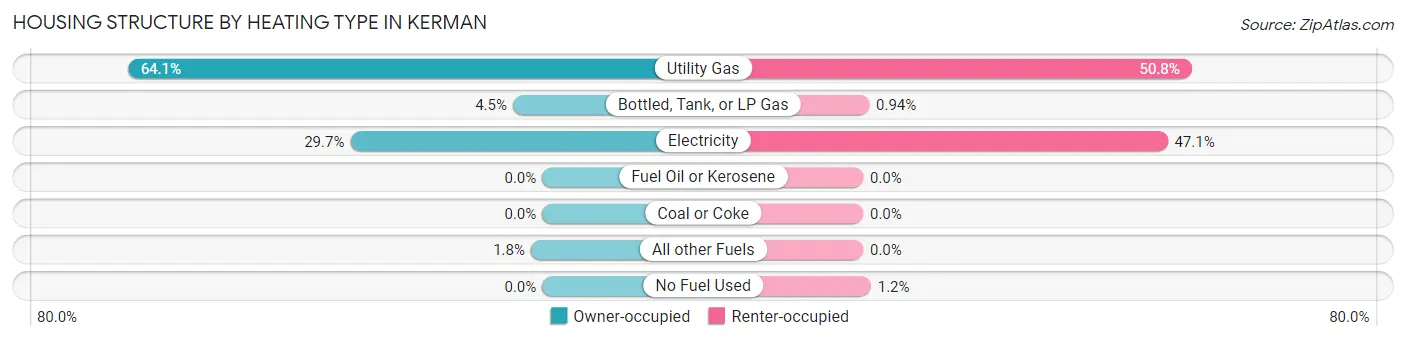
| Heating Type | Owner-occupied | Renter-occupied |
| Utility Gas | 1,356 (64.0%) | 1,183 (50.8%) |
| Bottled, Tank, or LP Gas | 96 (4.5%) | 22 (0.9%) |
| Electricity | 628 (29.7%) | 1,096 (47.1%) |
| Fuel Oil or Kerosene | 0 (0.0%) | 0 (0.0%) |
| Coal or Coke | 0 (0.0%) | 0 (0.0%) |
| All other Fuels | 37 (1.8%) | 0 (0.0%) |
| No Fuel Used | 0 (0.0%) | 28 (1.2%) |
| Total | 2,117 (100.0%) | 2,329 (100.0%) |
Household Vehicle Usage in Kerman
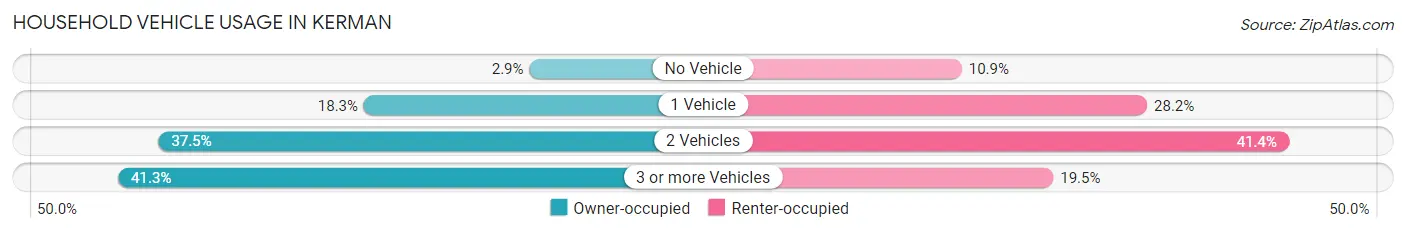
| Vehicles per Household | Owner-occupied | Renter-occupied |
| No Vehicle | 61 (2.9%) | 254 (10.9%) |
| 1 Vehicle | 388 (18.3%) | 657 (28.2%) |
| 2 Vehicles | 794 (37.5%) | 965 (41.4%) |
| 3 or more Vehicles | 874 (41.3%) | 453 (19.5%) |
| Total | 2,117 (100.0%) | 2,329 (100.0%) |
Real Estate & Mortgages in Kerman
Real Estate and Mortgage Overview in Kerman
| Characteristic | Without Mortgage | With Mortgage |
| Housing Units | 578 | 1,539 |
| Median Property Value | $258,500 | $311,300 |
| Median Household Income | $71,250 | $357 |
| Monthly Housing Costs | $536 | $42 |
| Real Estate Taxes | $1,293 | $40 |
Property Value by Mortgage Status in Kerman
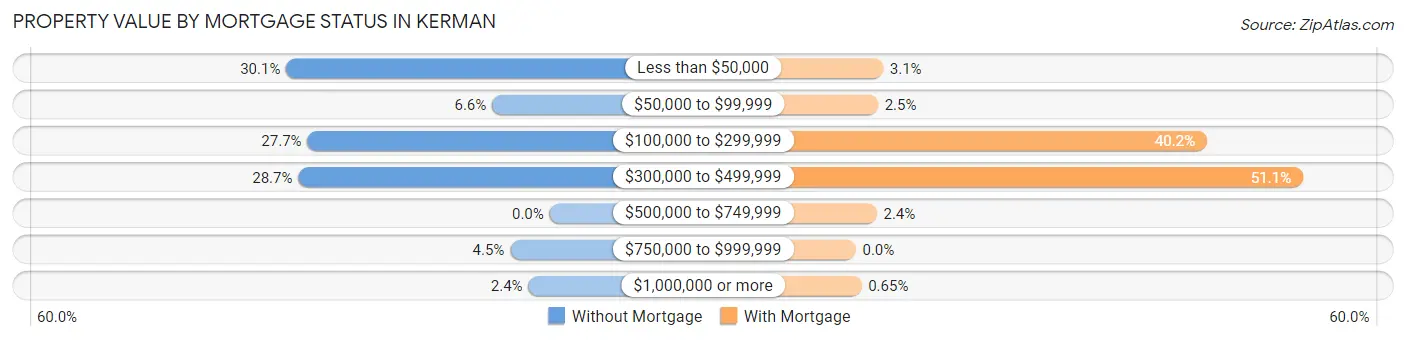
| Property Value | Without Mortgage | With Mortgage |
| Less than $50,000 | 174 (30.1%) | 48 (3.1%) |
| $50,000 to $99,999 | 38 (6.6%) | 39 (2.5%) |
| $100,000 to $299,999 | 160 (27.7%) | 618 (40.2%) |
| $300,000 to $499,999 | 166 (28.7%) | 787 (51.1%) |
| $500,000 to $749,999 | 0 (0.0%) | 37 (2.4%) |
| $750,000 to $999,999 | 26 (4.5%) | 0 (0.0%) |
| $1,000,000 or more | 14 (2.4%) | 10 (0.6%) |
| Total | 578 (100.0%) | 1,539 (100.0%) |
Household Income by Mortgage Status in Kerman
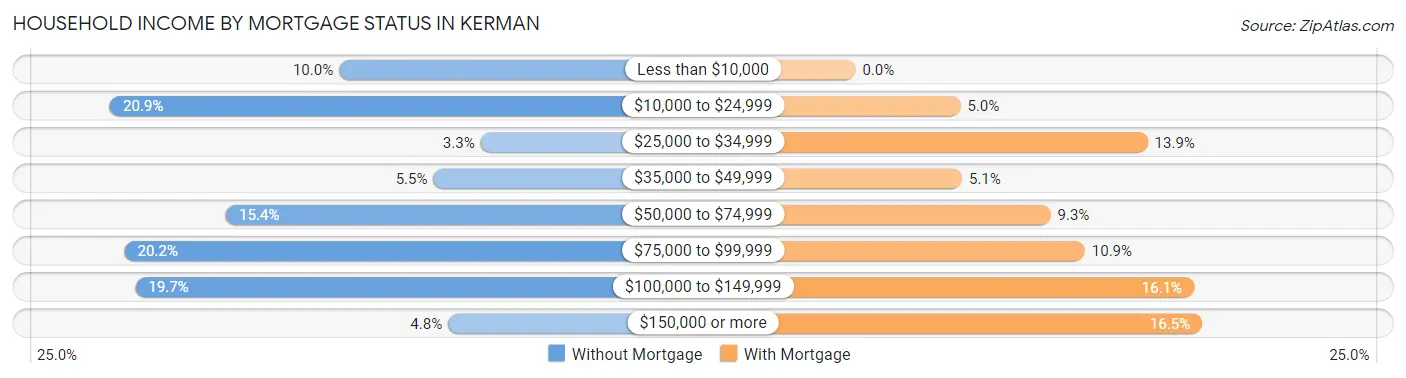
| Household Income | Without Mortgage | With Mortgage |
| Less than $10,000 | 58 (10.0%) | 0 (0.0%) |
| $10,000 to $24,999 | 121 (20.9%) | 77 (5.0%) |
| $25,000 to $34,999 | 19 (3.3%) | 214 (13.9%) |
| $35,000 to $49,999 | 32 (5.5%) | 78 (5.1%) |
| $50,000 to $74,999 | 89 (15.4%) | 143 (9.3%) |
| $75,000 to $99,999 | 117 (20.2%) | 168 (10.9%) |
| $100,000 to $149,999 | 114 (19.7%) | 248 (16.1%) |
| $150,000 or more | 28 (4.8%) | 254 (16.5%) |
| Total | 578 (100.0%) | 1,539 (100.0%) |
Property Value to Household Income Ratio in Kerman
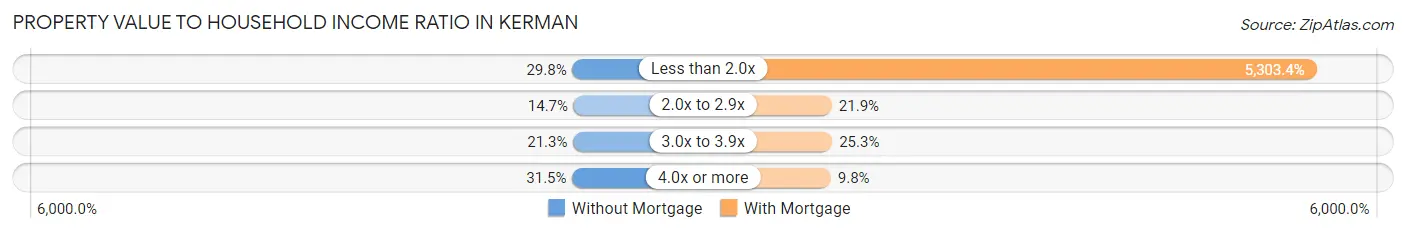
| Value-to-Income Ratio | Without Mortgage | With Mortgage |
| Less than 2.0x | 172 (29.8%) | 81,619 (5,303.4%) |
| 2.0x to 2.9x | 85 (14.7%) | 337 (21.9%) |
| 3.0x to 3.9x | 123 (21.3%) | 389 (25.3%) |
| 4.0x or more | 182 (31.5%) | 151 (9.8%) |
| Total | 578 (100.0%) | 1,539 (100.0%) |
Real Estate Taxes by Mortgage Status in Kerman
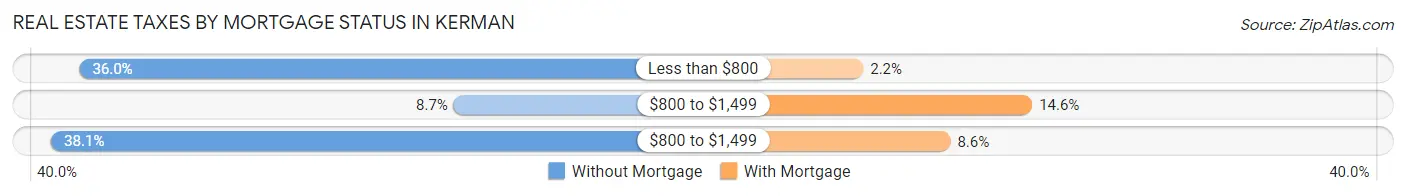
| Property Taxes | Without Mortgage | With Mortgage |
| Less than $800 | 208 (36.0%) | 34 (2.2%) |
| $800 to $1,499 | 50 (8.6%) | 224 (14.5%) |
| $800 to $1,499 | 220 (38.1%) | 132 (8.6%) |
| Total | 578 (100.0%) | 1,539 (100.0%) |
Health & Disability in Kerman
Health Insurance Coverage by Age in Kerman
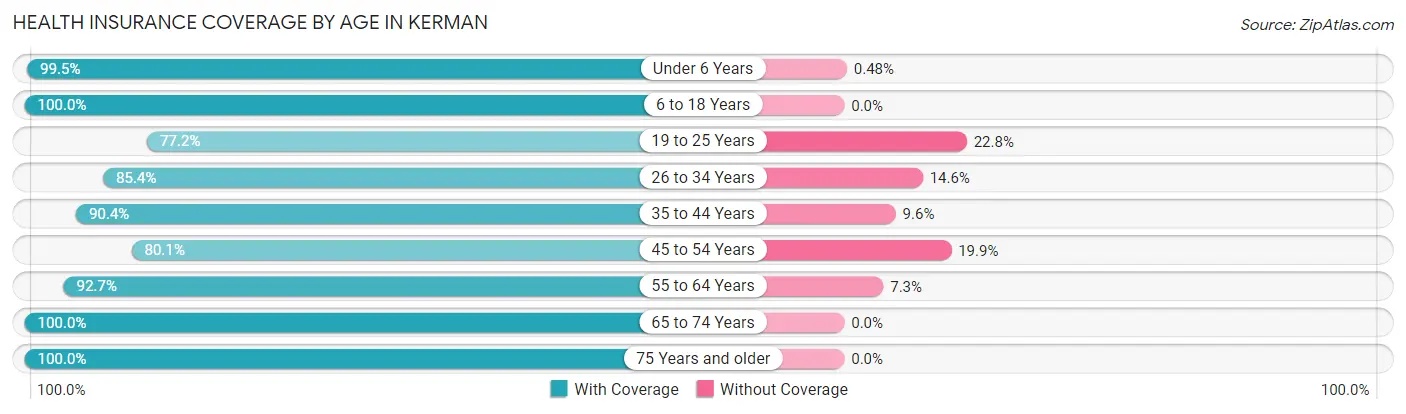
| Age Bracket | With Coverage | Without Coverage |
| Under 6 Years | 1,455 (99.5%) | 7 (0.5%) |
| 6 to 18 Years | 3,979 (100.0%) | 0 (0.0%) |
| 19 to 25 Years | 1,447 (77.2%) | 428 (22.8%) |
| 26 to 34 Years | 1,694 (85.4%) | 290 (14.6%) |
| 35 to 44 Years | 1,917 (90.4%) | 203 (9.6%) |
| 45 to 54 Years | 1,514 (80.1%) | 377 (19.9%) |
| 55 to 64 Years | 1,340 (92.7%) | 105 (7.3%) |
| 65 to 74 Years | 907 (100.0%) | 0 (0.0%) |
| 75 Years and older | 312 (100.0%) | 0 (0.0%) |
| Total | 14,565 (91.2%) | 1,410 (8.8%) |
Health Insurance Coverage by Citizenship Status in Kerman
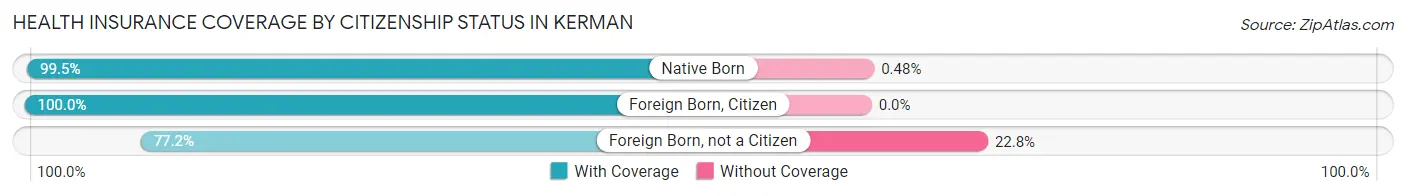
| Citizenship Status | With Coverage | Without Coverage |
| Native Born | 1,455 (99.5%) | 7 (0.5%) |
| Foreign Born, Citizen | 3,979 (100.0%) | 0 (0.0%) |
| Foreign Born, not a Citizen | 1,447 (77.2%) | 428 (22.8%) |
Health Insurance Coverage by Household Income in Kerman
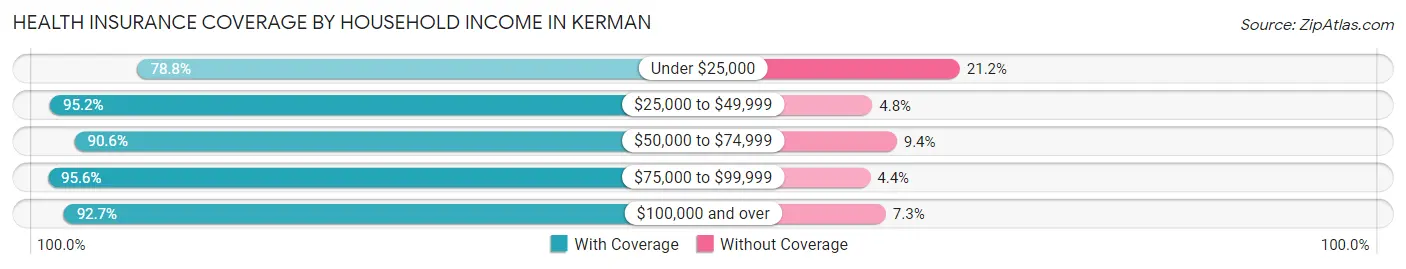
| Household Income | With Coverage | Without Coverage |
| Under $25,000 | 1,946 (78.8%) | 523 (21.2%) |
| $25,000 to $49,999 | 3,735 (95.2%) | 188 (4.8%) |
| $50,000 to $74,999 | 2,244 (90.6%) | 232 (9.4%) |
| $75,000 to $99,999 | 1,755 (95.6%) | 81 (4.4%) |
| $100,000 and over | 4,881 (92.7%) | 386 (7.3%) |
Public vs Private Health Insurance Coverage by Age in Kerman
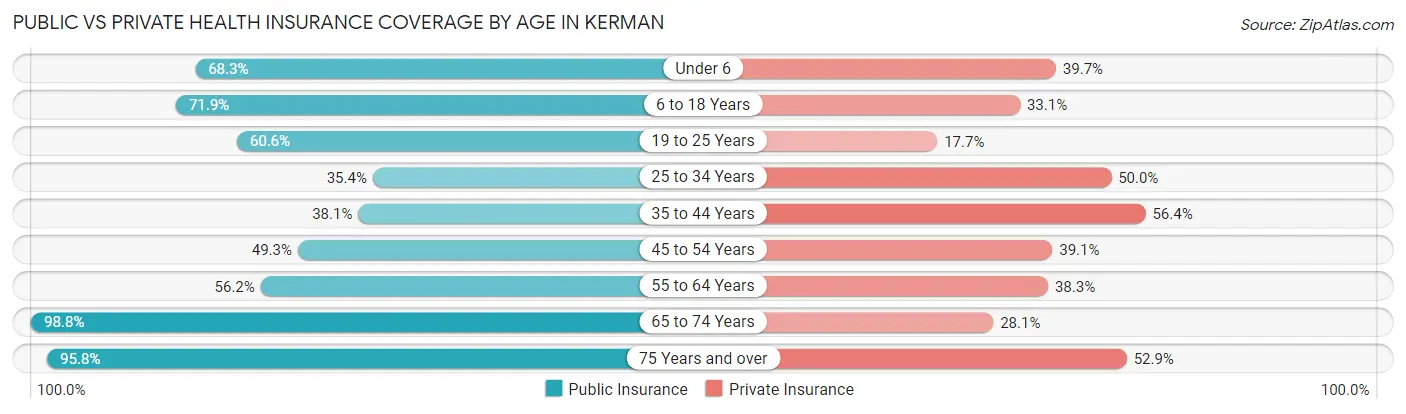
| Age Bracket | Public Insurance | Private Insurance |
| Under 6 | 999 (68.3%) | 581 (39.7%) |
| 6 to 18 Years | 2,861 (71.9%) | 1,316 (33.1%) |
| 19 to 25 Years | 1,136 (60.6%) | 332 (17.7%) |
| 25 to 34 Years | 702 (35.4%) | 992 (50.0%) |
| 35 to 44 Years | 807 (38.1%) | 1,195 (56.4%) |
| 45 to 54 Years | 932 (49.3%) | 739 (39.1%) |
| 55 to 64 Years | 812 (56.2%) | 553 (38.3%) |
| 65 to 74 Years | 896 (98.8%) | 255 (28.1%) |
| 75 Years and over | 299 (95.8%) | 165 (52.9%) |
| Total | 9,444 (59.1%) | 6,128 (38.4%) |
Disability Status by Sex by Age in Kerman
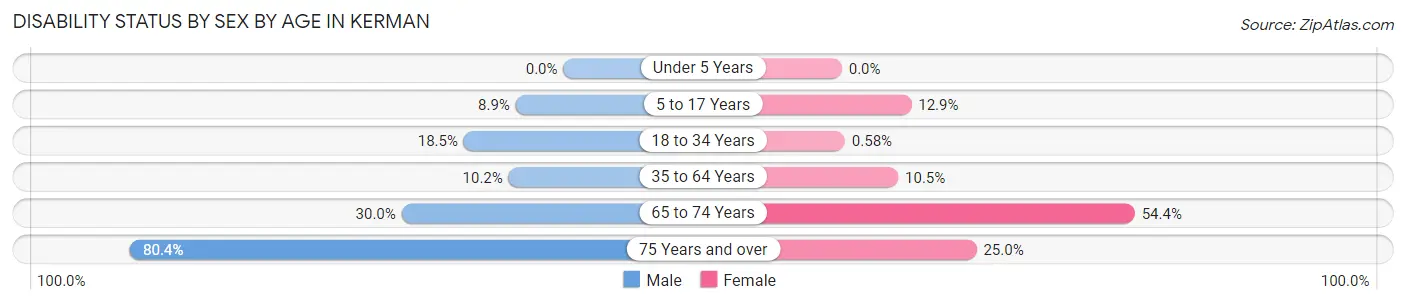
| Age Bracket | Male | Female |
| Under 5 Years | 0 (0.0%) | 0 (0.0%) |
| 5 to 17 Years | 174 (8.8%) | 264 (12.9%) |
| 18 to 34 Years | 364 (18.5%) | 12 (0.6%) |
| 35 to 64 Years | 286 (10.2%) | 276 (10.4%) |
| 65 to 74 Years | 121 (30.0%) | 274 (54.4%) |
| 75 Years and over | 119 (80.4%) | 41 (25.0%) |
Disability Class by Sex by Age in Kerman
Disability Class: Hearing Difficulty
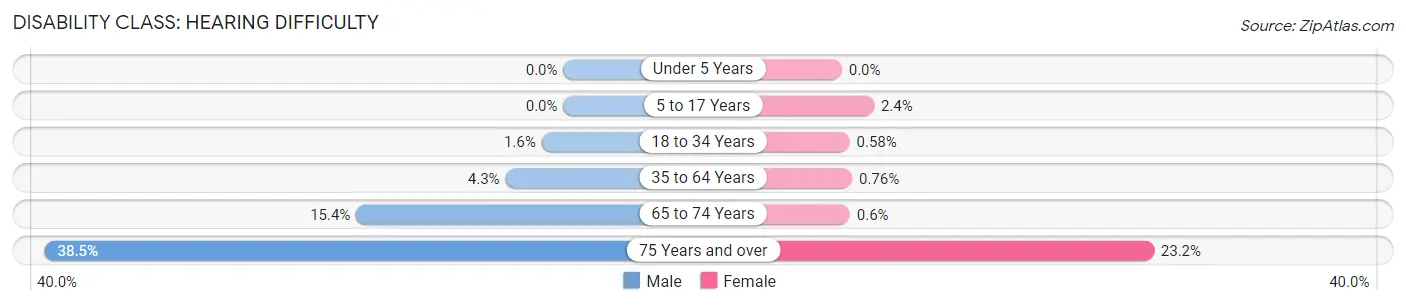
| Age Bracket | Male | Female |
| Under 5 Years | 0 (0.0%) | 0 (0.0%) |
| 5 to 17 Years | 0 (0.0%) | 49 (2.4%) |
| 18 to 34 Years | 32 (1.6%) | 12 (0.6%) |
| 35 to 64 Years | 121 (4.3%) | 20 (0.8%) |
| 65 to 74 Years | 62 (15.4%) | 3 (0.6%) |
| 75 Years and over | 57 (38.5%) | 38 (23.2%) |
Disability Class: Vision Difficulty
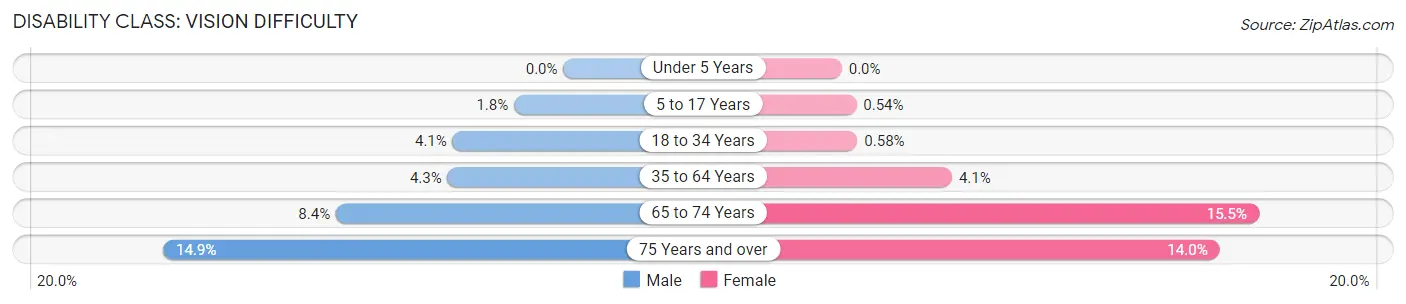
| Age Bracket | Male | Female |
| Under 5 Years | 0 (0.0%) | 0 (0.0%) |
| 5 to 17 Years | 36 (1.8%) | 11 (0.5%) |
| 18 to 34 Years | 81 (4.1%) | 12 (0.6%) |
| 35 to 64 Years | 121 (4.3%) | 108 (4.1%) |
| 65 to 74 Years | 34 (8.4%) | 78 (15.5%) |
| 75 Years and over | 22 (14.9%) | 23 (14.0%) |
Disability Class: Cognitive Difficulty
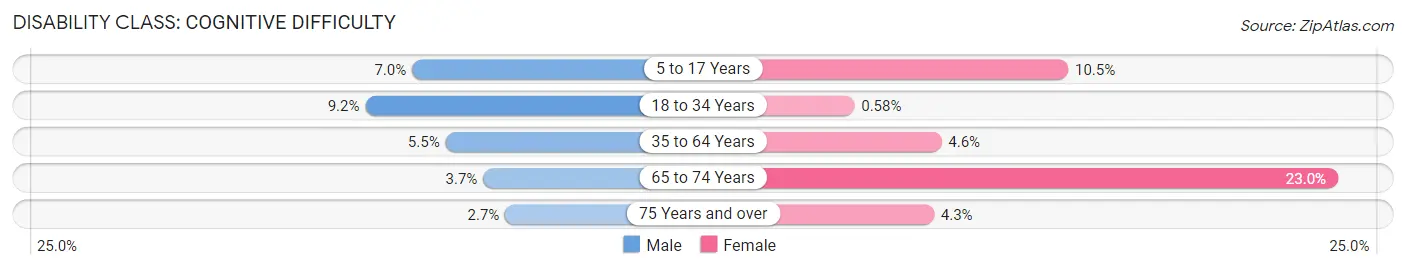
| Age Bracket | Male | Female |
| 5 to 17 Years | 138 (7.0%) | 215 (10.5%) |
| 18 to 34 Years | 181 (9.2%) | 12 (0.6%) |
| 35 to 64 Years | 154 (5.5%) | 122 (4.6%) |
| 65 to 74 Years | 15 (3.7%) | 116 (23.0%) |
| 75 Years and over | 4 (2.7%) | 7 (4.3%) |
Disability Class: Ambulatory Difficulty
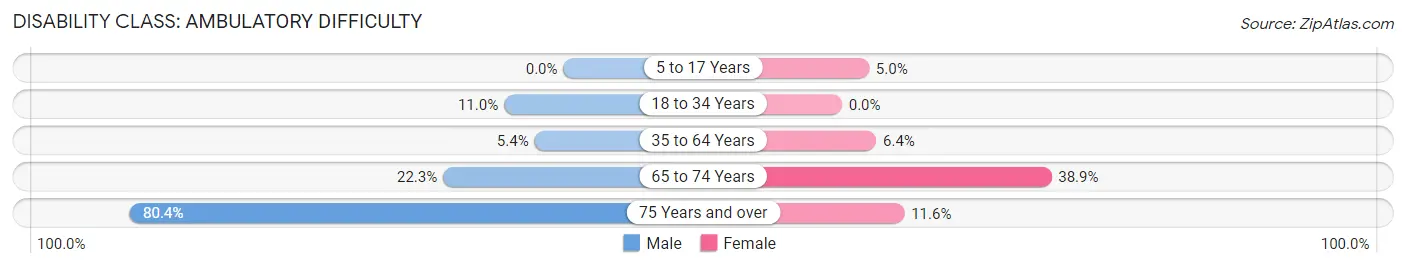
| Age Bracket | Male | Female |
| 5 to 17 Years | 0 (0.0%) | 103 (5.0%) |
| 18 to 34 Years | 217 (11.0%) | 0 (0.0%) |
| 35 to 64 Years | 151 (5.4%) | 168 (6.4%) |
| 65 to 74 Years | 90 (22.3%) | 196 (38.9%) |
| 75 Years and over | 119 (80.4%) | 19 (11.6%) |
Disability Class: Self-Care Difficulty
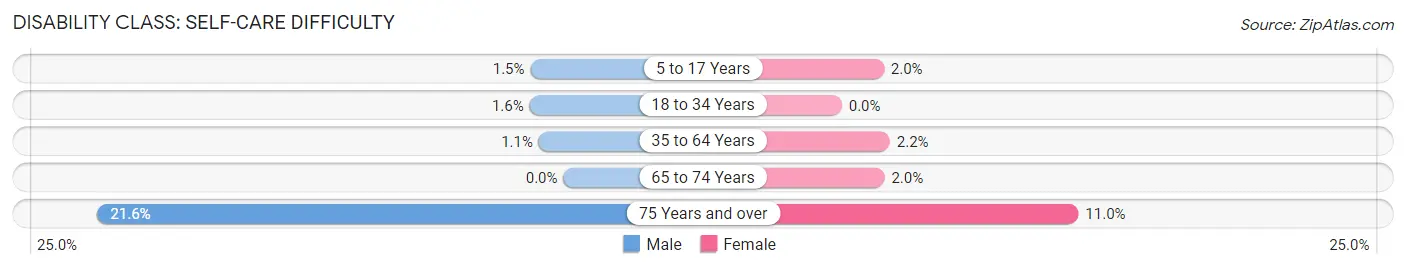
| Age Bracket | Male | Female |
| 5 to 17 Years | 30 (1.5%) | 40 (1.9%) |
| 18 to 34 Years | 31 (1.6%) | 0 (0.0%) |
| 35 to 64 Years | 32 (1.1%) | 59 (2.2%) |
| 65 to 74 Years | 0 (0.0%) | 10 (2.0%) |
| 75 Years and over | 32 (21.6%) | 18 (11.0%) |
Technology Access in Kerman
Computing Device Access in Kerman
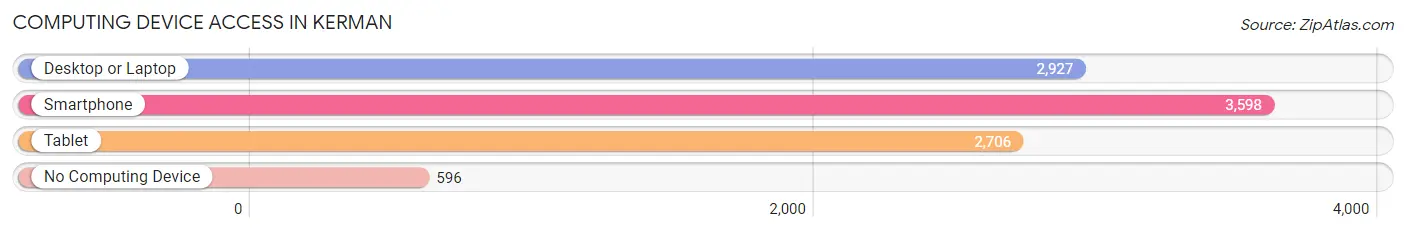
| Device Type | # Households | % Households |
| Desktop or Laptop | 2,927 | 65.8% |
| Smartphone | 3,598 | 80.9% |
| Tablet | 2,706 | 60.9% |
| No Computing Device | 596 | 13.4% |
| Total | 4,446 | 100.0% |
Internet Access in Kerman
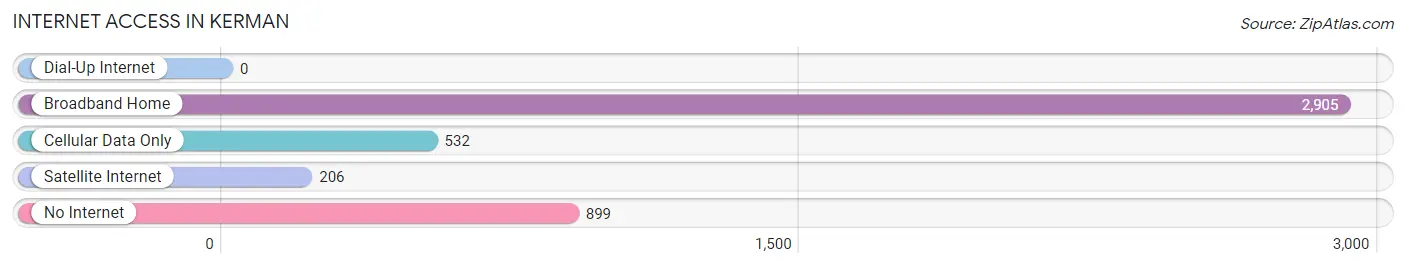
| Internet Type | # Households | % Households |
| Dial-Up Internet | 0 | 0.0% |
| Broadband Home | 2,905 | 65.3% |
| Cellular Data Only | 532 | 12.0% |
| Satellite Internet | 206 | 4.6% |
| No Internet | 899 | 20.2% |
| Total | 4,446 | 100.0% |
Kerman Summary
Kerman is a city located in Fresno County, California, United States. It is situated in the San Joaquin Valley, approximately 30 miles west of Fresno, at an elevation of 220 feet. The population was 13,544 at the 2010 census. Kerman is known for its agricultural production, particularly of cotton, almonds, and pistachios.
History
Kerman was founded in 1891 by the Southern Pacific Railroad. The city was named after the Kerman family, who were early settlers in the area. The Kerman post office opened in 1891.
In the early 1900s, Kerman was a major stop on the Southern Pacific Railroad. The city was also home to a large cotton gin, which was the largest in the world at the time.
Geography
Kerman is located at 36°44'17" North, 120°2'17" West (36.738, -120.038). According to the United States Census Bureau, the city has a total area of 2.3 square miles, all of it land.
Economy
Kerman is a major agricultural center in the San Joaquin Valley. The city is known for its production of cotton, almonds, and pistachios. Other crops grown in the area include grapes, tomatoes, and melons.
Kerman is also home to several manufacturing companies, including a large food processing plant and a furniture factory.
Demographics
As of the census of 2010, there were 13,544 people, 4,717 households, and 3,541 families residing in the city. The population density was 5,890.3 people per square mile. The racial makeup of the city was 57.2% White, 1.2% African American, 1.2% Native American, 0.7% Asian, 0.1% Pacific Islander, 36.3% from other races, and 3.3% from two or more races. Hispanic or Latino of any race were 63.2% of the population.
The median income for a household in the city was $37,917, and the median income for a family was $45,917. Males had a median income of $35,917 versus $27,917 for females. The per capita income for the city was $17,917. About 16.2% of families and 19.2% of the population were below the poverty line, including 25.2% of those under age 18 and 11.2% of those age 65 or over.
Kerman is served by the Kerman Unified School District, which includes four elementary schools, one middle school, and one high school. The city is also home to a branch of the Fresno County Library.
Common Questions
What is Per Capita Income in Kerman?
Per Capita income in Kerman is $21,308.
What is the Median Family Income in Kerman?
Median Family Income in Kerman is $58,234.
What is the Median Household income in Kerman?
Median Household Income in Kerman is $53,956.
What is Income or Wage Gap in Kerman?
Income or Wage Gap in Kerman is 33.8%.
Women in Kerman earn 66.2 cents for every dollar earned by a man.
What is Family Income Deficit in Kerman?
Family Income Deficit in Kerman is $10,623.
Families that are below poverty line in Kerman earn $10,623 less on average than the poverty threshold level.
What is Inequality or Gini Index in Kerman?
Inequality or Gini Index in Kerman is 0.46.
What is the Total Population of Kerman?
Total Population of Kerman is 15,980.
What is the Total Male Population of Kerman?
Total Male Population of Kerman is 7,891.
What is the Total Female Population of Kerman?
Total Female Population of Kerman is 8,089.
What is the Ratio of Males per 100 Females in Kerman?
There are 97.55 Males per 100 Females in Kerman.
What is the Ratio of Females per 100 Males in Kerman?
There are 102.51 Females per 100 Males in Kerman.
What is the Median Population Age in Kerman?
Median Population Age in Kerman is 27.8 Years.
What is the Average Family Size in Kerman
Average Family Size in Kerman is 4.0 People.
What is the Average Household Size in Kerman
Average Household Size in Kerman is 3.6 People.
How Large is the Labor Force in Kerman?
There are 6,912 People in the Labor Forcein in Kerman.
What is the Percentage of People in the Labor Force in Kerman?
61.1% of People are in the Labor Force in Kerman.
What is the Unemployment Rate in Kerman?
Unemployment Rate in Kerman is 12.8%.