Zip Codes with the Highest Percentage of Population with a Degree in Liberal Arts and History in Grass Valley, CA
RELATED REPORTS & OPTIONS
Liberal Arts and History
Grass Valley
Compare Zip Codes
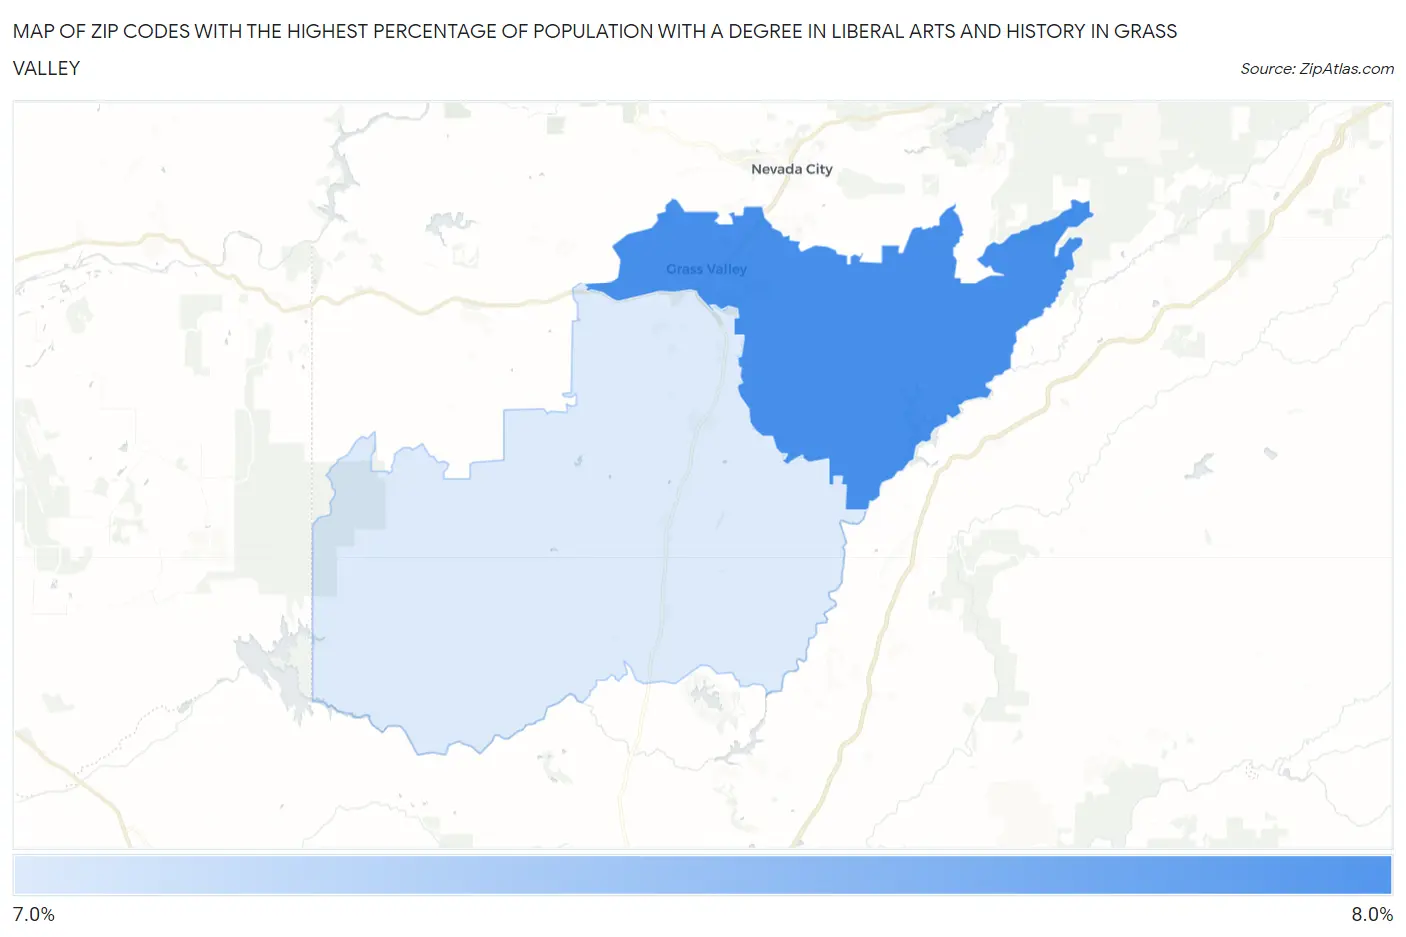
Map of Zip Codes with the Highest Percentage of Population with a Degree in Liberal Arts and History in Grass Valley
7.0%
7.4%
Zip Codes with the Highest Percentage of Population with a Degree in Liberal Arts and History in Grass Valley, CA
| Zip Code | % Graduates | vs State | vs National | |
| 1. | 95945 | 7.4% | 5.5%(+1.93)#474 | 4.9%(+2.56)#5,695 |
| 2. | 95949 | 7.0% | 5.5%(+1.53)#535 | 4.9%(+2.16)#6,342 |
1
Common Questions
What are the Top Zip Codes with the Highest Percentage of Population with a Degree in Liberal Arts and History in Grass Valley, CA?
Top Zip Codes with the Highest Percentage of Population with a Degree in Liberal Arts and History in Grass Valley, CA are:
What zip code has the Highest Percentage of Population with a Degree in Liberal Arts and History in Grass Valley, CA?
95945 has the Highest Percentage of Population with a Degree in Liberal Arts and History in Grass Valley, CA with 7.4%.
What is the Percentage of Population with a Degree in Liberal Arts and History in Grass Valley, CA?
Percentage of Population with a Degree in Liberal Arts and History in Grass Valley is 6.8%.
What is the Percentage of Population with a Degree in Liberal Arts and History in California?
Percentage of Population with a Degree in Liberal Arts and History in California is 5.5%.
What is the Percentage of Population with a Degree in Liberal Arts and History in the United States?
Percentage of Population with a Degree in Liberal Arts and History in the United States is 4.9%.