Allensworth, CA Map & Demographics
Allensworth Map
Allensworth Overview
$12,198
PER CAPITA INCOME
$49,276
AVG FAMILY INCOME
$53,500
AVG HOUSEHOLD INCOME
4.9%
WAGE / INCOME GAP [ % ]
95.1¢/ $1
WAGE / INCOME GAP [ $ ]
0.31
INEQUALITY / GINI INDEX
459
TOTAL POPULATION
239
MALE POPULATION
220
FEMALE POPULATION
108.64
MALES / 100 FEMALES
92.05
FEMALES / 100 MALES
25.2
MEDIAN AGE
4.3
AVG FAMILY SIZE
4.4
AVG HOUSEHOLD SIZE
199
LABOR FORCE [ PEOPLE ]
61.2%
PERCENT IN LABOR FORCE
25.1%
UNEMPLOYMENT RATE
Income in Allensworth
Income Overview in Allensworth
Per Capita Income in Allensworth is $12,198, while median incomes of families and households are $49,276 and $53,500 respectively.
| Characteristic | Number | Measure |
| Per Capita Income | 459 | $12,198 |
| Median Family Income | 93 | $49,276 |
| Mean Family Income | 93 | $47,478 |
| Median Household Income | 104 | $53,500 |
| Mean Household Income | 104 | $51,176 |
| Income Deficit | 93 | $0 |
| Wage / Income Gap (%) | 459 | 4.90% |
| Wage / Income Gap ($) | 459 | 95.10¢ per $1 |
| Gini / Inequality Index | 459 | 0.31 |
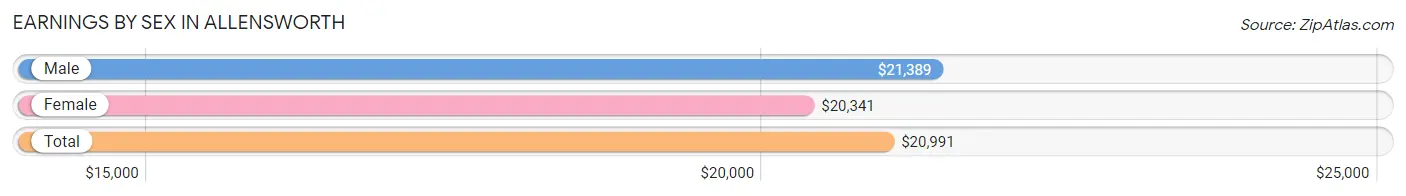
Earnings by Sex in Allensworth
Average Earnings in Allensworth are $20,991, $21,389 for men and $20,341 for women, a difference of 4.9%.
| Sex | Number | Average Earnings |
| Male | 118 (60.5%) | $21,389 |
| Female | 77 (39.5%) | $20,341 |
| Total | 195 (100.0%) | $20,991 |
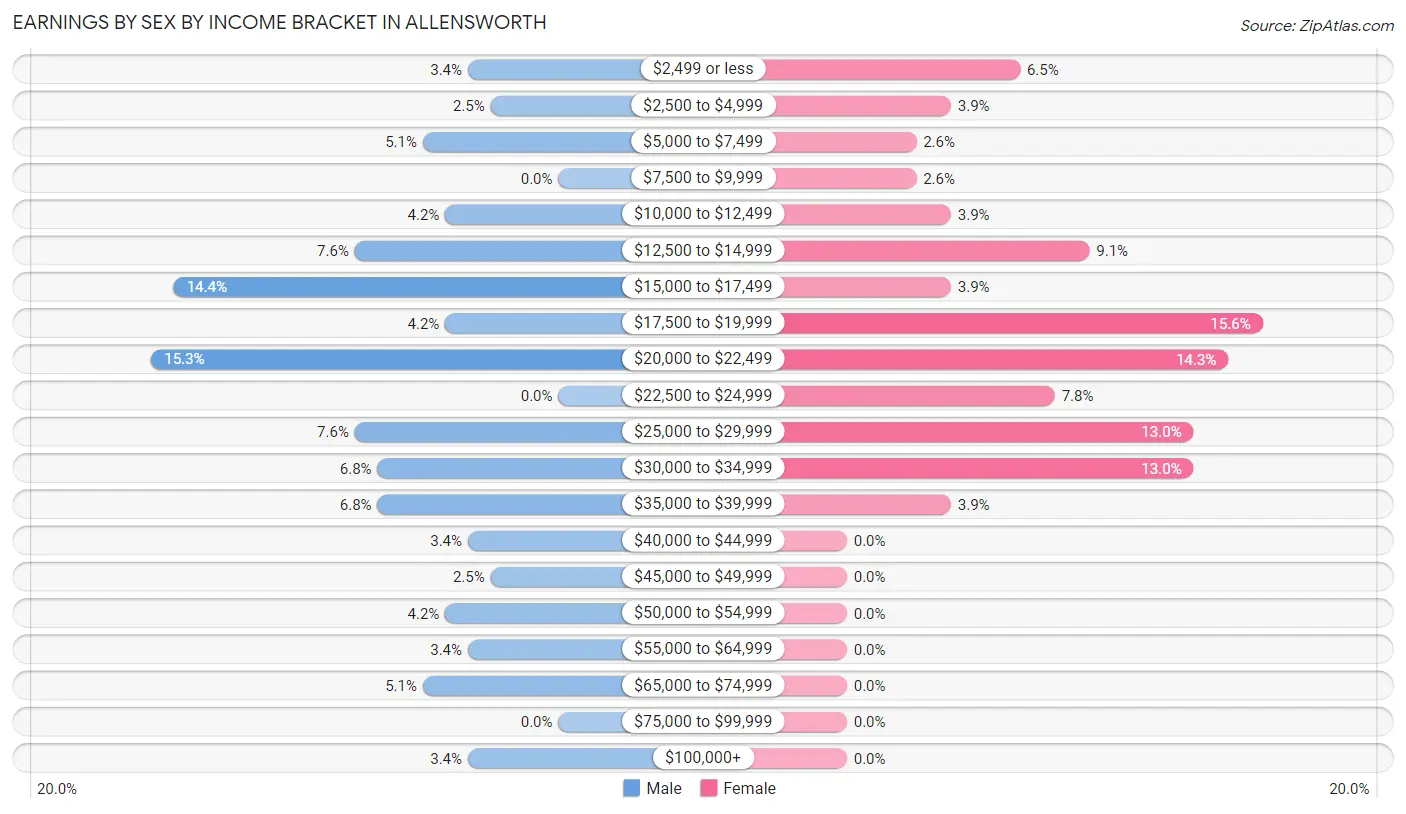
Earnings by Sex by Income Bracket in Allensworth
The most common earnings brackets in Allensworth are $20,000 to $22,499 for men (18 | 15.2%) and $17,500 to $19,999 for women (12 | 15.6%).
| Income | Male | Female |
| $2,499 or less | 4 (3.4%) | 5 (6.5%) |
| $2,500 to $4,999 | 3 (2.5%) | 3 (3.9%) |
| $5,000 to $7,499 | 6 (5.1%) | 2 (2.6%) |
| $7,500 to $9,999 | 0 (0.0%) | 2 (2.6%) |
| $10,000 to $12,499 | 5 (4.2%) | 3 (3.9%) |
| $12,500 to $14,999 | 9 (7.6%) | 7 (9.1%) |
| $15,000 to $17,499 | 17 (14.4%) | 3 (3.9%) |
| $17,500 to $19,999 | 5 (4.2%) | 12 (15.6%) |
| $20,000 to $22,499 | 18 (15.2%) | 11 (14.3%) |
| $22,500 to $24,999 | 0 (0.0%) | 6 (7.8%) |
| $25,000 to $29,999 | 9 (7.6%) | 10 (13.0%) |
| $30,000 to $34,999 | 8 (6.8%) | 10 (13.0%) |
| $35,000 to $39,999 | 8 (6.8%) | 3 (3.9%) |
| $40,000 to $44,999 | 4 (3.4%) | 0 (0.0%) |
| $45,000 to $49,999 | 3 (2.5%) | 0 (0.0%) |
| $50,000 to $54,999 | 5 (4.2%) | 0 (0.0%) |
| $55,000 to $64,999 | 4 (3.4%) | 0 (0.0%) |
| $65,000 to $74,999 | 6 (5.1%) | 0 (0.0%) |
| $75,000 to $99,999 | 0 (0.0%) | 0 (0.0%) |
| $100,000+ | 4 (3.4%) | 0 (0.0%) |
| Total | 118 (100.0%) | 77 (100.0%) |
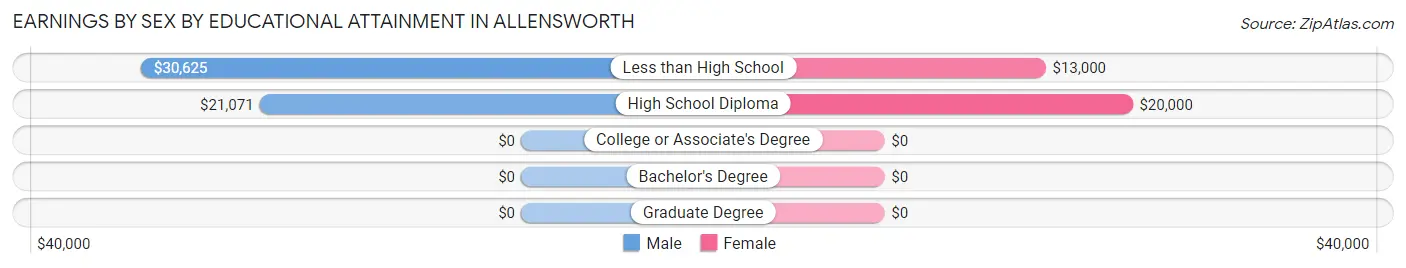
Earnings by Sex by Educational Attainment in Allensworth
Average earnings in Allensworth are $21,875 for men and $19,688 for women, a difference of 10.0%. Men with an educational attainment of less than high school enjoy the highest average annual earnings of $30,625, while those with high school diploma education earn the least with $21,071. Women with an educational attainment of high school diploma earn the most with the average annual earnings of $20,000, while those with less than high school education have the smallest earnings of $13,000.
| Educational Attainment | Male Income | Female Income |
| Less than High School | $30,625 | $13,000 |
| High School Diploma | $21,071 | $20,000 |
| College or Associate's Degree | - | - |
| Bachelor's Degree | - | - |
| Graduate Degree | - | - |
| Total | $21,875 | $19,688 |
Family Income in Allensworth
Family Income Brackets in Allensworth
According to the Allensworth family income data, there are 29 families falling into the $50,000 to $74,999 income range, which is the most common income bracket and makes up 31.2% of all families.
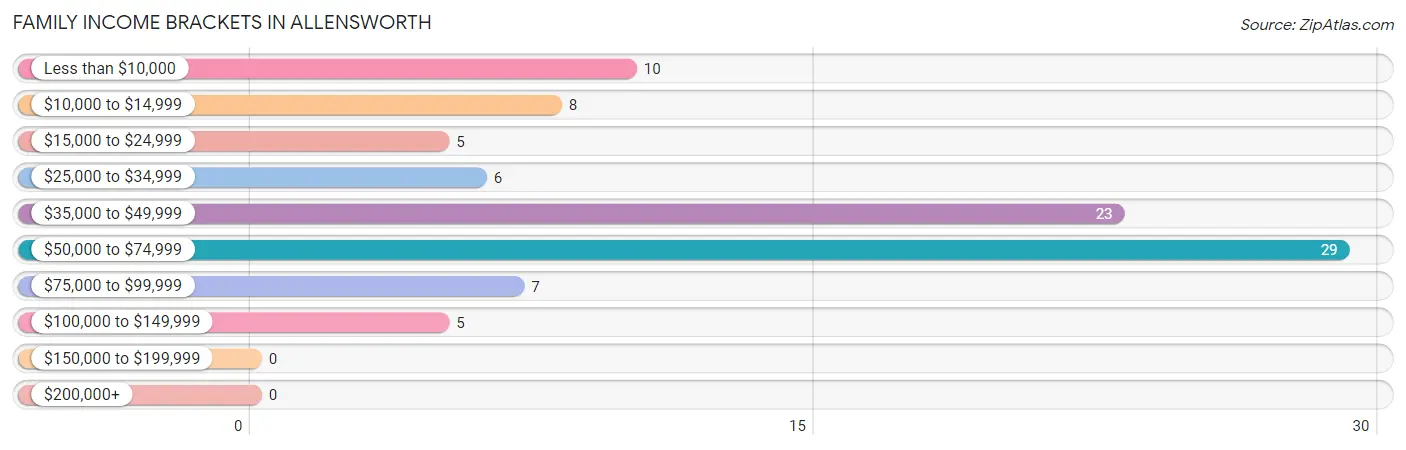
| Income Bracket | # Families | % Families |
| Less than $10,000 | 10 | 10.8% |
| $10,000 to $14,999 | 8 | 8.6% |
| $15,000 to $24,999 | 5 | 5.4% |
| $25,000 to $34,999 | 6 | 6.5% |
| $35,000 to $49,999 | 23 | 24.7% |
| $50,000 to $74,999 | 29 | 31.2% |
| $75,000 to $99,999 | 7 | 7.5% |
| $100,000 to $149,999 | 5 | 5.4% |
| $150,000 to $199,999 | 0 | 0.0% |
| $200,000+ | 0 | 0.0% |
Family Income by Famaliy Size in Allensworth
6-person families (17 | 18.3%) account for the highest median family income in Allensworth with $68,438 per family, while 3-person families (27 | 29.0%) have the highest median income of $16,224 per family member.
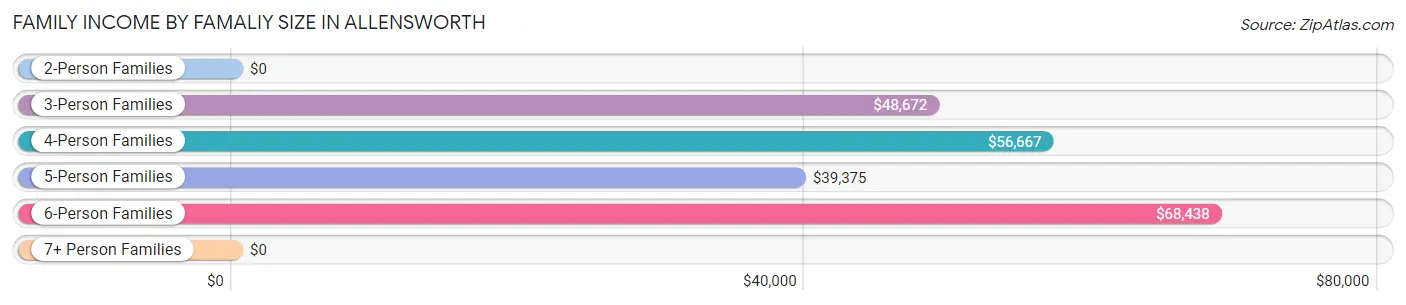
| Income Bracket | # Families | Median Income |
| 2-Person Families | 19 (20.4%) | $0 |
| 3-Person Families | 27 (29.0%) | $48,672 |
| 4-Person Families | 20 (21.5%) | $56,667 |
| 5-Person Families | 7 (7.5%) | $39,375 |
| 6-Person Families | 17 (18.3%) | $68,438 |
| 7+ Person Families | 3 (3.2%) | $0 |
| Total | 93 (100.0%) | $49,276 |
Family Income by Number of Earners in Allensworth
The median family income in Allensworth is $49,276, with families comprising 3+ earners (13) having the highest median family income of $81,875, while families with no earners (12) have the lowest median family income of $2,499, accounting for 14.0% and 12.9% of families, respectively.
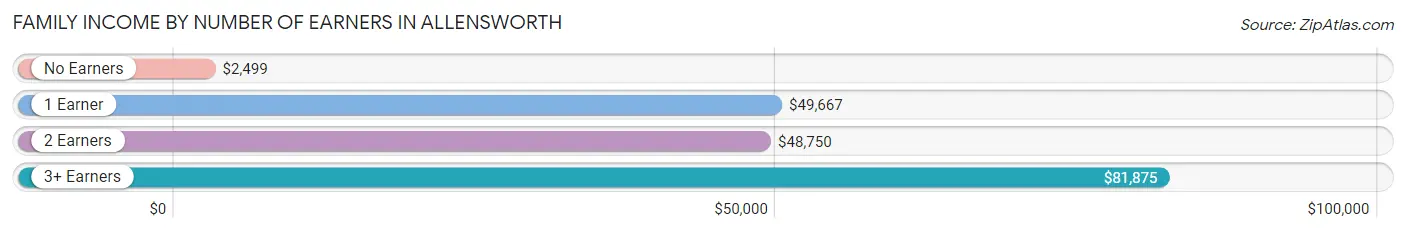
| Number of Earners | # Families | Median Income |
| No Earners | 12 (12.9%) | $2,499 |
| 1 Earner | 48 (51.6%) | $49,667 |
| 2 Earners | 20 (21.5%) | $48,750 |
| 3+ Earners | 13 (14.0%) | $81,875 |
| Total | 93 (100.0%) | $49,276 |
Household Income in Allensworth
Household Income Brackets in Allensworth
With 44 households falling in the category, the $50,000 to $74,999 income range is the most frequent in Allensworth, accounting for 42.3% of all households.
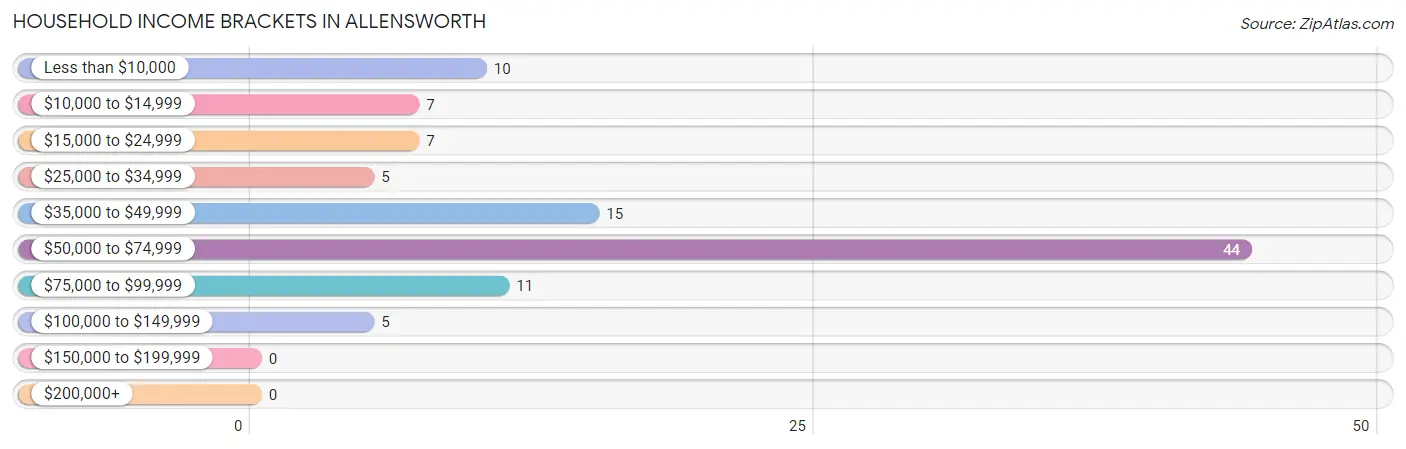
| Income Bracket | # Households | % Households |
| Less than $10,000 | 10 | 9.6% |
| $10,000 to $14,999 | 7 | 6.7% |
| $15,000 to $24,999 | 7 | 6.7% |
| $25,000 to $34,999 | 5 | 4.8% |
| $35,000 to $49,999 | 15 | 14.4% |
| $50,000 to $74,999 | 44 | 42.3% |
| $75,000 to $99,999 | 11 | 10.6% |
| $100,000 to $149,999 | 5 | 4.8% |
| $150,000 to $199,999 | 0 | 0.0% |
| $200,000+ | 0 | 0.0% |
Household Income by Householder Age in Allensworth
The median household income in Allensworth is $53,500, with the highest median household income of $58,750 found in the 45 to 64 years age bracket for the primary householder. A total of 37 households (35.6%) fall into this category.
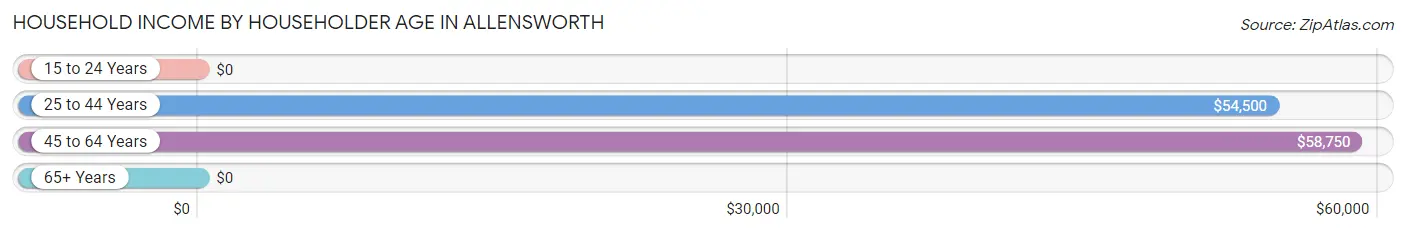
| Income Bracket | # Households | Median Income |
| 15 to 24 Years | 0 (0.0%) | $0 |
| 25 to 44 Years | 56 (53.8%) | $54,500 |
| 45 to 64 Years | 37 (35.6%) | $58,750 |
| 65+ Years | 11 (10.6%) | $0 |
| Total | 104 (100.0%) | $53,500 |
Poverty in Allensworth
Income Below Poverty by Sex and Age in Allensworth
With 25.1% poverty level for males and 35.0% for females among the residents of Allensworth, under 5 year old males and 6 to 11 year old females are the most vulnerable to poverty, with 6 males (50.0%) and 22 females (71.0%) in their respective age groups living below the poverty level.
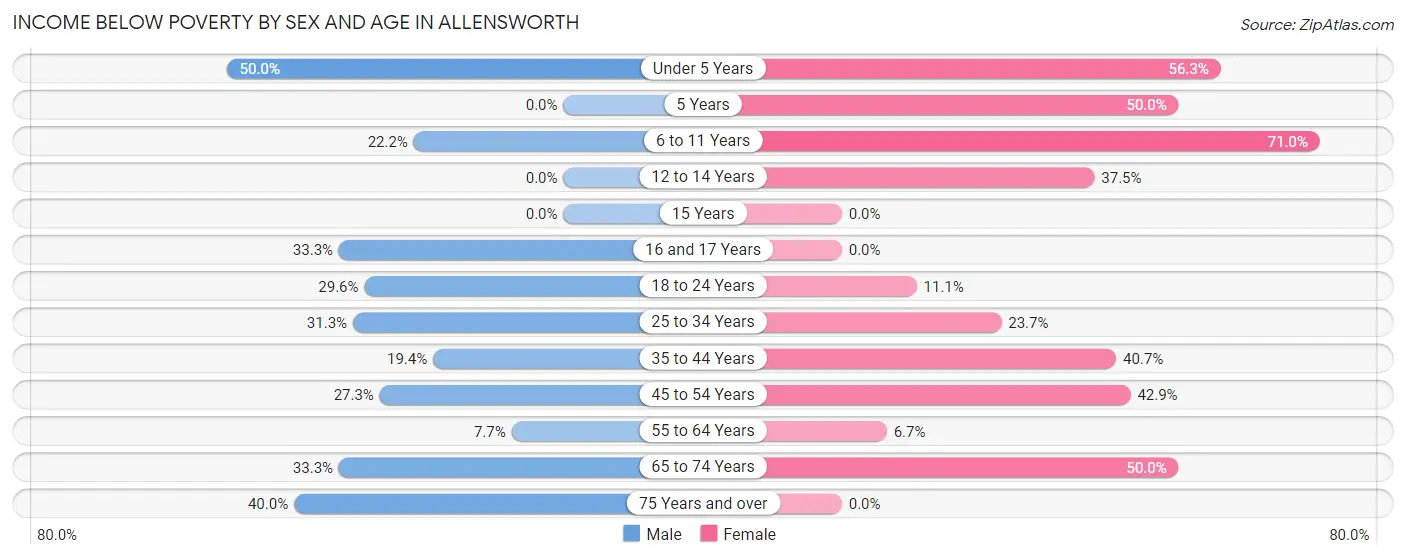
| Age Bracket | Male | Female |
| Under 5 Years | 6 (50.0%) | 9 (56.2%) |
| 5 Years | 0 (0.0%) | 3 (50.0%) |
| 6 to 11 Years | 10 (22.2%) | 22 (71.0%) |
| 12 to 14 Years | 0 (0.0%) | 6 (37.5%) |
| 15 Years | 0 (0.0%) | 0 (0.0%) |
| 16 and 17 Years | 2 (33.3%) | 0 (0.0%) |
| 18 to 24 Years | 13 (29.5%) | 4 (11.1%) |
| 25 to 34 Years | 10 (31.2%) | 9 (23.7%) |
| 35 to 44 Years | 6 (19.4%) | 11 (40.7%) |
| 45 to 54 Years | 6 (27.3%) | 9 (42.9%) |
| 55 to 64 Years | 2 (7.7%) | 1 (6.7%) |
| 65 to 74 Years | 3 (33.3%) | 3 (50.0%) |
| 75 Years and over | 2 (40.0%) | 0 (0.0%) |
| Total | 60 (25.1%) | 77 (35.0%) |
Income Above Poverty by Sex and Age in Allensworth
According to the poverty statistics in Allensworth, males aged 12 to 14 years and females aged 15 years are the age groups that are most secure financially, with 100.0% of males and 100.0% of females in these age groups living above the poverty line.
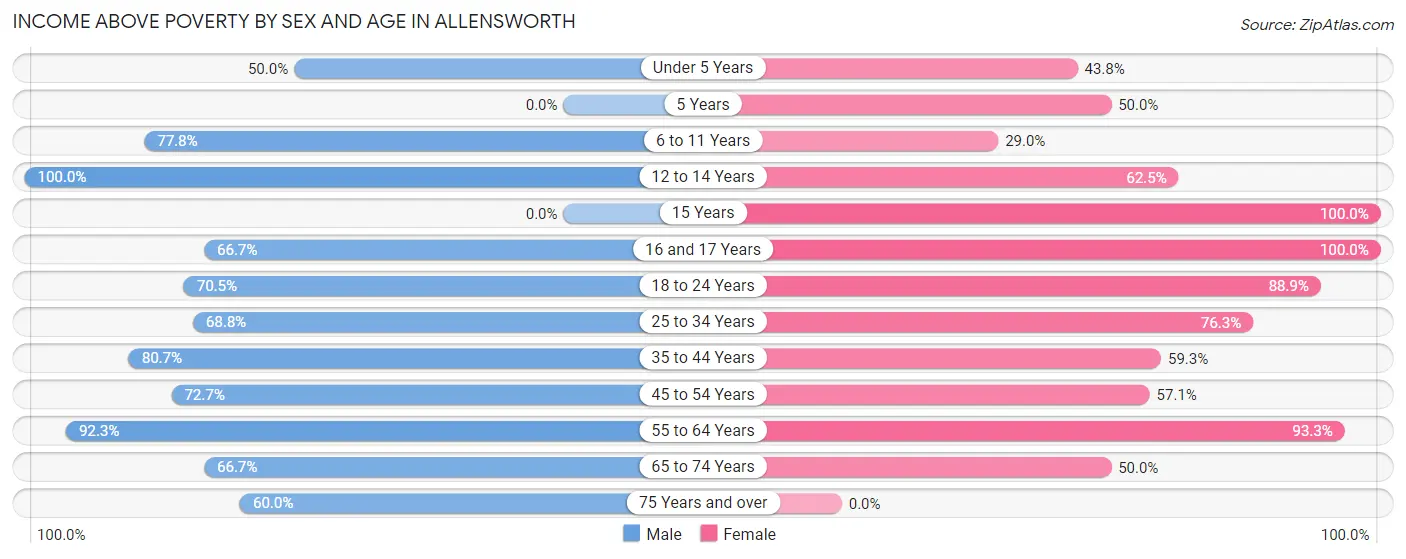
| Age Bracket | Male | Female |
| Under 5 Years | 6 (50.0%) | 7 (43.8%) |
| 5 Years | 0 (0.0%) | 3 (50.0%) |
| 6 to 11 Years | 35 (77.8%) | 9 (29.0%) |
| 12 to 14 Years | 7 (100.0%) | 10 (62.5%) |
| 15 Years | 0 (0.0%) | 1 (100.0%) |
| 16 and 17 Years | 4 (66.7%) | 7 (100.0%) |
| 18 to 24 Years | 31 (70.5%) | 32 (88.9%) |
| 25 to 34 Years | 22 (68.8%) | 29 (76.3%) |
| 35 to 44 Years | 25 (80.6%) | 16 (59.3%) |
| 45 to 54 Years | 16 (72.7%) | 12 (57.1%) |
| 55 to 64 Years | 24 (92.3%) | 14 (93.3%) |
| 65 to 74 Years | 6 (66.7%) | 3 (50.0%) |
| 75 Years and over | 3 (60.0%) | 0 (0.0%) |
| Total | 179 (74.9%) | 143 (65.0%) |
Income Below Poverty Among Married-Couple Families in Allensworth
The poverty statistics for married-couple families in Allensworth show that 14.3% or 7 of the total 49 families live below the poverty line. Families with no children have the highest poverty rate of 25.0%, comprising of 7 families. On the other hand, families with 1 or 2 children have the lowest poverty rate of 0.0%, which includes 0 families.
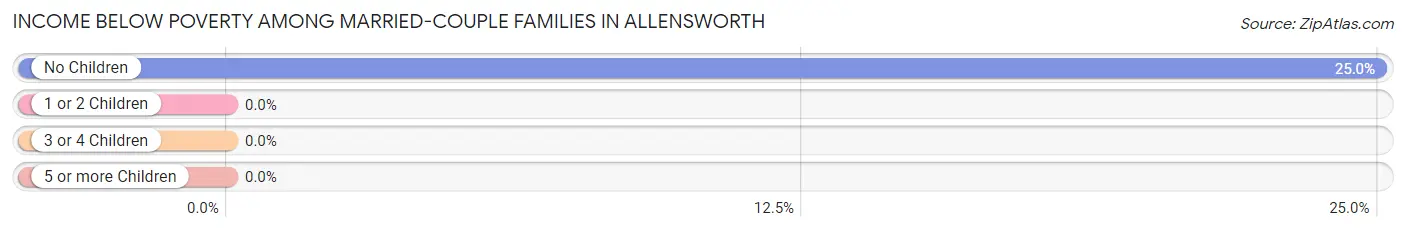
| Children | Above Poverty | Below Poverty |
| No Children | 21 (75.0%) | 7 (25.0%) |
| 1 or 2 Children | 17 (100.0%) | 0 (0.0%) |
| 3 or 4 Children | 4 (100.0%) | 0 (0.0%) |
| 5 or more Children | 0 (0.0%) | 0 (0.0%) |
| Total | 42 (85.7%) | 7 (14.3%) |
Income Below Poverty Among Single-Parent Households in Allensworth
According to the poverty data in Allensworth, 46.2% or 6 single-father households and 38.7% or 12 single-mother households are living below the poverty line. Among single-father households, those with 5 or more children have the highest poverty rate, with 3 households (100.0%) experiencing poverty. Likewise, among single-mother households, those with 5 or more children have the highest poverty rate, with 3 households (100.0%) falling below the poverty line.
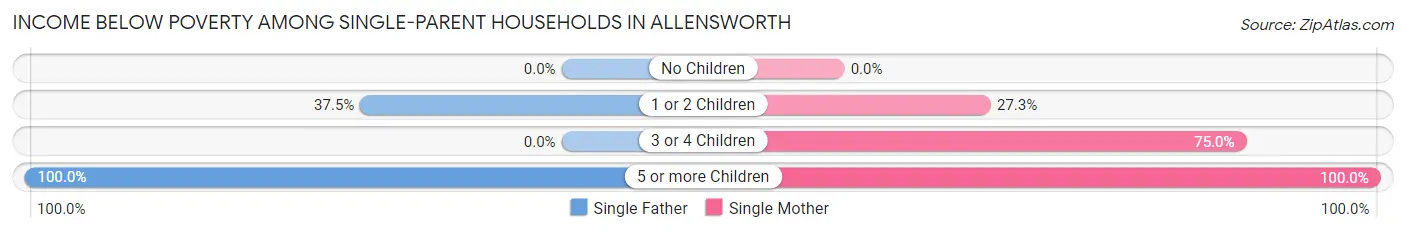
| Children | Single Father | Single Mother |
| No Children | 0 (0.0%) | 0 (0.0%) |
| 1 or 2 Children | 3 (37.5%) | 6 (27.3%) |
| 3 or 4 Children | 0 (0.0%) | 3 (75.0%) |
| 5 or more Children | 3 (100.0%) | 3 (100.0%) |
| Total | 6 (46.2%) | 12 (38.7%) |
Income Below Poverty Among Married-Couple vs Single-Parent Households in Allensworth
The poverty data for Allensworth shows that 7 of the married-couple family households (14.3%) and 18 of the single-parent households (40.9%) are living below the poverty level. Within the married-couple family households, those with no children have the highest poverty rate, with 7 households (25.0%) falling below the poverty line. Among the single-parent households, those with 5 or more children have the highest poverty rate, with 6 household (100.0%) living below poverty.
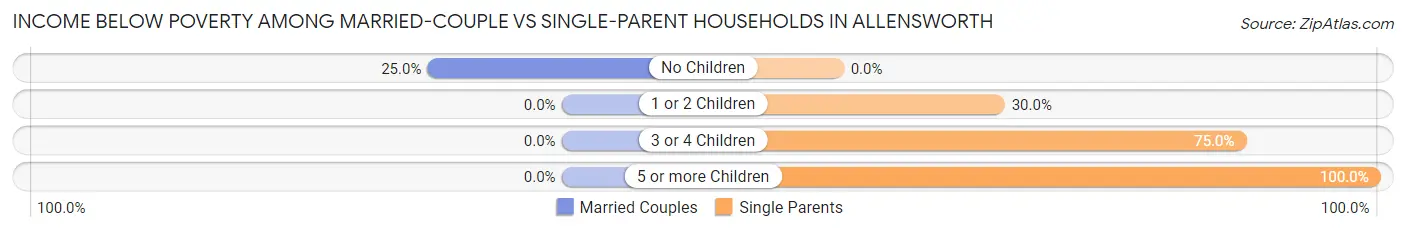
| Children | Married-Couple Families | Single-Parent Households |
| No Children | 7 (25.0%) | 0 (0.0%) |
| 1 or 2 Children | 0 (0.0%) | 9 (30.0%) |
| 3 or 4 Children | 0 (0.0%) | 3 (75.0%) |
| 5 or more Children | 0 (0.0%) | 6 (100.0%) |
| Total | 7 (14.3%) | 18 (40.9%) |
Race in Allensworth
The most populous races in Allensworth are Hispanic or Latino (441 | 96.1%), White / Caucasian (170 | 37.0%), and Some other Race (157 | 34.2%).
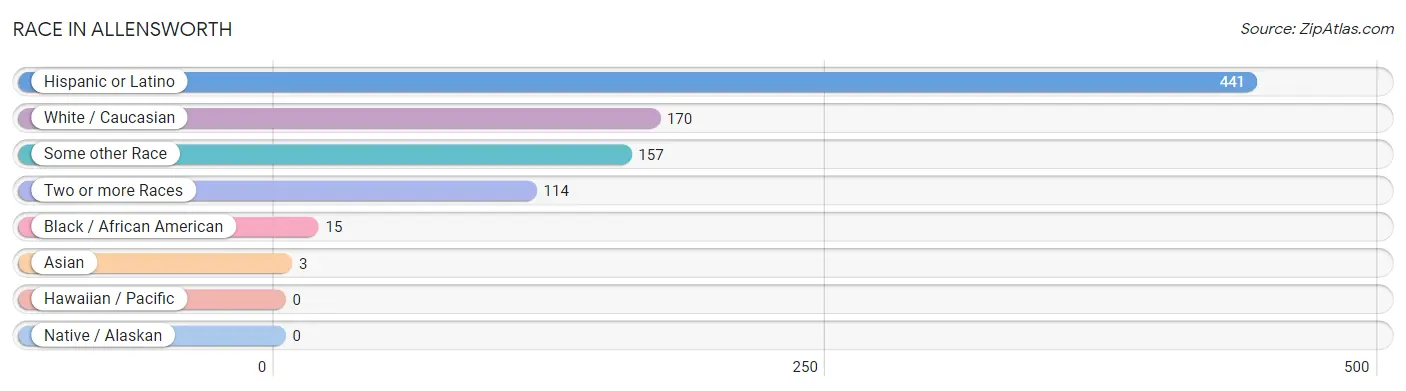
| Race | # Population | % Population |
| Asian | 3 | 0.6% |
| Black / African American | 15 | 3.3% |
| Hawaiian / Pacific | 0 | 0.0% |
| Hispanic or Latino | 441 | 96.1% |
| Native / Alaskan | 0 | 0.0% |
| White / Caucasian | 170 | 37.0% |
| Two or more Races | 114 | 24.8% |
| Some other Race | 157 | 34.2% |
| Total | 459 | 100.0% |
Ancestry in Allensworth
The most populous ancestries reported in Allensworth are Mexican (424 | 92.4%), Central American (17 | 3.7%), Honduran (9 | 2.0%), Korean (9 | 2.0%), and Panamanian (8 | 1.7%), together accounting for 101.7% of all Allensworth residents.
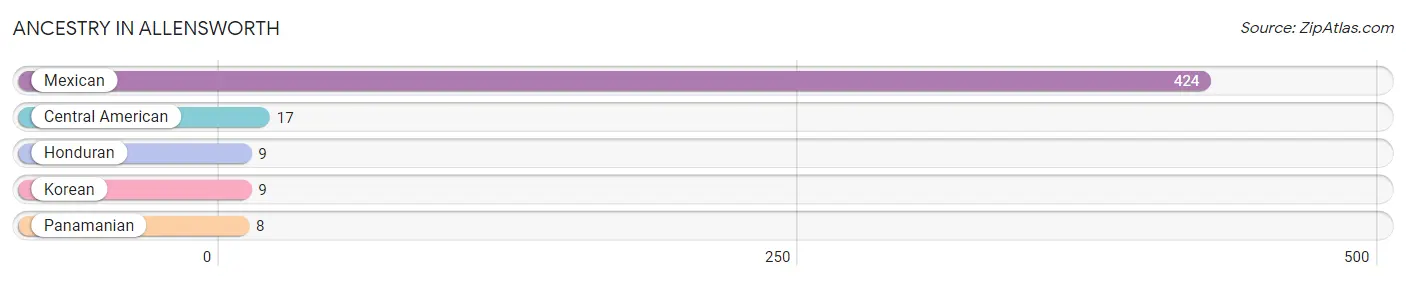
| Ancestry | # Population | % Population |
| Central American | 17 | 3.7% |
| Honduran | 9 | 2.0% |
| Korean | 9 | 2.0% |
| Mexican | 424 | 92.4% |
| Panamanian | 8 | 1.7% | View All 5 Rows |
Immigrants in Allensworth
The most numerous immigrant groups reported in Allensworth came from Central America (163 | 35.5%), Latin America (163 | 35.5%), Mexico (148 | 32.2%), Honduras (11 | 2.4%), and Panama (4 | 0.9%), together accounting for 106.5% of all Allensworth residents.
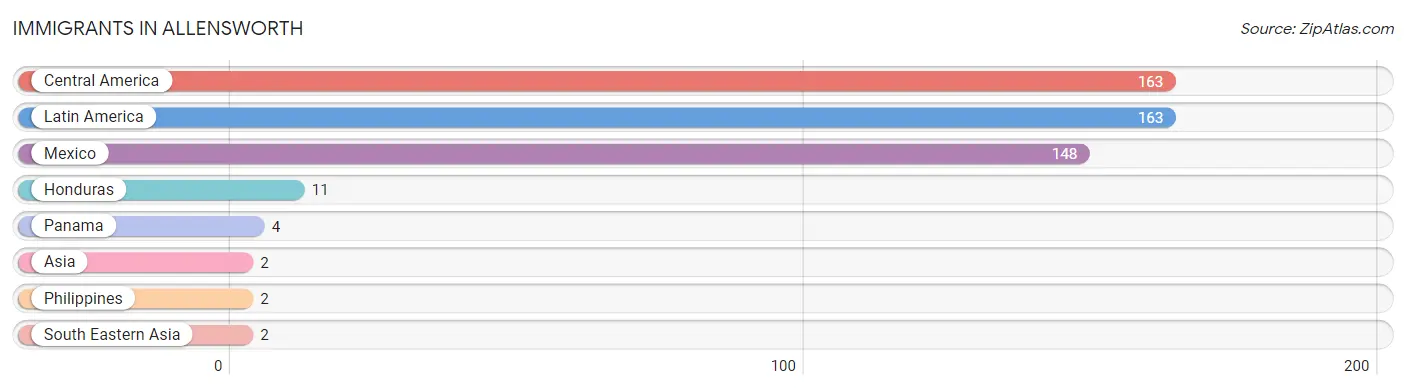
| Immigration Origin | # Population | % Population |
| Asia | 2 | 0.4% |
| Central America | 163 | 35.5% |
| Honduras | 11 | 2.4% |
| Latin America | 163 | 35.5% |
| Mexico | 148 | 32.2% |
| Panama | 4 | 0.9% |
| Philippines | 2 | 0.4% |
| South Eastern Asia | 2 | 0.4% | View All 8 Rows |
Sex and Age in Allensworth
Sex and Age in Allensworth
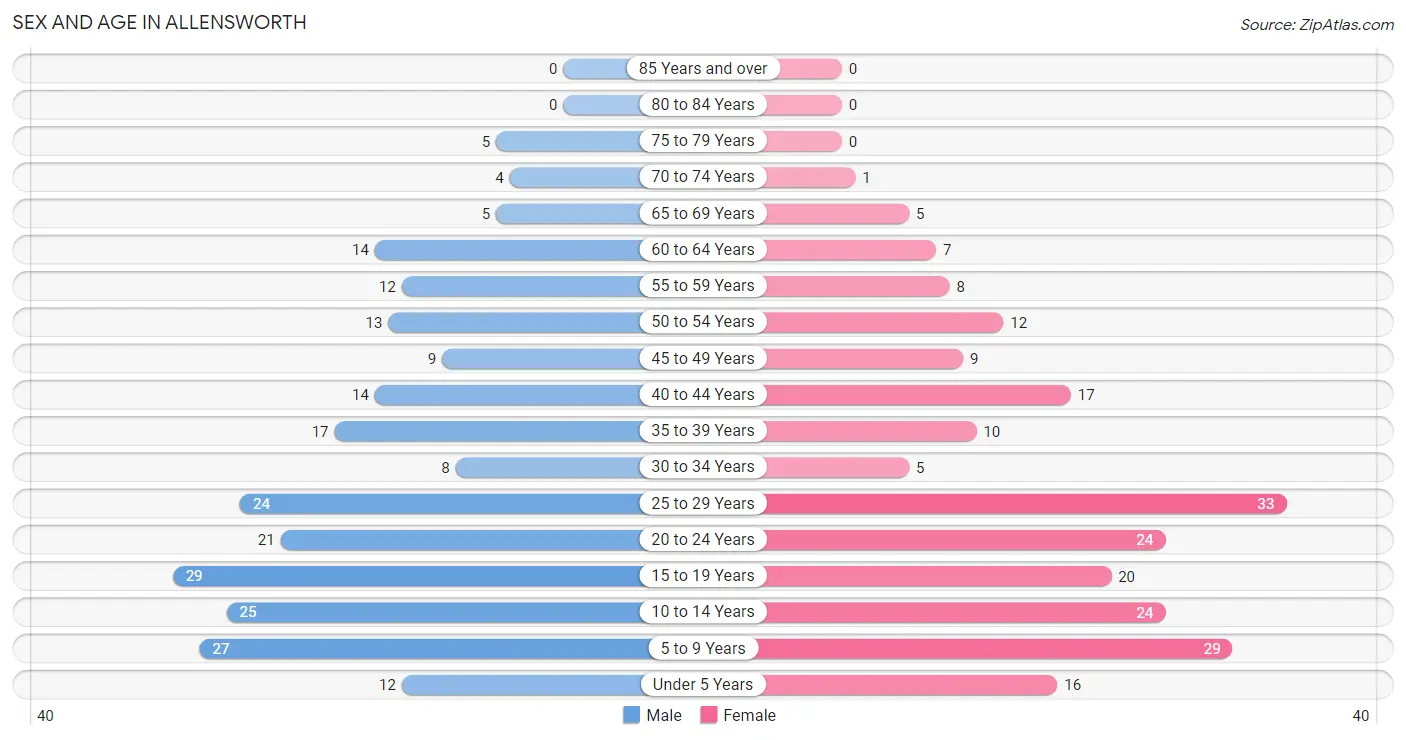
The most populous age groups in Allensworth are 15 to 19 Years (29 | 12.1%) for men and 25 to 29 Years (33 | 15.0%) for women.
| Age Bracket | Male | Female |
| Under 5 Years | 12 (5.0%) | 16 (7.3%) |
| 5 to 9 Years | 27 (11.3%) | 29 (13.2%) |
| 10 to 14 Years | 25 (10.5%) | 24 (10.9%) |
| 15 to 19 Years | 29 (12.1%) | 20 (9.1%) |
| 20 to 24 Years | 21 (8.8%) | 24 (10.9%) |
| 25 to 29 Years | 24 (10.0%) | 33 (15.0%) |
| 30 to 34 Years | 8 (3.4%) | 5 (2.3%) |
| 35 to 39 Years | 17 (7.1%) | 10 (4.5%) |
| 40 to 44 Years | 14 (5.9%) | 17 (7.7%) |
| 45 to 49 Years | 9 (3.8%) | 9 (4.1%) |
| 50 to 54 Years | 13 (5.4%) | 12 (5.4%) |
| 55 to 59 Years | 12 (5.0%) | 8 (3.6%) |
| 60 to 64 Years | 14 (5.9%) | 7 (3.2%) |
| 65 to 69 Years | 5 (2.1%) | 5 (2.3%) |
| 70 to 74 Years | 4 (1.7%) | 1 (0.4%) |
| 75 to 79 Years | 5 (2.1%) | 0 (0.0%) |
| 80 to 84 Years | 0 (0.0%) | 0 (0.0%) |
| 85 Years and over | 0 (0.0%) | 0 (0.0%) |
| Total | 239 (100.0%) | 220 (100.0%) |
Families and Households in Allensworth
Median Family Size in Allensworth
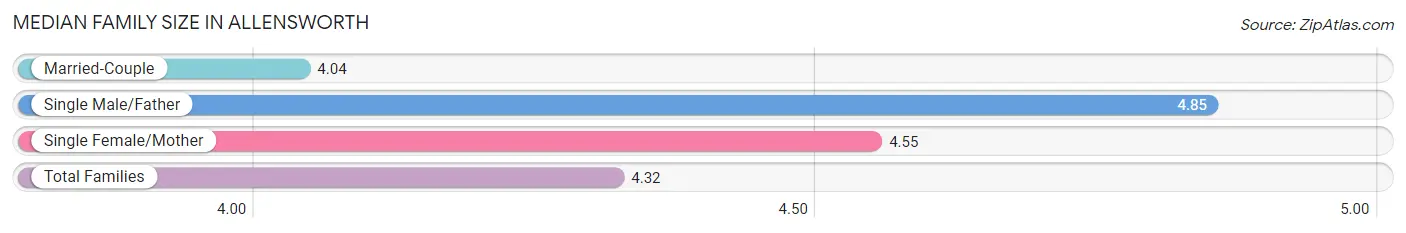
The median family size in Allensworth is 4.32 persons per family, with single male/father families (13 | 14.0%) accounting for the largest median family size of 4.85 persons per family. On the other hand, married-couple families (49 | 52.7%) represent the smallest median family size with 4.04 persons per family.
| Family Type | # Families | Family Size |
| Married-Couple | 49 (52.7%) | 4.04 |
| Single Male/Father | 13 (14.0%) | 4.85 |
| Single Female/Mother | 31 (33.3%) | 4.55 |
| Total Families | 93 (100.0%) | 4.32 |
Median Household Size in Allensworth
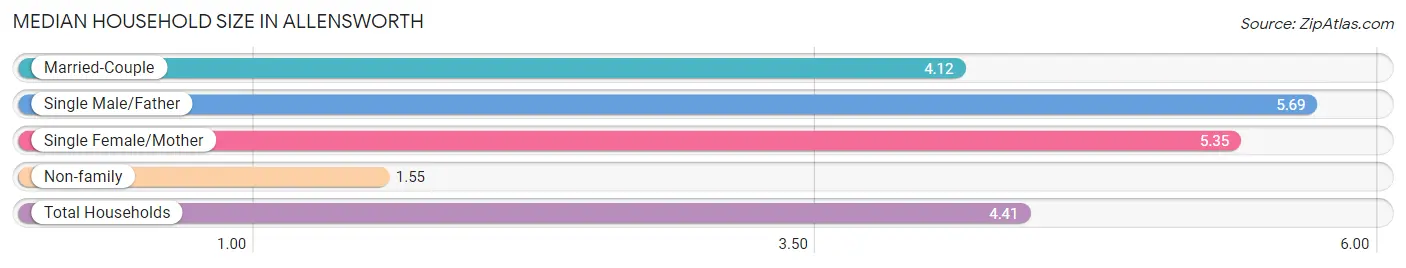
The median household size in Allensworth is 4.41 persons per household, with single male/father households (13 | 12.5%) accounting for the largest median household size of 5.69 persons per household. non-family households (11 | 10.6%) represent the smallest median household size with 1.55 persons per household.
| Household Type | # Households | Household Size |
| Married-Couple | 49 (47.1%) | 4.12 |
| Single Male/Father | 13 (12.5%) | 5.69 |
| Single Female/Mother | 31 (29.8%) | 5.35 |
| Non-family | 11 (10.6%) | 1.55 |
| Total Households | 104 (100.0%) | 4.41 |
Household Size by Marriage Status in Allensworth
Out of a total of 104 households in Allensworth, 93 (89.4%) are family households, while 11 (10.6%) are nonfamily households. The most numerous type of family households are 4-person households, comprising 28, and the most common type of nonfamily households are 1-person households, comprising 6.
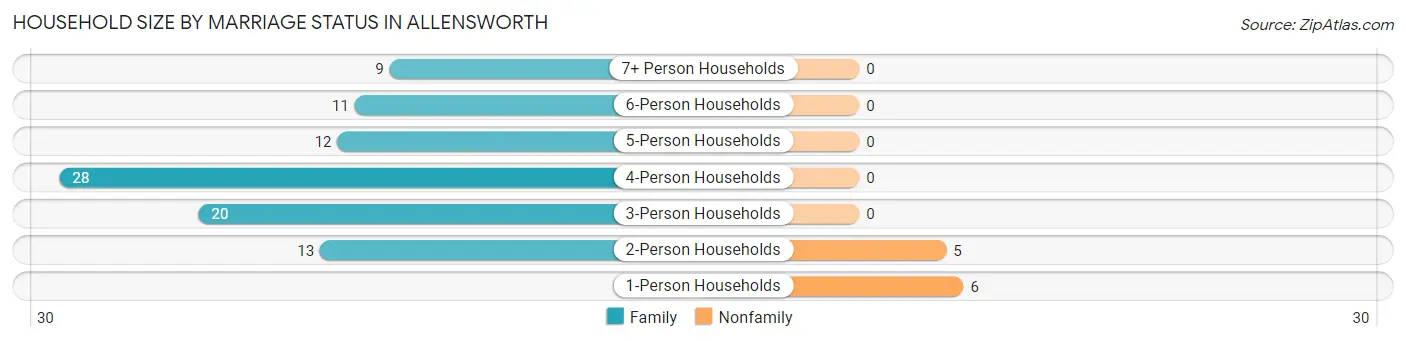
| Household Size | Family Households | Nonfamily Households |
| 1-Person Households | - | 6 (5.8%) |
| 2-Person Households | 13 (12.5%) | 5 (4.8%) |
| 3-Person Households | 20 (19.2%) | 0 (0.0%) |
| 4-Person Households | 28 (26.9%) | 0 (0.0%) |
| 5-Person Households | 12 (11.5%) | 0 (0.0%) |
| 6-Person Households | 11 (10.6%) | 0 (0.0%) |
| 7+ Person Households | 9 (8.6%) | 0 (0.0%) |
| Total | 93 (89.4%) | 11 (10.6%) |
Female Fertility in Allensworth
Fertility by Age in Allensworth
Average fertility rate in Allensworth is 81.0 births per 1,000 women. Women in the age bracket of 20 to 34 years have the highest fertility rate with 145.0 births per 1,000 women. Women in the age bracket of 20 to 34 years acount for 90.0% of all women with births.
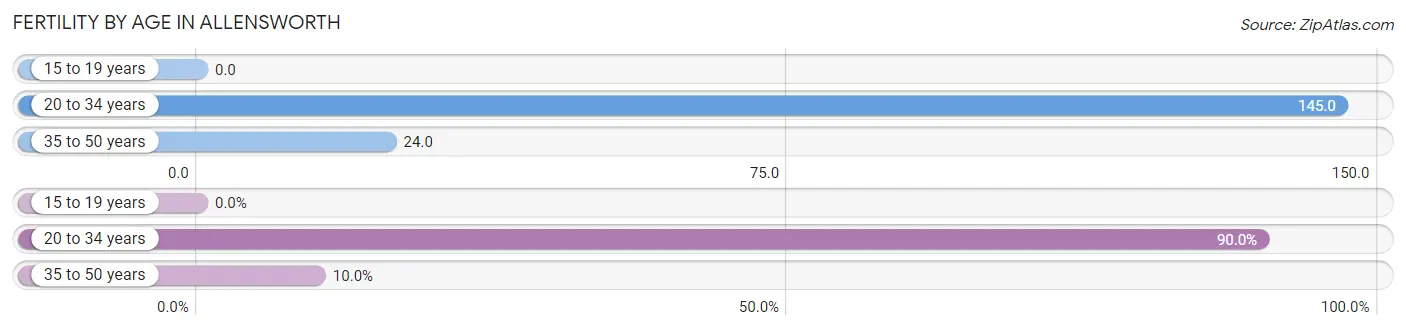
| Age Bracket | Women with Births | Births / 1,000 Women |
| 15 to 19 years | 0 (0.0%) | 0.0 |
| 20 to 34 years | 9 (90.0%) | 145.0 |
| 35 to 50 years | 1 (10.0%) | 24.0 |
| Total | 10 (100.0%) | 81.0 |
Fertility by Age by Marriage Status in Allensworth
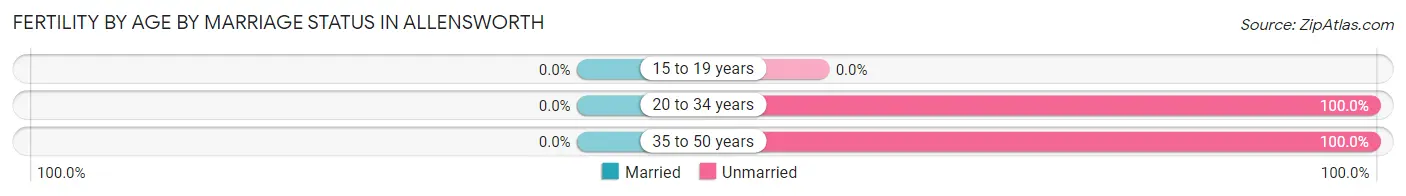
| Age Bracket | Married | Unmarried |
| 15 to 19 years | 0 (0.0%) | 0 (0.0%) |
| 20 to 34 years | 0 (0.0%) | 9 (100.0%) |
| 35 to 50 years | 0 (0.0%) | 1 (100.0%) |
| Total | 0 (0.0%) | 10 (100.0%) |
Fertility by Education in Allensworth
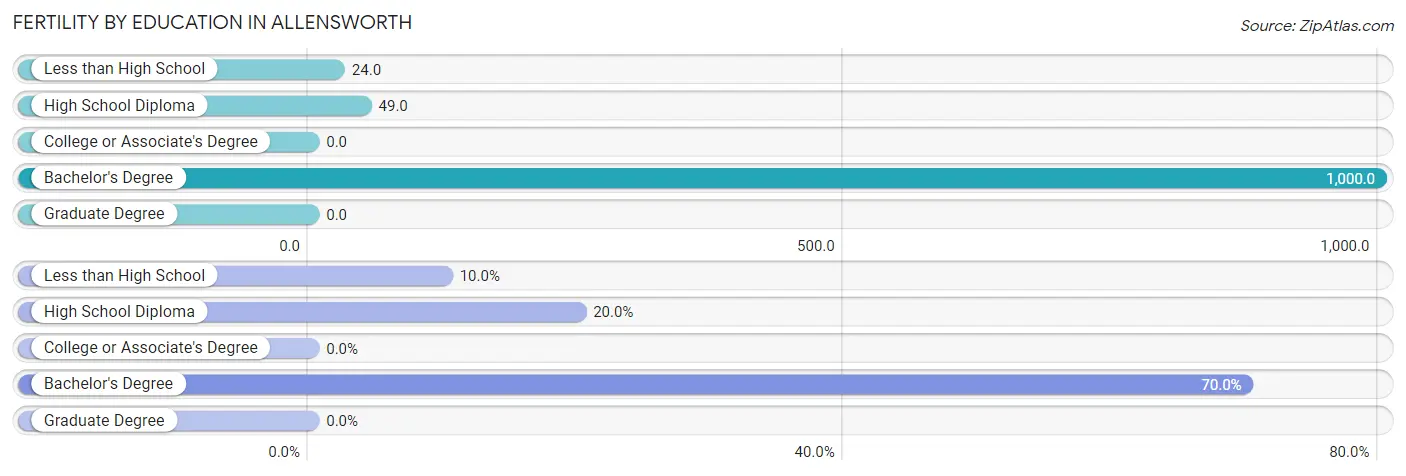
| Educational Attainment | Women with Births | Births / 1,000 Women |
| Less than High School | 1 (10.0%) | 24.0 |
| High School Diploma | 2 (20.0%) | 49.0 |
| College or Associate's Degree | 0 (0.0%) | 0.0 |
| Bachelor's Degree | 7 (70.0%) | 1,000.0 |
| Graduate Degree | 0 (0.0%) | 0.0 |
| Total | 10 (100.0%) | 81.0 |
Fertility by Education by Marriage Status in Allensworth
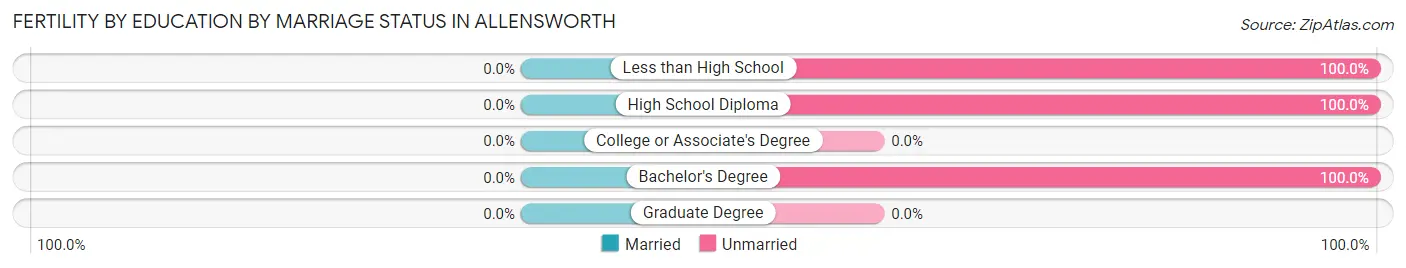
| Educational Attainment | Married | Unmarried |
| Less than High School | 0 (0.0%) | 1 (100.0%) |
| High School Diploma | 0 (0.0%) | 2 (100.0%) |
| College or Associate's Degree | 0 (0.0%) | 0 (0.0%) |
| Bachelor's Degree | 0 (0.0%) | 7 (100.0%) |
| Graduate Degree | 0 (0.0%) | 0 (0.0%) |
| Total | 0 (0.0%) | 10 (100.0%) |
Employment Characteristics in Allensworth
Employment by Class of Employer in Allensworth
Among the 147 employed individuals in Allensworth, private company employees (106 | 72.1%), self-employed (not incorporated) (15 | 10.2%), and local government employees (14 | 9.5%) make up the most common classes of employment.
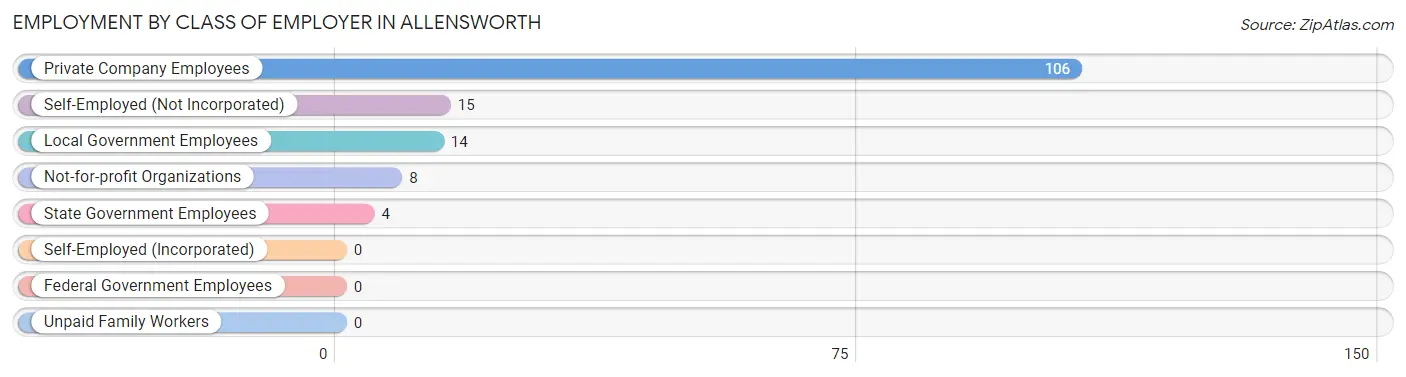
| Employer Class | # Employees | % Employees |
| Private Company Employees | 106 | 72.1% |
| Self-Employed (Incorporated) | 0 | 0.0% |
| Self-Employed (Not Incorporated) | 15 | 10.2% |
| Not-for-profit Organizations | 8 | 5.4% |
| Local Government Employees | 14 | 9.5% |
| State Government Employees | 4 | 2.7% |
| Federal Government Employees | 0 | 0.0% |
| Unpaid Family Workers | 0 | 0.0% |
| Total | 147 | 100.0% |
Employment Status by Age in Allensworth
According to the labor force statistics for Allensworth, out of the total population over 16 years of age (325), 61.2% or 199 individuals are in the labor force, with 25.1% or 50 of them unemployed. The age group with the highest labor force participation rate is 30 to 34 years, with 100.0% or 13 individuals in the labor force. Within the labor force, the 25 to 29 years age range has the highest percentage of unemployed individuals, with 61.9% or 26 of them being unemployed.
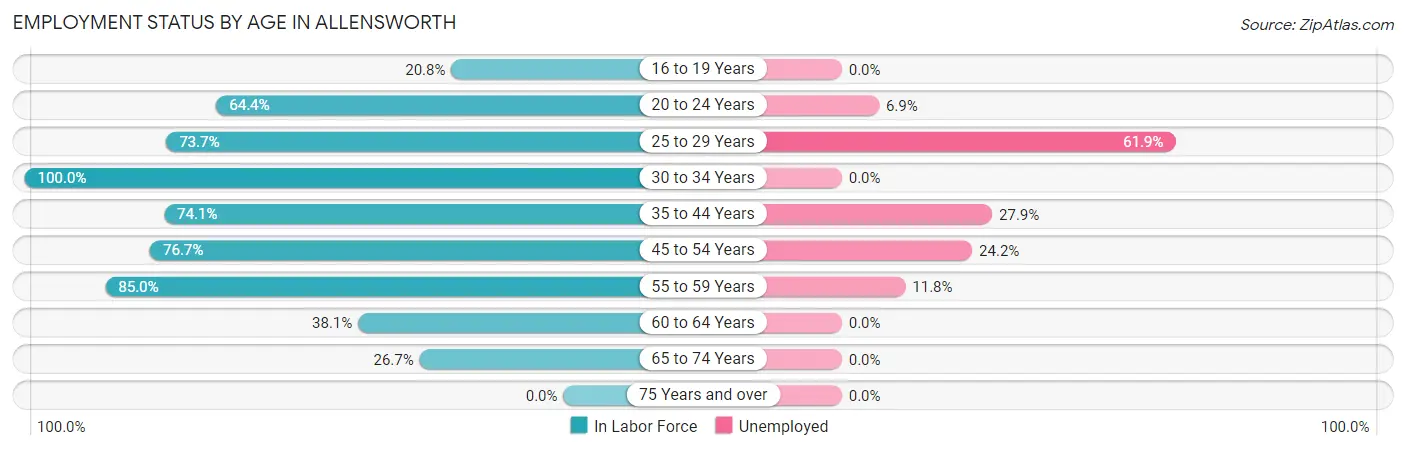
| Age Bracket | In Labor Force | Unemployed |
| 16 to 19 Years | 10 (20.8%) | 0 (0.0%) |
| 20 to 24 Years | 29 (64.4%) | 2 (6.9%) |
| 25 to 29 Years | 42 (73.7%) | 26 (61.9%) |
| 30 to 34 Years | 13 (100.0%) | 0 (0.0%) |
| 35 to 44 Years | 43 (74.1%) | 12 (27.9%) |
| 45 to 54 Years | 33 (76.7%) | 8 (24.2%) |
| 55 to 59 Years | 17 (85.0%) | 2 (11.8%) |
| 60 to 64 Years | 8 (38.1%) | 0 (0.0%) |
| 65 to 74 Years | 4 (26.7%) | 0 (0.0%) |
| 75 Years and over | 0 (0.0%) | 0 (0.0%) |
| Total | 199 (61.2%) | 50 (25.1%) |
Employment Status by Educational Attainment in Allensworth
According to labor force statistics for Allensworth, 73.6% of individuals (156) out of the total population between 25 and 64 years of age (212) are in the labor force, with 30.8% or 48 of them being unemployed. The group with the highest labor force participation rate are those with the educational attainment of high school diploma, with 80.9% or 55 individuals in the labor force. Within the labor force, individuals with high school diploma education have the highest percentage of unemployment, with 52.7% or 29 of them being unemployed.
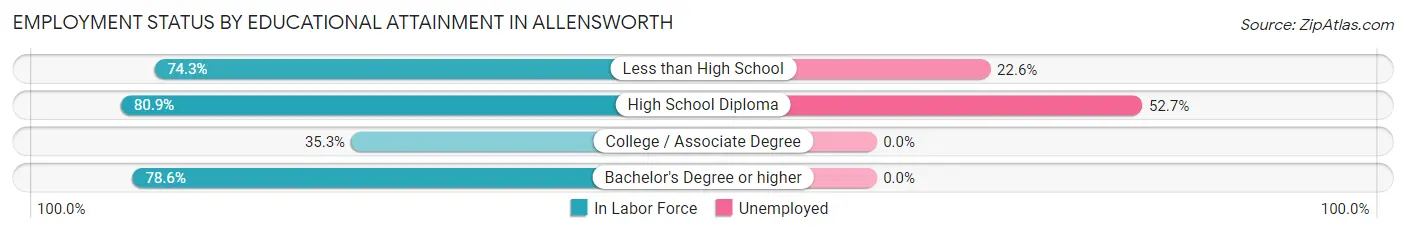
| Educational Attainment | In Labor Force | Unemployed |
| Less than High School | 84 (74.3%) | 26 (22.6%) |
| High School Diploma | 55 (80.9%) | 36 (52.7%) |
| College / Associate Degree | 6 (35.3%) | 0 (0.0%) |
| Bachelor's Degree or higher | 11 (78.6%) | 0 (0.0%) |
| Total | 156 (73.6%) | 65 (30.8%) |
Employment Occupations by Sex in Allensworth
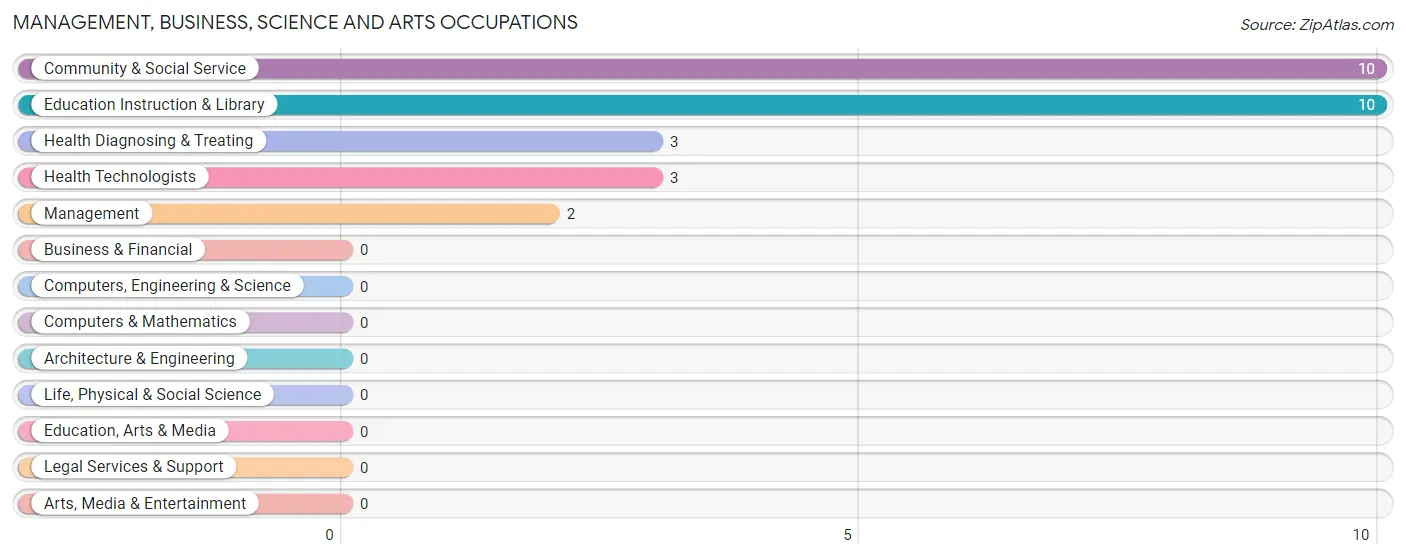
Management, Business, Science and Arts Occupations
The most common Management, Business, Science and Arts occupations in Allensworth are Community & Social Service (10 | 6.7%), Education Instruction & Library (10 | 6.7%), Health Diagnosing & Treating (3 | 2.0%), Health Technologists (3 | 2.0%), and Management (2 | 1.3%).
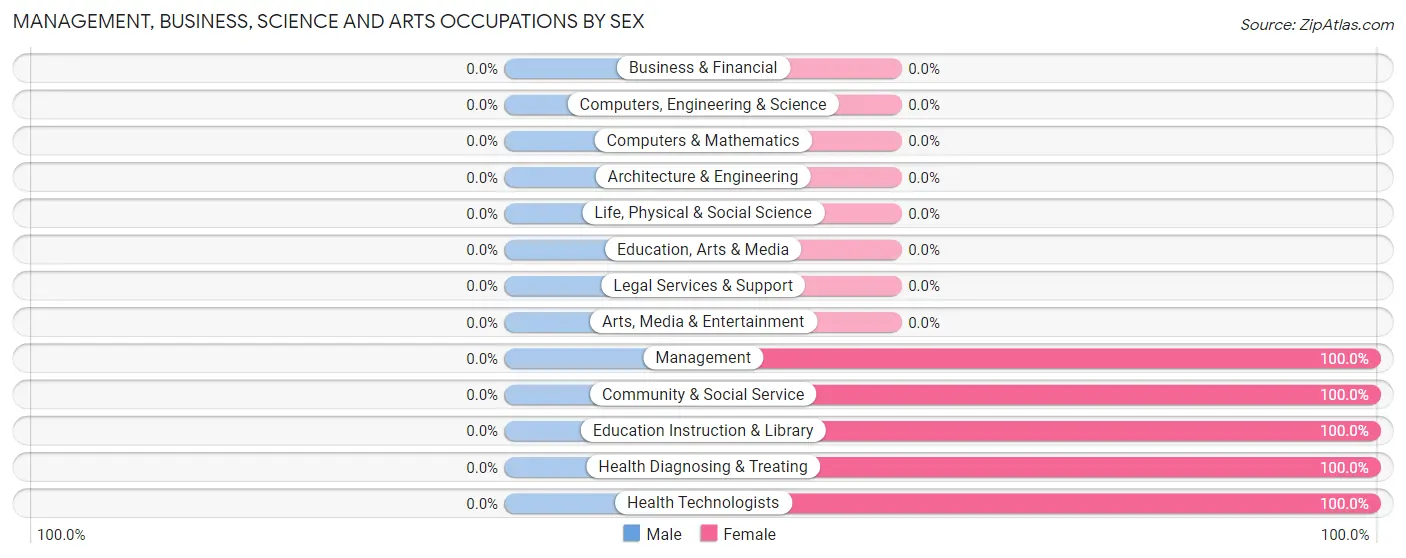
Management, Business, Science and Arts Occupations by Sex
| Occupation | Male | Female |
| Management | 0 (0.0%) | 2 (100.0%) |
| Business & Financial | 0 (0.0%) | 0 (0.0%) |
| Computers, Engineering & Science | 0 (0.0%) | 0 (0.0%) |
| Computers & Mathematics | 0 (0.0%) | 0 (0.0%) |
| Architecture & Engineering | 0 (0.0%) | 0 (0.0%) |
| Life, Physical & Social Science | 0 (0.0%) | 0 (0.0%) |
| Community & Social Service | 0 (0.0%) | 10 (100.0%) |
| Education, Arts & Media | 0 (0.0%) | 0 (0.0%) |
| Legal Services & Support | 0 (0.0%) | 0 (0.0%) |
| Education Instruction & Library | 0 (0.0%) | 10 (100.0%) |
| Arts, Media & Entertainment | 0 (0.0%) | 0 (0.0%) |
| Health Diagnosing & Treating | 0 (0.0%) | 3 (100.0%) |
| Health Technologists | 0 (0.0%) | 3 (100.0%) |
| Total (Category) | 0 (0.0%) | 15 (100.0%) |
| Total (Overall) | 89 (59.7%) | 60 (40.3%) |
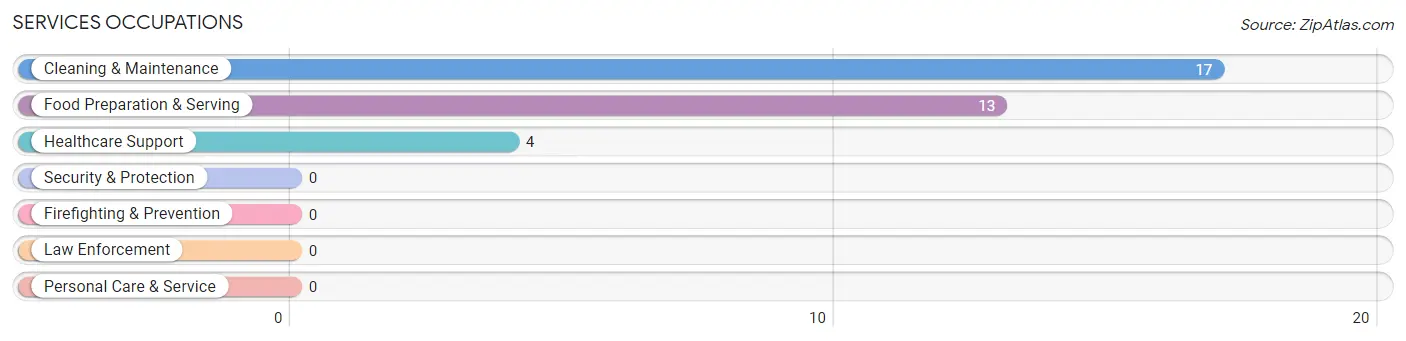
Services Occupations
The most common Services occupations in Allensworth are Cleaning & Maintenance (17 | 11.4%), Food Preparation & Serving (13 | 8.7%), and Healthcare Support (4 | 2.7%).
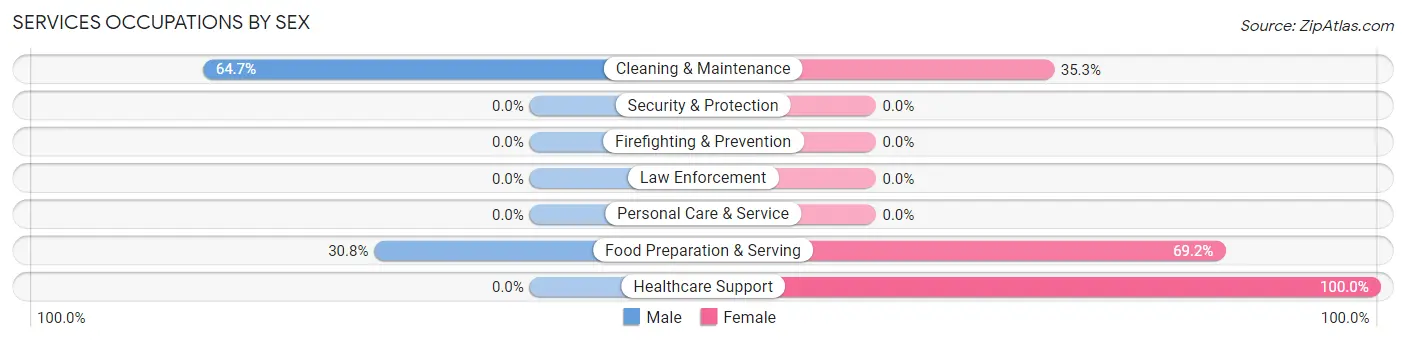
Services Occupations by Sex
Within the Services occupations in Allensworth, the most male-oriented occupations are Cleaning & Maintenance (64.7%), and Food Preparation & Serving (30.8%), while the most female-oriented occupations are Healthcare Support (100.0%), Food Preparation & Serving (69.2%), and Cleaning & Maintenance (35.3%).
| Occupation | Male | Female |
| Healthcare Support | 0 (0.0%) | 4 (100.0%) |
| Security & Protection | 0 (0.0%) | 0 (0.0%) |
| Firefighting & Prevention | 0 (0.0%) | 0 (0.0%) |
| Law Enforcement | 0 (0.0%) | 0 (0.0%) |
| Food Preparation & Serving | 4 (30.8%) | 9 (69.2%) |
| Cleaning & Maintenance | 11 (64.7%) | 6 (35.3%) |
| Personal Care & Service | 0 (0.0%) | 0 (0.0%) |
| Total (Category) | 15 (44.1%) | 19 (55.9%) |
| Total (Overall) | 89 (59.7%) | 60 (40.3%) |
Sales and Office Occupations
The most common Sales and Office occupations in Allensworth are Sales & Related (13 | 8.7%), and Office & Administration (2 | 1.3%).
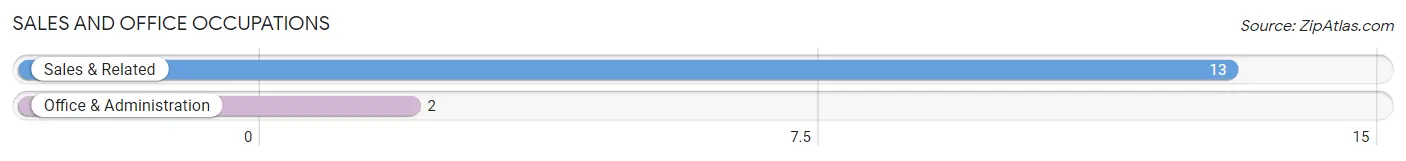
Sales and Office Occupations by Sex

| Occupation | Male | Female |
| Sales & Related | 3 (23.1%) | 10 (76.9%) |
| Office & Administration | 2 (100.0%) | 0 (0.0%) |
| Total (Category) | 5 (33.3%) | 10 (66.7%) |
| Total (Overall) | 89 (59.7%) | 60 (40.3%) |
Natural Resources, Construction and Maintenance Occupations
The most common Natural Resources, Construction and Maintenance occupations in Allensworth are Farming, Fishing & Forestry (50 | 33.6%), and Construction & Extraction (15 | 10.1%).
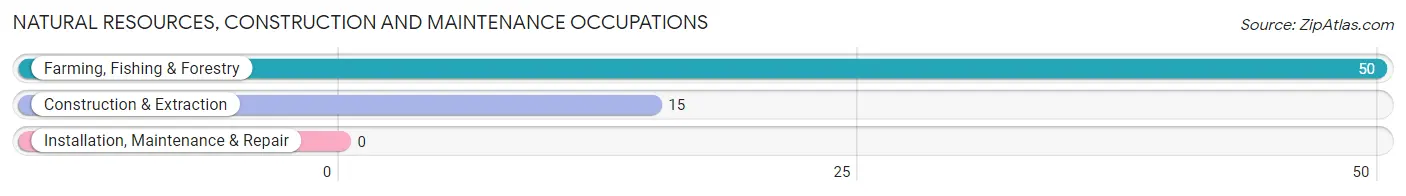
Natural Resources, Construction and Maintenance Occupations by Sex
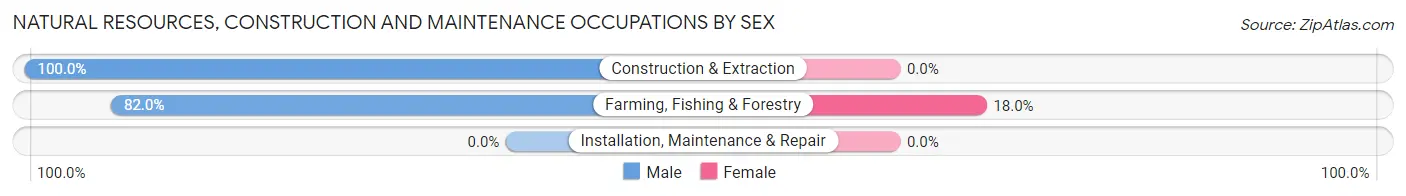
| Occupation | Male | Female |
| Farming, Fishing & Forestry | 41 (82.0%) | 9 (18.0%) |
| Construction & Extraction | 15 (100.0%) | 0 (0.0%) |
| Installation, Maintenance & Repair | 0 (0.0%) | 0 (0.0%) |
| Total (Category) | 56 (86.2%) | 9 (13.9%) |
| Total (Overall) | 89 (59.7%) | 60 (40.3%) |
Production, Transportation and Moving Occupations
The most common Production, Transportation and Moving occupations in Allensworth are Material Moving (10 | 6.7%), Production (6 | 4.0%), and Transportation (4 | 2.7%).
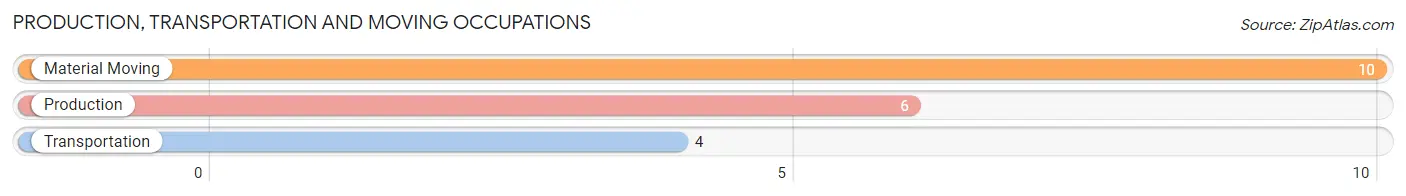
Production, Transportation and Moving Occupations by Sex
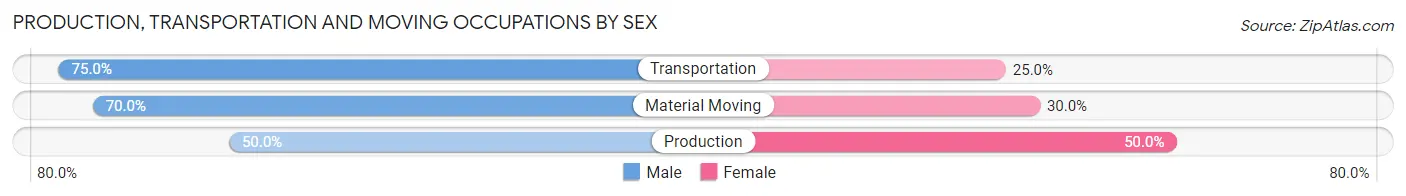
| Occupation | Male | Female |
| Production | 3 (50.0%) | 3 (50.0%) |
| Transportation | 3 (75.0%) | 1 (25.0%) |
| Material Moving | 7 (70.0%) | 3 (30.0%) |
| Total (Category) | 13 (65.0%) | 7 (35.0%) |
| Total (Overall) | 89 (59.7%) | 60 (40.3%) |
Employment Industries by Sex in Allensworth
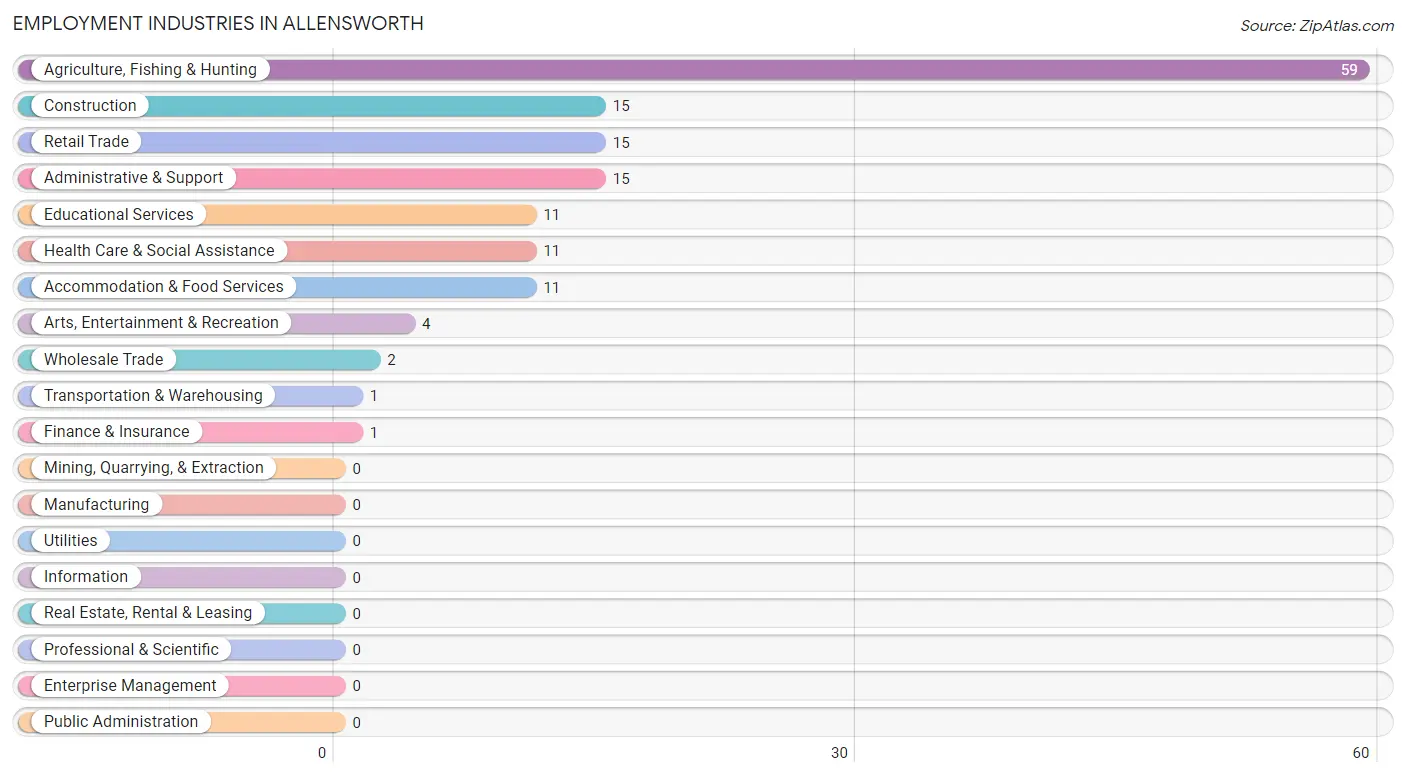
Employment Industries in Allensworth
The major employment industries in Allensworth include Agriculture, Fishing & Hunting (59 | 39.6%), Construction (15 | 10.1%), Retail Trade (15 | 10.1%), Administrative & Support (15 | 10.1%), and Educational Services (11 | 7.4%).
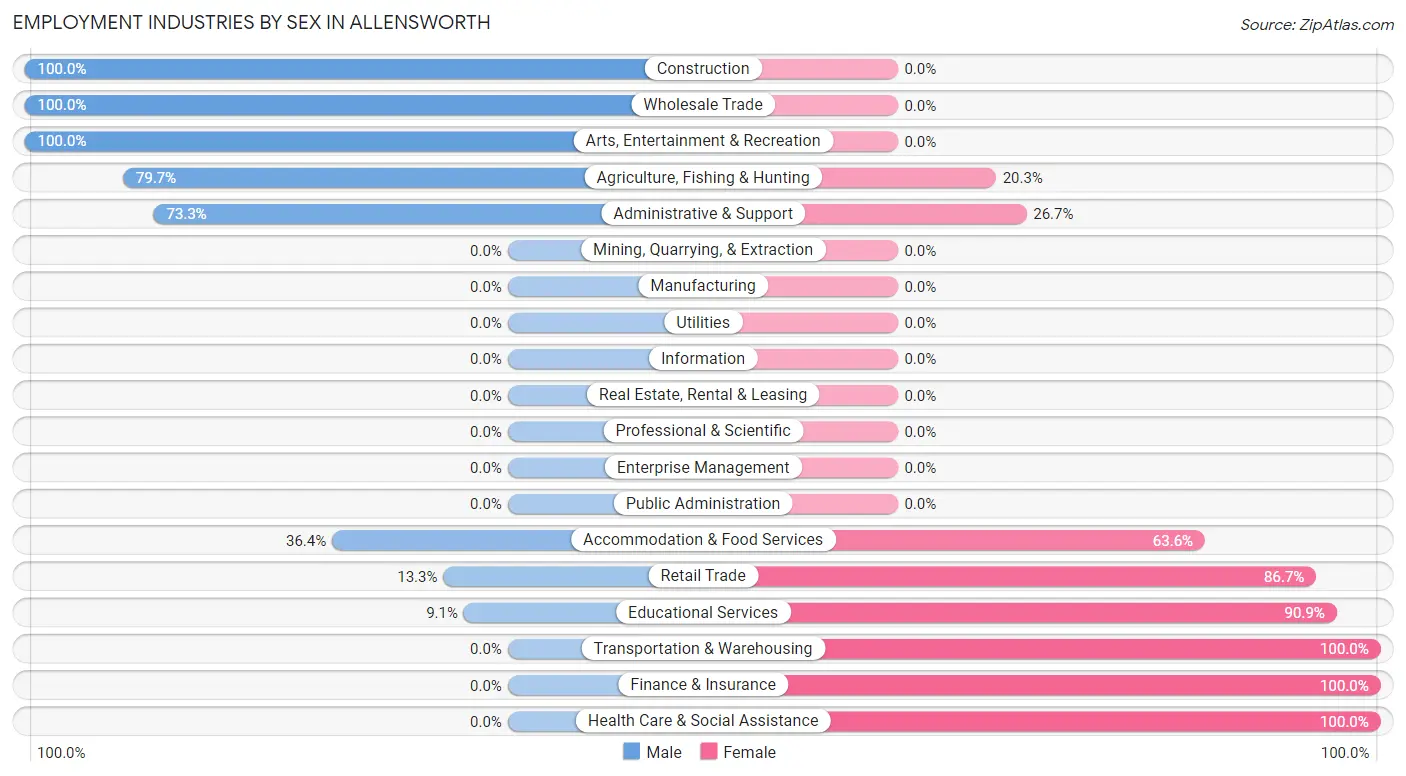
Employment Industries by Sex in Allensworth
The Allensworth industries that see more men than women are Construction (100.0%), Wholesale Trade (100.0%), and Arts, Entertainment & Recreation (100.0%), whereas the industries that tend to have a higher number of women are Transportation & Warehousing (100.0%), Finance & Insurance (100.0%), and Health Care & Social Assistance (100.0%).
| Industry | Male | Female |
| Agriculture, Fishing & Hunting | 47 (79.7%) | 12 (20.3%) |
| Mining, Quarrying, & Extraction | 0 (0.0%) | 0 (0.0%) |
| Construction | 15 (100.0%) | 0 (0.0%) |
| Manufacturing | 0 (0.0%) | 0 (0.0%) |
| Wholesale Trade | 2 (100.0%) | 0 (0.0%) |
| Retail Trade | 2 (13.3%) | 13 (86.7%) |
| Transportation & Warehousing | 0 (0.0%) | 1 (100.0%) |
| Utilities | 0 (0.0%) | 0 (0.0%) |
| Information | 0 (0.0%) | 0 (0.0%) |
| Finance & Insurance | 0 (0.0%) | 1 (100.0%) |
| Real Estate, Rental & Leasing | 0 (0.0%) | 0 (0.0%) |
| Professional & Scientific | 0 (0.0%) | 0 (0.0%) |
| Enterprise Management | 0 (0.0%) | 0 (0.0%) |
| Administrative & Support | 11 (73.3%) | 4 (26.7%) |
| Educational Services | 1 (9.1%) | 10 (90.9%) |
| Health Care & Social Assistance | 0 (0.0%) | 11 (100.0%) |
| Arts, Entertainment & Recreation | 4 (100.0%) | 0 (0.0%) |
| Accommodation & Food Services | 4 (36.4%) | 7 (63.6%) |
| Public Administration | 0 (0.0%) | 0 (0.0%) |
| Total | 89 (59.7%) | 60 (40.3%) |
Education in Allensworth
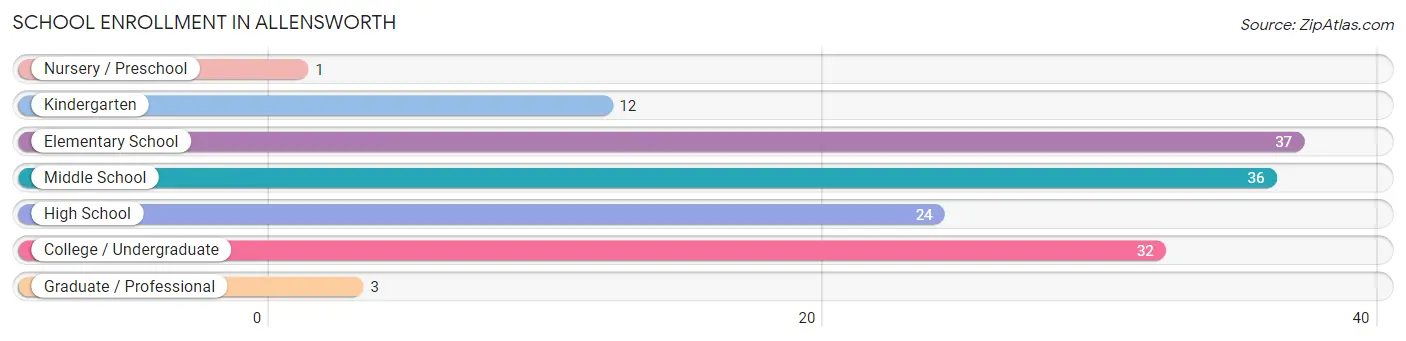
School Enrollment in Allensworth
The most common levels of schooling among the 145 students in Allensworth are elementary school (37 | 25.5%), middle school (36 | 24.8%), and college / undergraduate (32 | 22.1%).
| School Level | # Students | % Students |
| Nursery / Preschool | 1 | 0.7% |
| Kindergarten | 12 | 8.3% |
| Elementary School | 37 | 25.5% |
| Middle School | 36 | 24.8% |
| High School | 24 | 16.6% |
| College / Undergraduate | 32 | 22.1% |
| Graduate / Professional | 3 | 2.1% |
| Total | 145 | 100.0% |
School Enrollment by Age by Funding Source in Allensworth
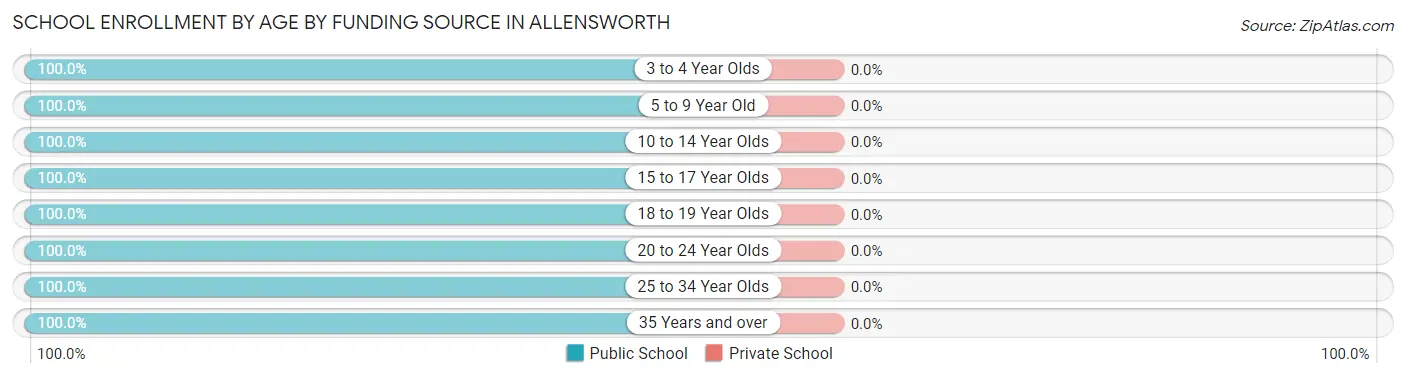
| Age Bracket | Public School | Private School |
| 3 to 4 Year Olds | 1 (100.0%) | 0 (0.0%) |
| 5 to 9 Year Old | 48 (100.0%) | 0 (0.0%) |
| 10 to 14 Year Olds | 40 (100.0%) | 0 (0.0%) |
| 15 to 17 Year Olds | 14 (100.0%) | 0 (0.0%) |
| 18 to 19 Year Olds | 16 (100.0%) | 0 (0.0%) |
| 20 to 24 Year Olds | 17 (100.0%) | 0 (0.0%) |
| 25 to 34 Year Olds | 5 (100.0%) | 0 (0.0%) |
| 35 Years and over | 4 (100.0%) | 0 (0.0%) |
| Total | 145 (100.0%) | 0 (0.0%) |
Educational Attainment by Field of Study in Allensworth
Bio, nature & agricultural (5 | 35.7%), science & technology (3 | 21.4%), education (3 | 21.4%), and liberal arts & history (3 | 21.4%) are the most common fields of study among 14 individuals in Allensworth who have obtained a bachelor's degree or higher.
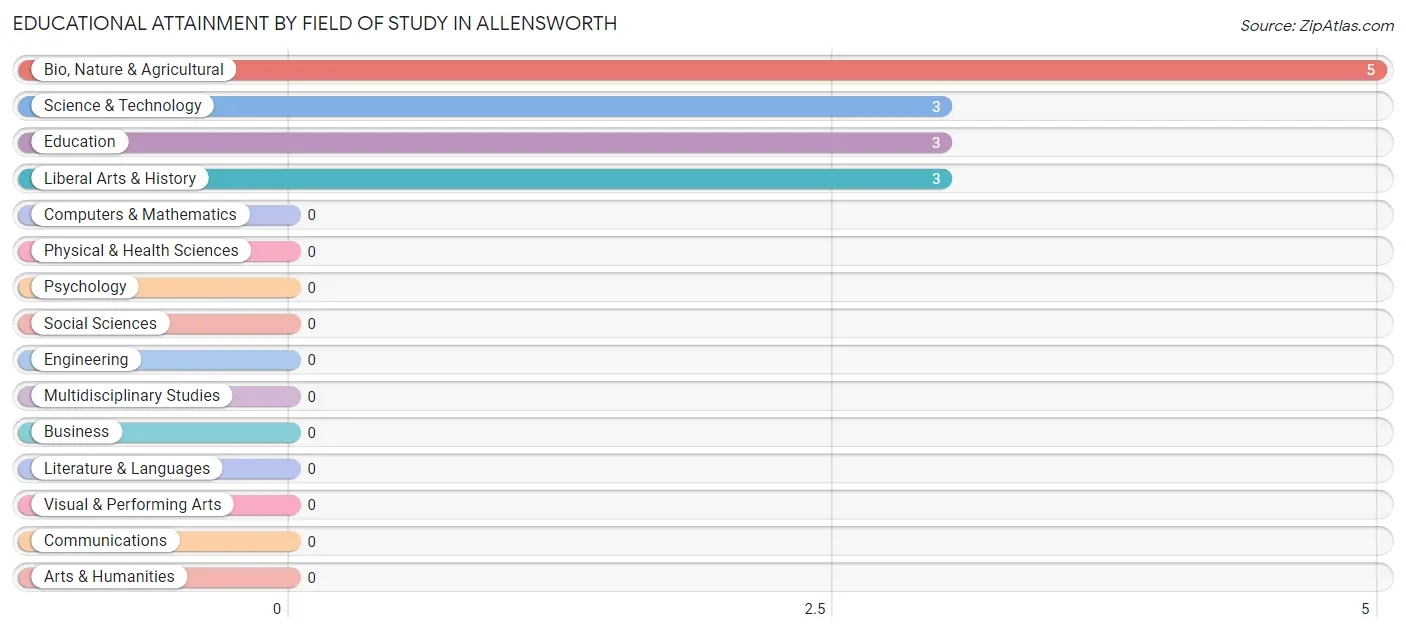
| Field of Study | # Graduates | % Graduates |
| Computers & Mathematics | 0 | 0.0% |
| Bio, Nature & Agricultural | 5 | 35.7% |
| Physical & Health Sciences | 0 | 0.0% |
| Psychology | 0 | 0.0% |
| Social Sciences | 0 | 0.0% |
| Engineering | 0 | 0.0% |
| Multidisciplinary Studies | 0 | 0.0% |
| Science & Technology | 3 | 21.4% |
| Business | 0 | 0.0% |
| Education | 3 | 21.4% |
| Literature & Languages | 0 | 0.0% |
| Liberal Arts & History | 3 | 21.4% |
| Visual & Performing Arts | 0 | 0.0% |
| Communications | 0 | 0.0% |
| Arts & Humanities | 0 | 0.0% |
| Total | 14 | 100.0% |
Transportation & Commute in Allensworth
Vehicle Availability by Sex in Allensworth
The most prevalent vehicle ownership categories in Allensworth are males with 2 vehicles (42, accounting for 48.3%) and females with 2 vehicles (28, making up 70.0%).
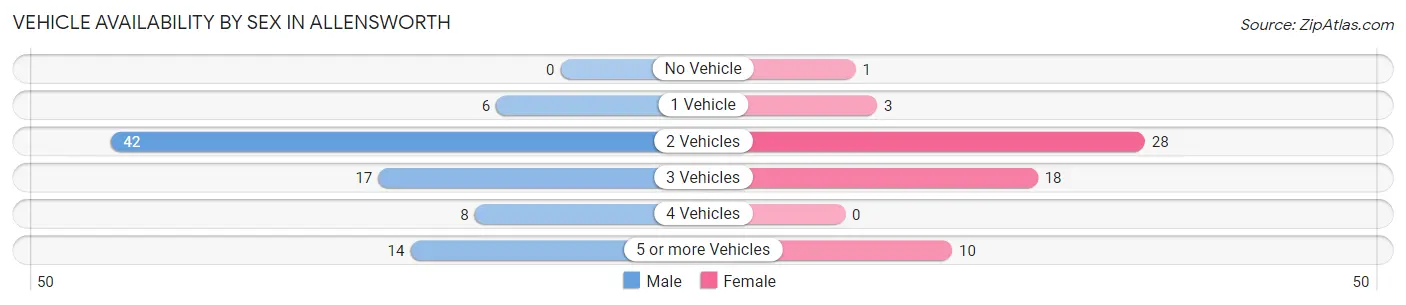
| Vehicles Available | Male | Female |
| No Vehicle | 0 (0.0%) | 1 (1.7%) |
| 1 Vehicle | 6 (6.9%) | 3 (5.0%) |
| 2 Vehicles | 42 (48.3%) | 28 (46.7%) |
| 3 Vehicles | 17 (19.5%) | 18 (30.0%) |
| 4 Vehicles | 8 (9.2%) | 0 (0.0%) |
| 5 or more Vehicles | 14 (16.1%) | 10 (16.7%) |
| Total | 87 (100.0%) | 60 (100.0%) |
Commute Time in Allensworth
The most frequently occuring commute durations in Allensworth are 20 to 24 minutes (46 commuters, 31.3%), 15 to 19 minutes (22 commuters, 15.0%), and 25 to 29 minutes (18 commuters, 12.2%).
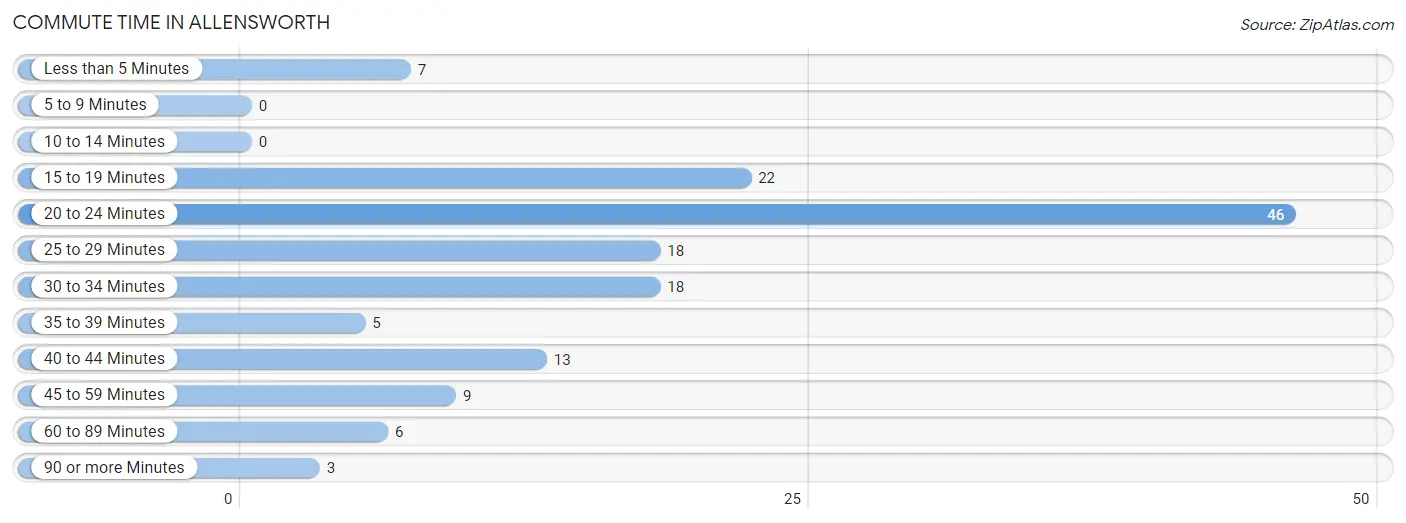
| Commute Time | # Commuters | % Commuters |
| Less than 5 Minutes | 7 | 4.8% |
| 5 to 9 Minutes | 0 | 0.0% |
| 10 to 14 Minutes | 0 | 0.0% |
| 15 to 19 Minutes | 22 | 15.0% |
| 20 to 24 Minutes | 46 | 31.3% |
| 25 to 29 Minutes | 18 | 12.2% |
| 30 to 34 Minutes | 18 | 12.2% |
| 35 to 39 Minutes | 5 | 3.4% |
| 40 to 44 Minutes | 13 | 8.8% |
| 45 to 59 Minutes | 9 | 6.1% |
| 60 to 89 Minutes | 6 | 4.1% |
| 90 or more Minutes | 3 | 2.0% |
Commute Time by Sex in Allensworth
The most common commute times in Allensworth are 20 to 24 minutes (33 commuters, 37.9%) for males and 15 to 19 minutes (13 commuters, 21.7%) for females.
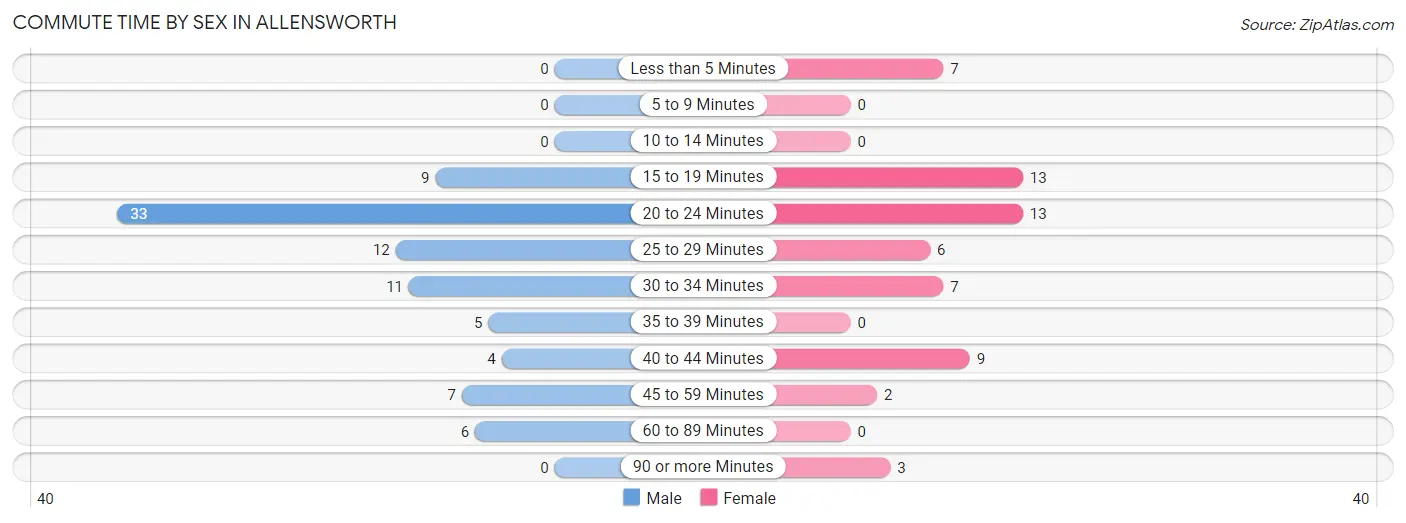
| Commute Time | Male | Female |
| Less than 5 Minutes | 0 (0.0%) | 7 (11.7%) |
| 5 to 9 Minutes | 0 (0.0%) | 0 (0.0%) |
| 10 to 14 Minutes | 0 (0.0%) | 0 (0.0%) |
| 15 to 19 Minutes | 9 (10.3%) | 13 (21.7%) |
| 20 to 24 Minutes | 33 (37.9%) | 13 (21.7%) |
| 25 to 29 Minutes | 12 (13.8%) | 6 (10.0%) |
| 30 to 34 Minutes | 11 (12.6%) | 7 (11.7%) |
| 35 to 39 Minutes | 5 (5.8%) | 0 (0.0%) |
| 40 to 44 Minutes | 4 (4.6%) | 9 (15.0%) |
| 45 to 59 Minutes | 7 (8.1%) | 2 (3.3%) |
| 60 to 89 Minutes | 6 (6.9%) | 0 (0.0%) |
| 90 or more Minutes | 0 (0.0%) | 3 (5.0%) |
Time of Departure to Work by Sex in Allensworth
The most frequent times of departure to work in Allensworth are 5:30 AM to 5:59 AM (24, 27.6%) for males and 7:00 AM to 7:29 AM (11, 18.3%) for females.
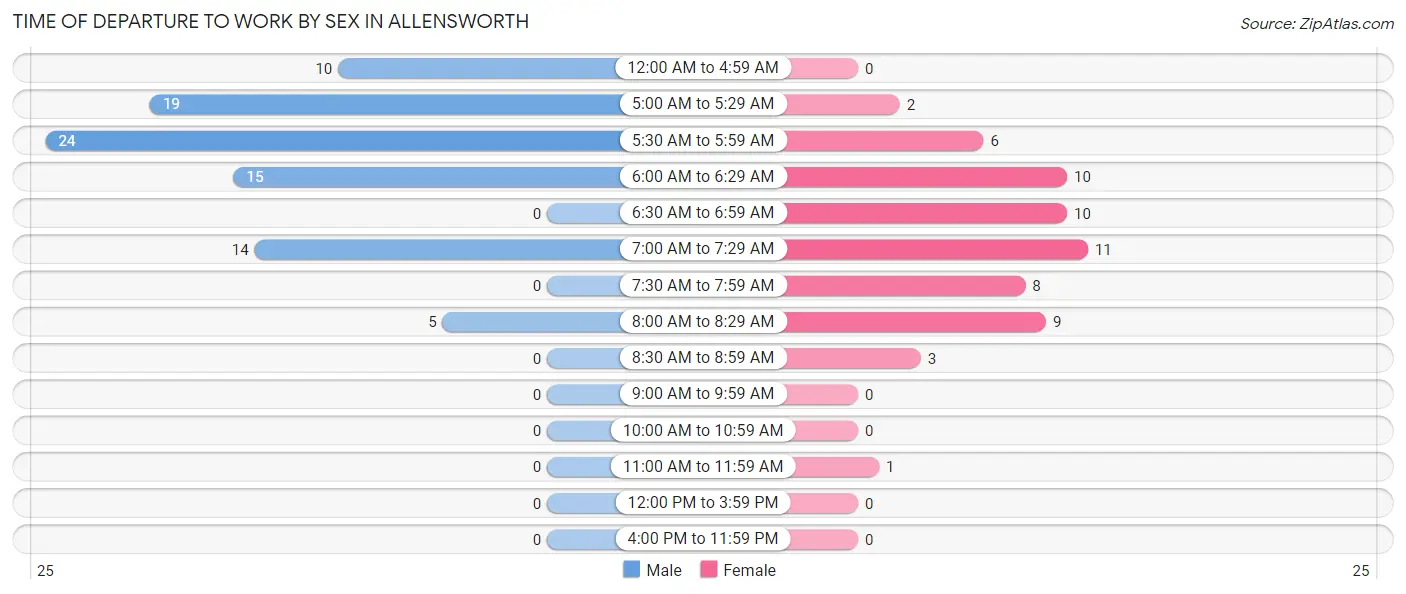
| Time of Departure | Male | Female |
| 12:00 AM to 4:59 AM | 10 (11.5%) | 0 (0.0%) |
| 5:00 AM to 5:29 AM | 19 (21.8%) | 2 (3.3%) |
| 5:30 AM to 5:59 AM | 24 (27.6%) | 6 (10.0%) |
| 6:00 AM to 6:29 AM | 15 (17.2%) | 10 (16.7%) |
| 6:30 AM to 6:59 AM | 0 (0.0%) | 10 (16.7%) |
| 7:00 AM to 7:29 AM | 14 (16.1%) | 11 (18.3%) |
| 7:30 AM to 7:59 AM | 0 (0.0%) | 8 (13.3%) |
| 8:00 AM to 8:29 AM | 5 (5.8%) | 9 (15.0%) |
| 8:30 AM to 8:59 AM | 0 (0.0%) | 3 (5.0%) |
| 9:00 AM to 9:59 AM | 0 (0.0%) | 0 (0.0%) |
| 10:00 AM to 10:59 AM | 0 (0.0%) | 0 (0.0%) |
| 11:00 AM to 11:59 AM | 0 (0.0%) | 1 (1.7%) |
| 12:00 PM to 3:59 PM | 0 (0.0%) | 0 (0.0%) |
| 4:00 PM to 11:59 PM | 0 (0.0%) | 0 (0.0%) |
| Total | 87 (100.0%) | 60 (100.0%) |
Housing Occupancy in Allensworth
Occupancy by Ownership in Allensworth
Of the total 104 dwellings in Allensworth, owner-occupied units account for 39 (37.5%), while renter-occupied units make up 65 (62.5%).
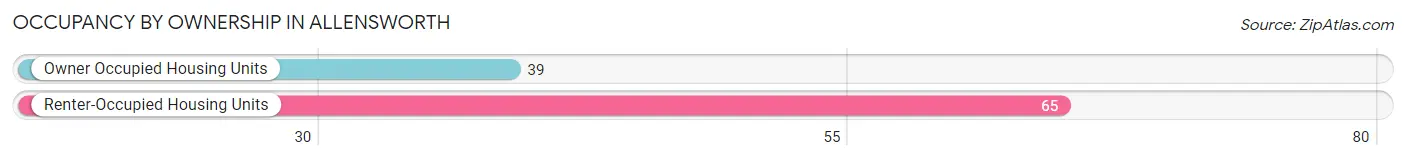
| Occupancy | # Housing Units | % Housing Units |
| Owner Occupied Housing Units | 39 | 37.5% |
| Renter-Occupied Housing Units | 65 | 62.5% |
| Total Occupied Housing Units | 104 | 100.0% |
Occupancy by Household Size in Allensworth
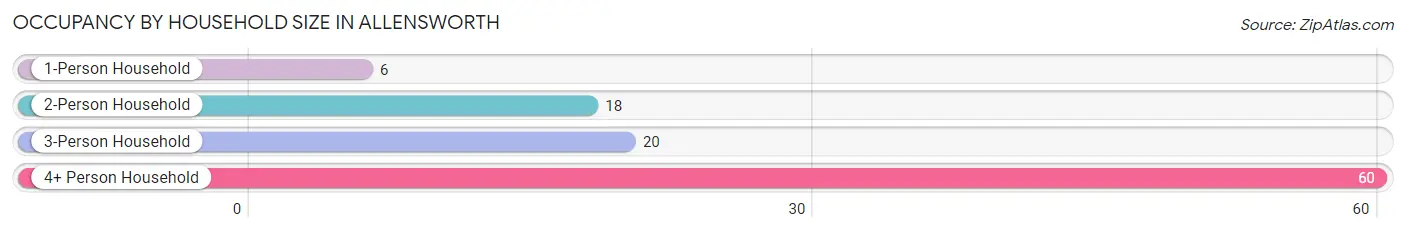
| Household Size | # Housing Units | % Housing Units |
| 1-Person Household | 6 | 5.8% |
| 2-Person Household | 18 | 17.3% |
| 3-Person Household | 20 | 19.2% |
| 4+ Person Household | 60 | 57.7% |
| Total Housing Units | 104 | 100.0% |
Occupancy by Ownership by Household Size in Allensworth
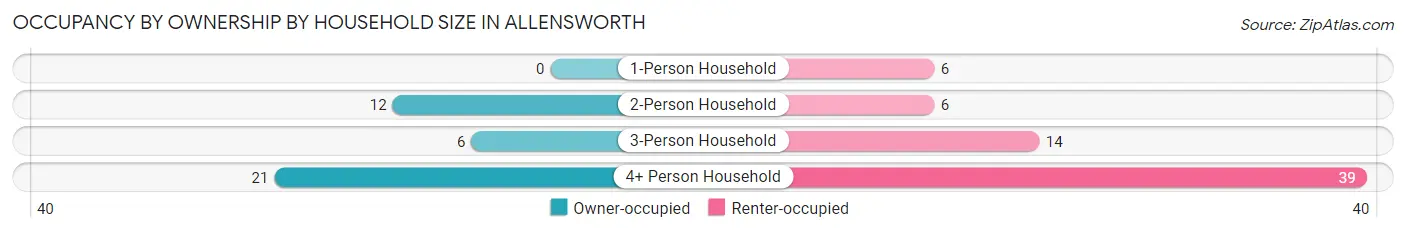
| Household Size | Owner-occupied | Renter-occupied |
| 1-Person Household | 0 (0.0%) | 6 (100.0%) |
| 2-Person Household | 12 (66.7%) | 6 (33.3%) |
| 3-Person Household | 6 (30.0%) | 14 (70.0%) |
| 4+ Person Household | 21 (35.0%) | 39 (65.0%) |
| Total Housing Units | 39 (37.5%) | 65 (62.5%) |
Occupancy by Educational Attainment in Allensworth
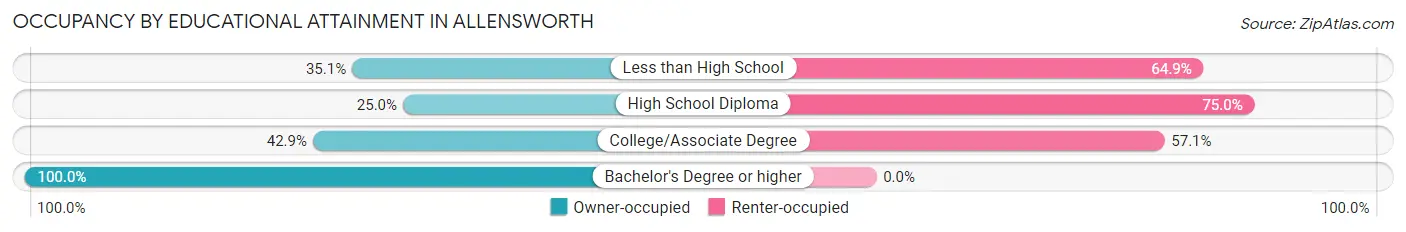
| Household Size | Owner-occupied | Renter-occupied |
| Less than High School | 20 (35.1%) | 37 (64.9%) |
| High School Diploma | 8 (25.0%) | 24 (75.0%) |
| College/Associate Degree | 3 (42.9%) | 4 (57.1%) |
| Bachelor's Degree or higher | 8 (100.0%) | 0 (0.0%) |
Occupancy by Age of Householder in Allensworth
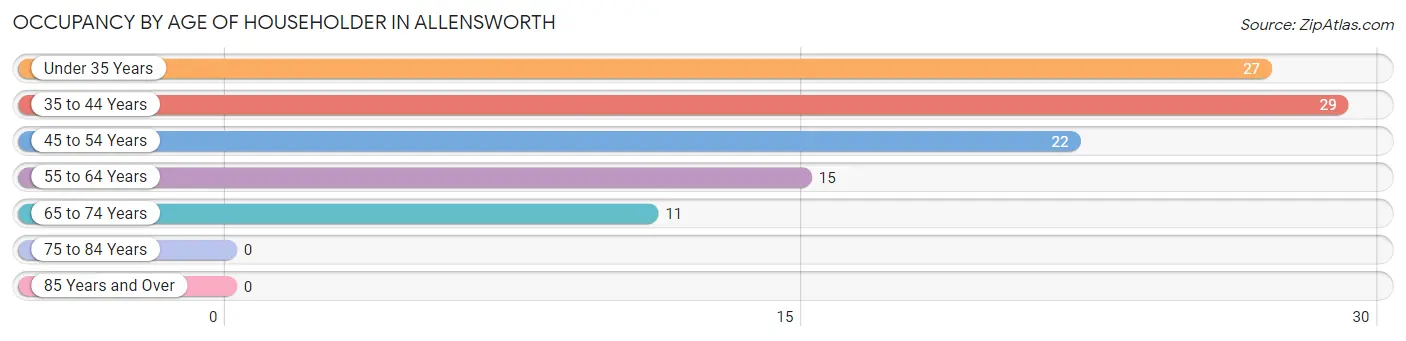
| Age Bracket | # Households | % Households |
| Under 35 Years | 27 | 26.0% |
| 35 to 44 Years | 29 | 27.9% |
| 45 to 54 Years | 22 | 21.1% |
| 55 to 64 Years | 15 | 14.4% |
| 65 to 74 Years | 11 | 10.6% |
| 75 to 84 Years | 0 | 0.0% |
| 85 Years and Over | 0 | 0.0% |
| Total | 104 | 100.0% |
Housing Finances in Allensworth
Median Income by Occupancy in Allensworth
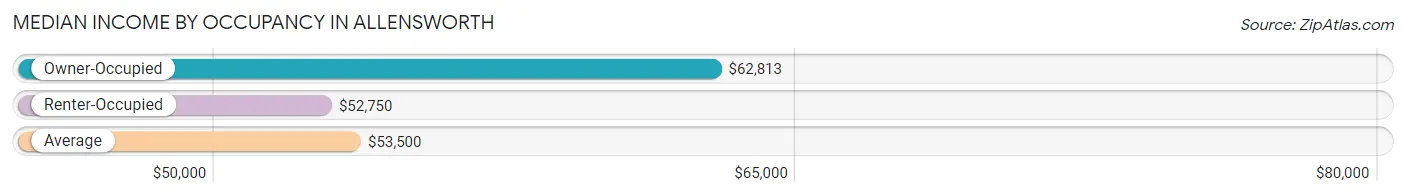
| Occupancy Type | # Households | Median Income |
| Owner-Occupied | 39 (37.5%) | $62,813 |
| Renter-Occupied | 65 (62.5%) | $52,750 |
| Average | 104 (100.0%) | $53,500 |
Occupancy by Householder Income Bracket in Allensworth
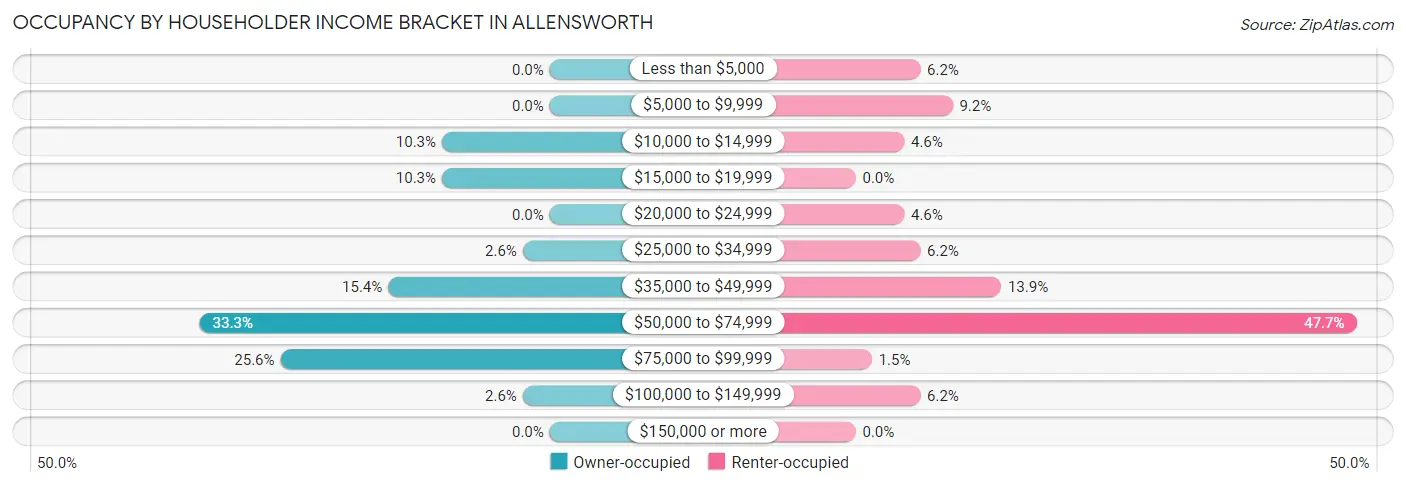
| Income Bracket | Owner-occupied | Renter-occupied |
| Less than $5,000 | 0 (0.0%) | 4 (6.1%) |
| $5,000 to $9,999 | 0 (0.0%) | 6 (9.2%) |
| $10,000 to $14,999 | 4 (10.3%) | 3 (4.6%) |
| $15,000 to $19,999 | 4 (10.3%) | 0 (0.0%) |
| $20,000 to $24,999 | 0 (0.0%) | 3 (4.6%) |
| $25,000 to $34,999 | 1 (2.6%) | 4 (6.1%) |
| $35,000 to $49,999 | 6 (15.4%) | 9 (13.9%) |
| $50,000 to $74,999 | 13 (33.3%) | 31 (47.7%) |
| $75,000 to $99,999 | 10 (25.6%) | 1 (1.5%) |
| $100,000 to $149,999 | 1 (2.6%) | 4 (6.1%) |
| $150,000 or more | 0 (0.0%) | 0 (0.0%) |
| Total | 39 (100.0%) | 65 (100.0%) |
Monthly Housing Cost Tiers in Allensworth
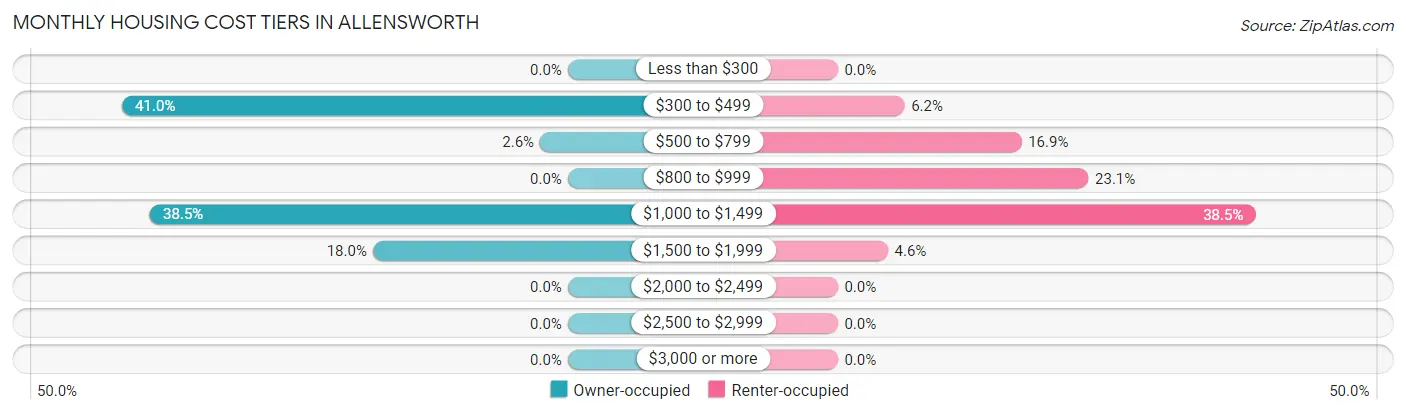
| Monthly Cost | Owner-occupied | Renter-occupied |
| Less than $300 | 0 (0.0%) | 0 (0.0%) |
| $300 to $499 | 16 (41.0%) | 4 (6.1%) |
| $500 to $799 | 1 (2.6%) | 11 (16.9%) |
| $800 to $999 | 0 (0.0%) | 15 (23.1%) |
| $1,000 to $1,499 | 15 (38.5%) | 25 (38.5%) |
| $1,500 to $1,999 | 7 (17.9%) | 3 (4.6%) |
| $2,000 to $2,499 | 0 (0.0%) | 0 (0.0%) |
| $2,500 to $2,999 | 0 (0.0%) | 0 (0.0%) |
| $3,000 or more | 0 (0.0%) | 0 (0.0%) |
| Total | 39 (100.0%) | 65 (100.0%) |
Physical Housing Characteristics in Allensworth
Housing Structures in Allensworth
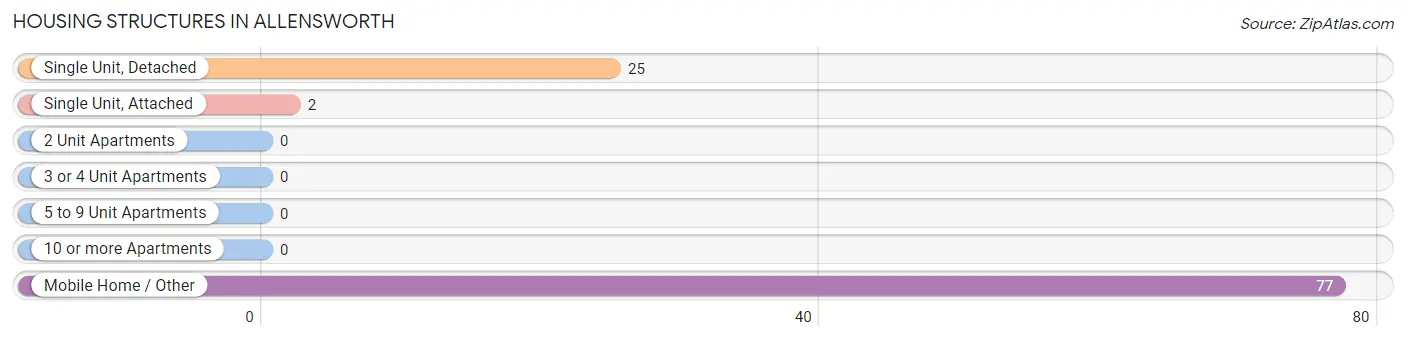
| Structure Type | # Housing Units | % Housing Units |
| Single Unit, Detached | 25 | 24.0% |
| Single Unit, Attached | 2 | 1.9% |
| 2 Unit Apartments | 0 | 0.0% |
| 3 or 4 Unit Apartments | 0 | 0.0% |
| 5 to 9 Unit Apartments | 0 | 0.0% |
| 10 or more Apartments | 0 | 0.0% |
| Mobile Home / Other | 77 | 74.0% |
| Total | 104 | 100.0% |
Housing Structures by Occupancy in Allensworth
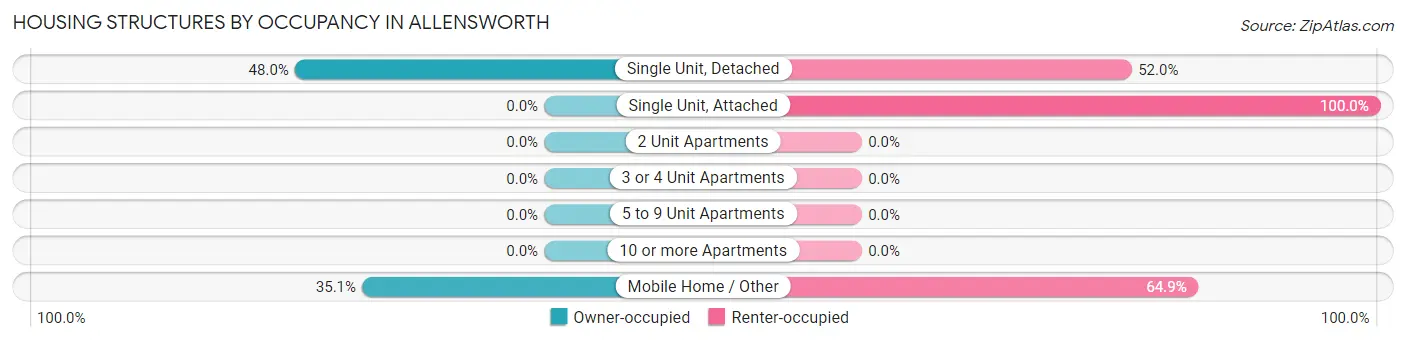
| Structure Type | Owner-occupied | Renter-occupied |
| Single Unit, Detached | 12 (48.0%) | 13 (52.0%) |
| Single Unit, Attached | 0 (0.0%) | 2 (100.0%) |
| 2 Unit Apartments | 0 (0.0%) | 0 (0.0%) |
| 3 or 4 Unit Apartments | 0 (0.0%) | 0 (0.0%) |
| 5 to 9 Unit Apartments | 0 (0.0%) | 0 (0.0%) |
| 10 or more Apartments | 0 (0.0%) | 0 (0.0%) |
| Mobile Home / Other | 27 (35.1%) | 50 (64.9%) |
| Total | 39 (37.5%) | 65 (62.5%) |
Housing Structures by Number of Rooms in Allensworth
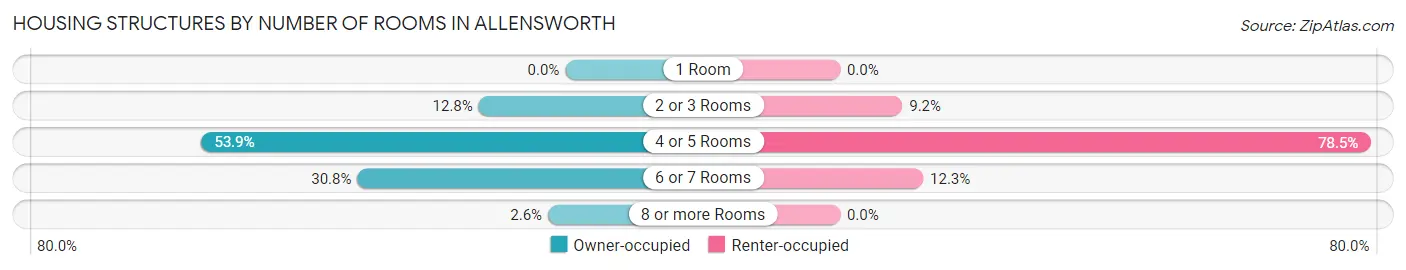
| Number of Rooms | Owner-occupied | Renter-occupied |
| 1 Room | 0 (0.0%) | 0 (0.0%) |
| 2 or 3 Rooms | 5 (12.8%) | 6 (9.2%) |
| 4 or 5 Rooms | 21 (53.8%) | 51 (78.5%) |
| 6 or 7 Rooms | 12 (30.8%) | 8 (12.3%) |
| 8 or more Rooms | 1 (2.6%) | 0 (0.0%) |
| Total | 39 (100.0%) | 65 (100.0%) |
Housing Structure by Heating Type in Allensworth
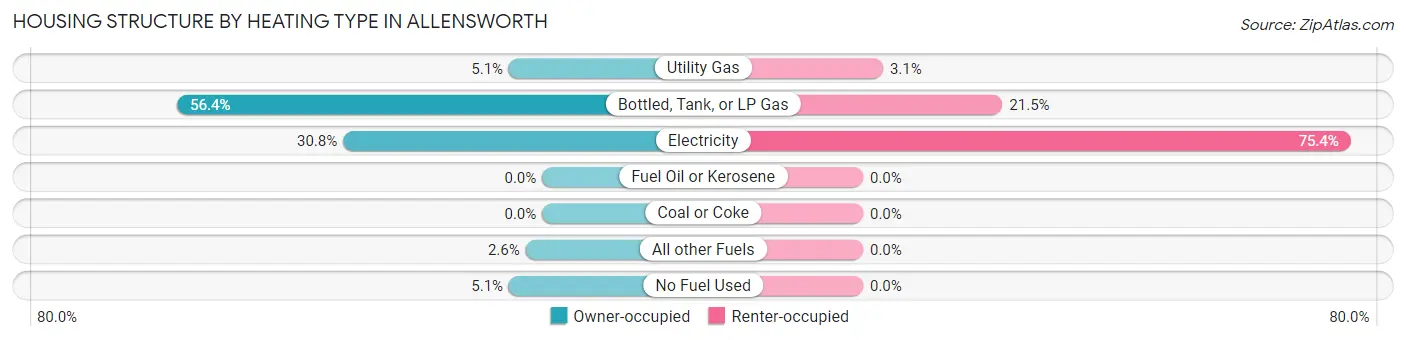
| Heating Type | Owner-occupied | Renter-occupied |
| Utility Gas | 2 (5.1%) | 2 (3.1%) |
| Bottled, Tank, or LP Gas | 22 (56.4%) | 14 (21.5%) |
| Electricity | 12 (30.8%) | 49 (75.4%) |
| Fuel Oil or Kerosene | 0 (0.0%) | 0 (0.0%) |
| Coal or Coke | 0 (0.0%) | 0 (0.0%) |
| All other Fuels | 1 (2.6%) | 0 (0.0%) |
| No Fuel Used | 2 (5.1%) | 0 (0.0%) |
| Total | 39 (100.0%) | 65 (100.0%) |
Household Vehicle Usage in Allensworth
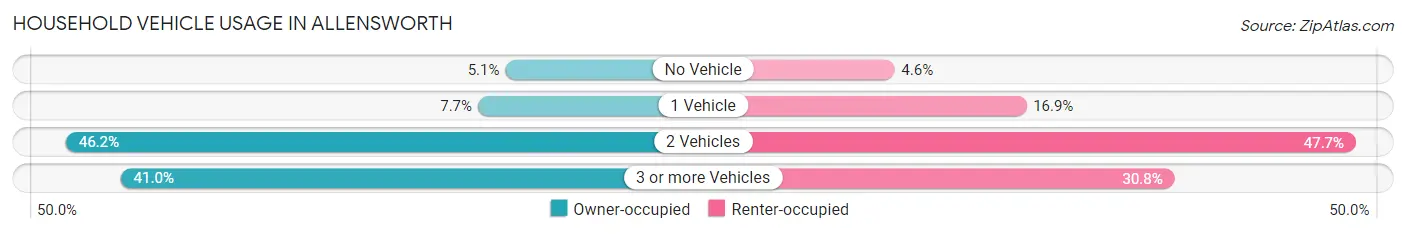
| Vehicles per Household | Owner-occupied | Renter-occupied |
| No Vehicle | 2 (5.1%) | 3 (4.6%) |
| 1 Vehicle | 3 (7.7%) | 11 (16.9%) |
| 2 Vehicles | 18 (46.2%) | 31 (47.7%) |
| 3 or more Vehicles | 16 (41.0%) | 20 (30.8%) |
| Total | 39 (100.0%) | 65 (100.0%) |
Real Estate & Mortgages in Allensworth
Real Estate and Mortgage Overview in Allensworth
| Characteristic | Without Mortgage | With Mortgage |
| Housing Units | 19 | 20 |
| Median Property Value | $145,800 | $233,300 |
| Median Household Income | $64,063 | $0 |
| Monthly Housing Costs | $441 | $0 |
| Real Estate Taxes | $700 | $3 |
Property Value by Mortgage Status in Allensworth
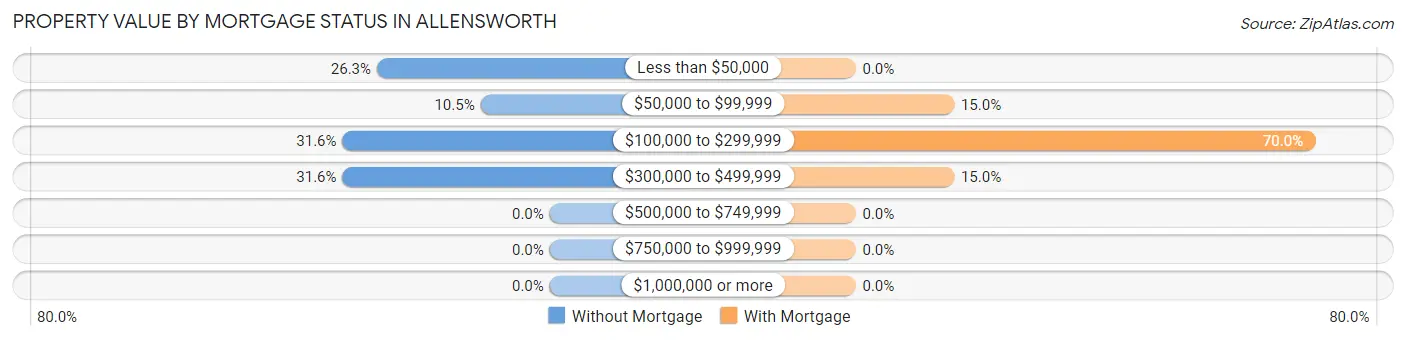
| Property Value | Without Mortgage | With Mortgage |
| Less than $50,000 | 5 (26.3%) | 0 (0.0%) |
| $50,000 to $99,999 | 2 (10.5%) | 3 (15.0%) |
| $100,000 to $299,999 | 6 (31.6%) | 14 (70.0%) |
| $300,000 to $499,999 | 6 (31.6%) | 3 (15.0%) |
| $500,000 to $749,999 | 0 (0.0%) | 0 (0.0%) |
| $750,000 to $999,999 | 0 (0.0%) | 0 (0.0%) |
| $1,000,000 or more | 0 (0.0%) | 0 (0.0%) |
| Total | 19 (100.0%) | 20 (100.0%) |
Household Income by Mortgage Status in Allensworth
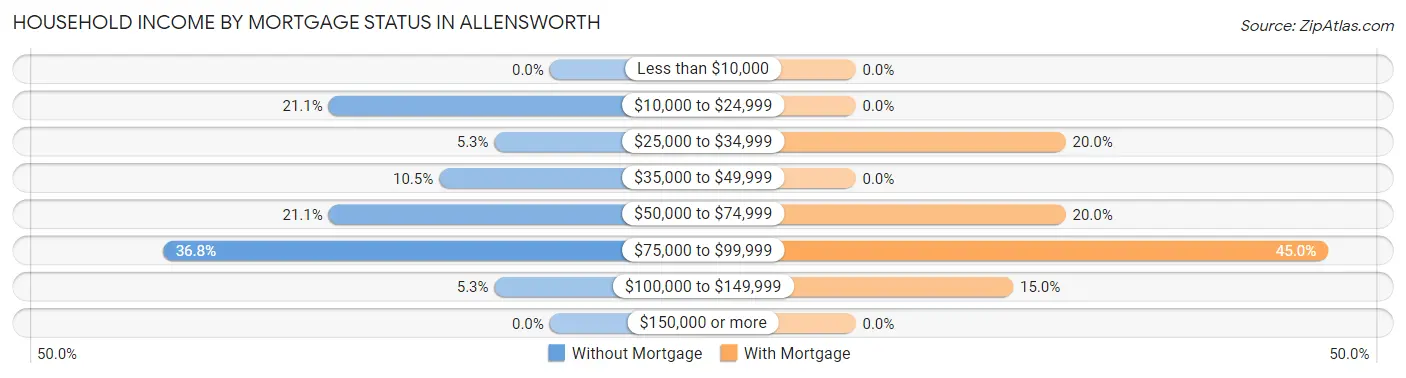
| Household Income | Without Mortgage | With Mortgage |
| Less than $10,000 | 0 (0.0%) | 0 (0.0%) |
| $10,000 to $24,999 | 4 (21.0%) | 0 (0.0%) |
| $25,000 to $34,999 | 1 (5.3%) | 4 (20.0%) |
| $35,000 to $49,999 | 2 (10.5%) | 0 (0.0%) |
| $50,000 to $74,999 | 4 (21.0%) | 4 (20.0%) |
| $75,000 to $99,999 | 7 (36.8%) | 9 (45.0%) |
| $100,000 to $149,999 | 1 (5.3%) | 3 (15.0%) |
| $150,000 or more | 0 (0.0%) | 0 (0.0%) |
| Total | 19 (100.0%) | 20 (100.0%) |
Property Value to Household Income Ratio in Allensworth
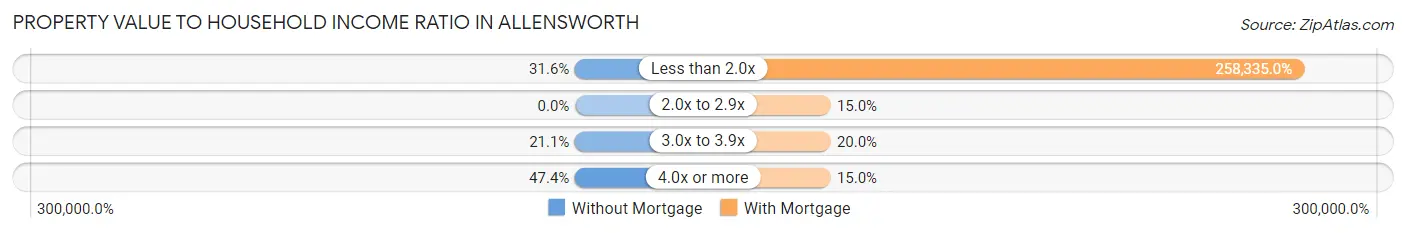
| Value-to-Income Ratio | Without Mortgage | With Mortgage |
| Less than 2.0x | 6 (31.6%) | 51,667 (258,335.0%) |
| 2.0x to 2.9x | 0 (0.0%) | 3 (15.0%) |
| 3.0x to 3.9x | 4 (21.0%) | 4 (20.0%) |
| 4.0x or more | 9 (47.4%) | 3 (15.0%) |
| Total | 19 (100.0%) | 20 (100.0%) |
Real Estate Taxes by Mortgage Status in Allensworth
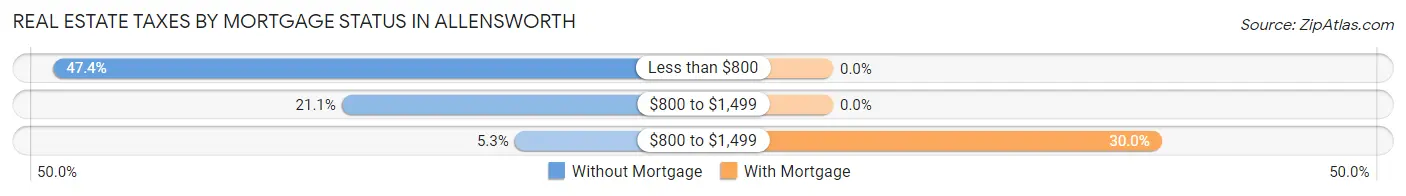
| Property Taxes | Without Mortgage | With Mortgage |
| Less than $800 | 9 (47.4%) | 0 (0.0%) |
| $800 to $1,499 | 4 (21.0%) | 0 (0.0%) |
| $800 to $1,499 | 1 (5.3%) | 6 (30.0%) |
| Total | 19 (100.0%) | 20 (100.0%) |
Health & Disability in Allensworth
Health Insurance Coverage by Age in Allensworth
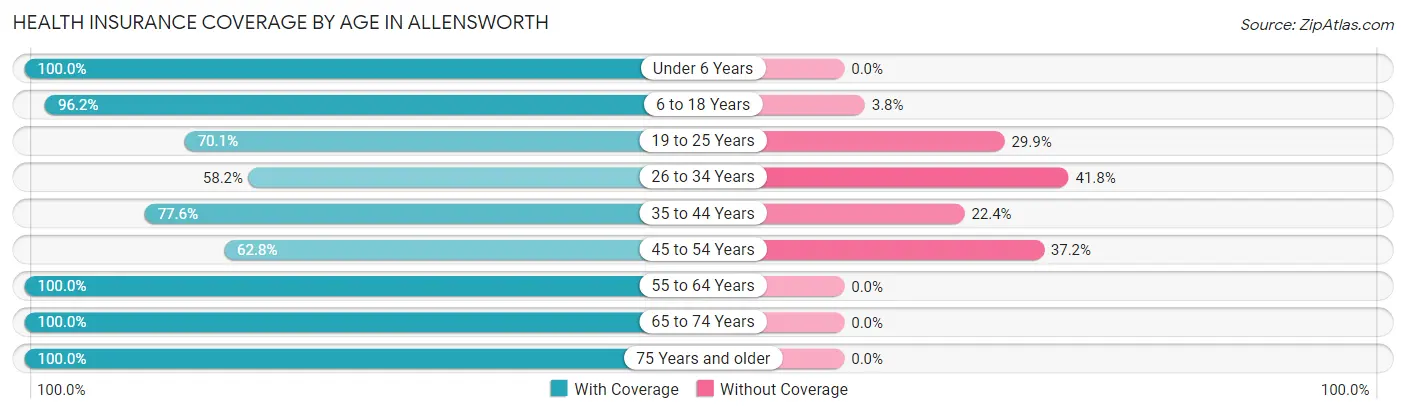
| Age Bracket | With Coverage | Without Coverage |
| Under 6 Years | 34 (100.0%) | 0 (0.0%) |
| 6 to 18 Years | 126 (96.2%) | 5 (3.8%) |
| 19 to 25 Years | 54 (70.1%) | 23 (29.9%) |
| 26 to 34 Years | 32 (58.2%) | 23 (41.8%) |
| 35 to 44 Years | 45 (77.6%) | 13 (22.4%) |
| 45 to 54 Years | 27 (62.8%) | 16 (37.2%) |
| 55 to 64 Years | 41 (100.0%) | 0 (0.0%) |
| 65 to 74 Years | 15 (100.0%) | 0 (0.0%) |
| 75 Years and older | 5 (100.0%) | 0 (0.0%) |
| Total | 379 (82.6%) | 80 (17.4%) |
Health Insurance Coverage by Citizenship Status in Allensworth
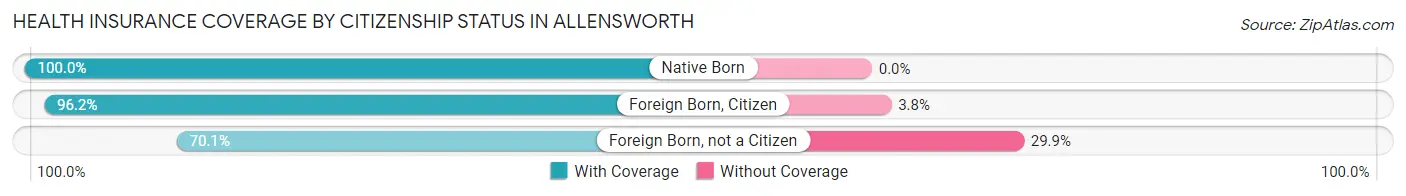
| Citizenship Status | With Coverage | Without Coverage |
| Native Born | 34 (100.0%) | 0 (0.0%) |
| Foreign Born, Citizen | 126 (96.2%) | 5 (3.8%) |
| Foreign Born, not a Citizen | 54 (70.1%) | 23 (29.9%) |
Health Insurance Coverage by Household Income in Allensworth
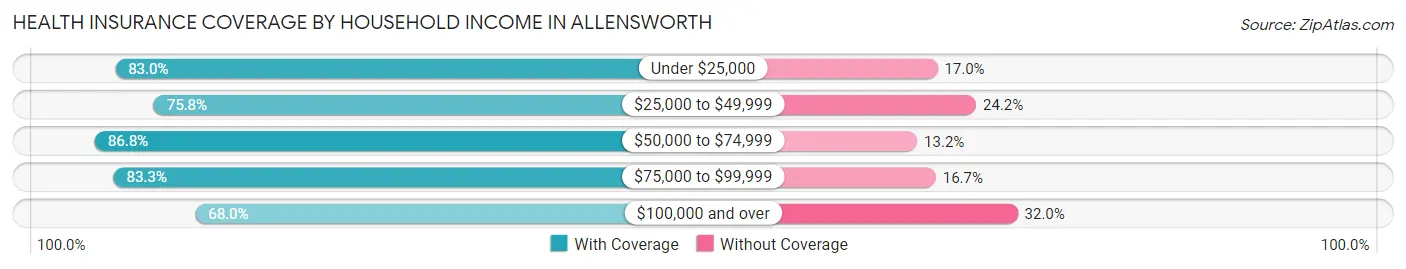
| Household Income | With Coverage | Without Coverage |
| Under $25,000 | 44 (83.0%) | 9 (17.0%) |
| $25,000 to $49,999 | 72 (75.8%) | 23 (24.2%) |
| $50,000 to $74,999 | 191 (86.8%) | 29 (13.2%) |
| $75,000 to $99,999 | 55 (83.3%) | 11 (16.7%) |
| $100,000 and over | 17 (68.0%) | 8 (32.0%) |
Public vs Private Health Insurance Coverage by Age in Allensworth
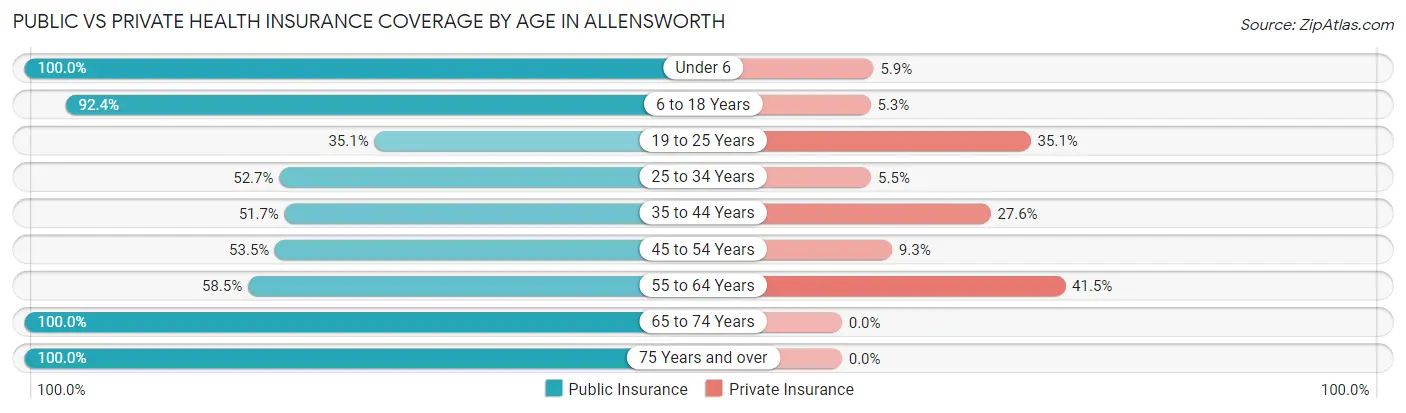
| Age Bracket | Public Insurance | Private Insurance |
| Under 6 | 34 (100.0%) | 2 (5.9%) |
| 6 to 18 Years | 121 (92.4%) | 7 (5.3%) |
| 19 to 25 Years | 27 (35.1%) | 27 (35.1%) |
| 25 to 34 Years | 29 (52.7%) | 3 (5.4%) |
| 35 to 44 Years | 30 (51.7%) | 16 (27.6%) |
| 45 to 54 Years | 23 (53.5%) | 4 (9.3%) |
| 55 to 64 Years | 24 (58.5%) | 17 (41.5%) |
| 65 to 74 Years | 15 (100.0%) | 0 (0.0%) |
| 75 Years and over | 5 (100.0%) | 0 (0.0%) |
| Total | 308 (67.1%) | 76 (16.6%) |
Disability Status by Sex by Age in Allensworth
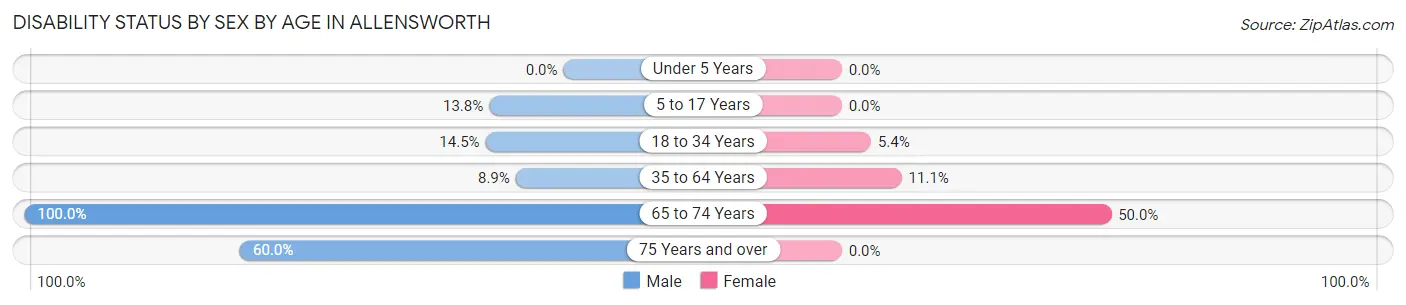
| Age Bracket | Male | Female |
| Under 5 Years | 0 (0.0%) | 0 (0.0%) |
| 5 to 17 Years | 8 (13.8%) | 0 (0.0%) |
| 18 to 34 Years | 11 (14.5%) | 4 (5.4%) |
| 35 to 64 Years | 7 (8.9%) | 7 (11.1%) |
| 65 to 74 Years | 9 (100.0%) | 3 (50.0%) |
| 75 Years and over | 3 (60.0%) | 0 (0.0%) |
Disability Class by Sex by Age in Allensworth
Disability Class: Hearing Difficulty
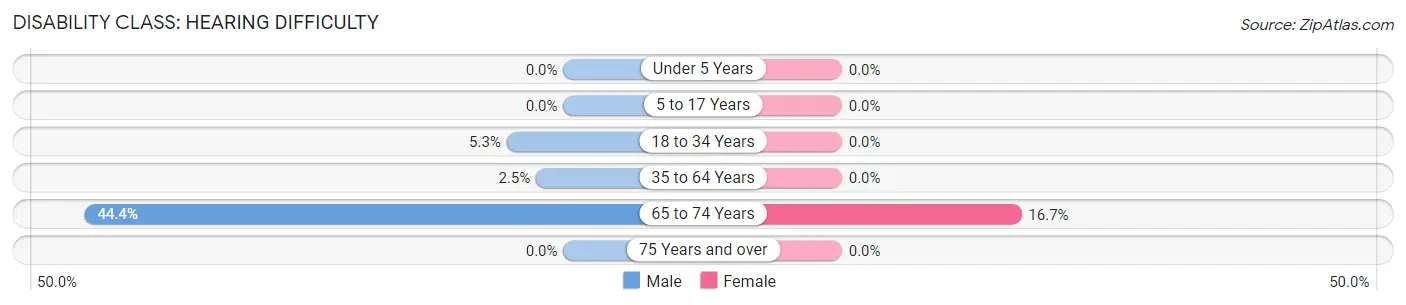
| Age Bracket | Male | Female |
| Under 5 Years | 0 (0.0%) | 0 (0.0%) |
| 5 to 17 Years | 0 (0.0%) | 0 (0.0%) |
| 18 to 34 Years | 4 (5.3%) | 0 (0.0%) |
| 35 to 64 Years | 2 (2.5%) | 0 (0.0%) |
| 65 to 74 Years | 4 (44.4%) | 1 (16.7%) |
| 75 Years and over | 0 (0.0%) | 0 (0.0%) |
Disability Class: Vision Difficulty
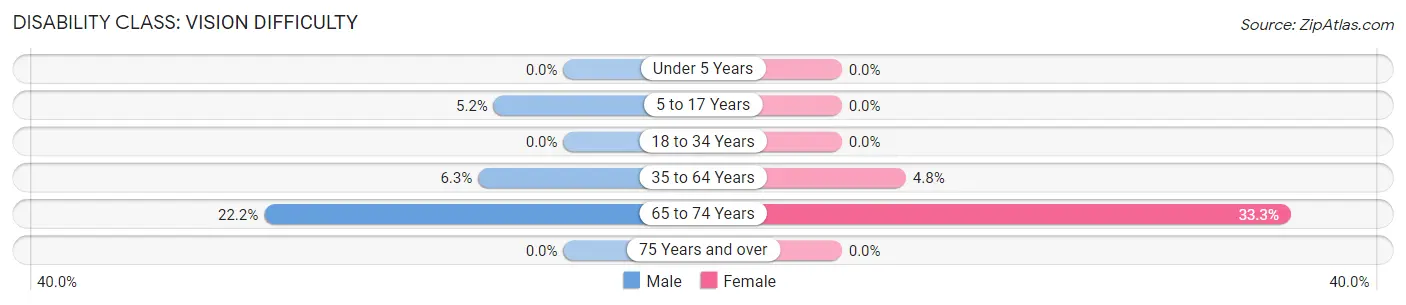
| Age Bracket | Male | Female |
| Under 5 Years | 0 (0.0%) | 0 (0.0%) |
| 5 to 17 Years | 3 (5.2%) | 0 (0.0%) |
| 18 to 34 Years | 0 (0.0%) | 0 (0.0%) |
| 35 to 64 Years | 5 (6.3%) | 3 (4.8%) |
| 65 to 74 Years | 2 (22.2%) | 2 (33.3%) |
| 75 Years and over | 0 (0.0%) | 0 (0.0%) |
Disability Class: Cognitive Difficulty
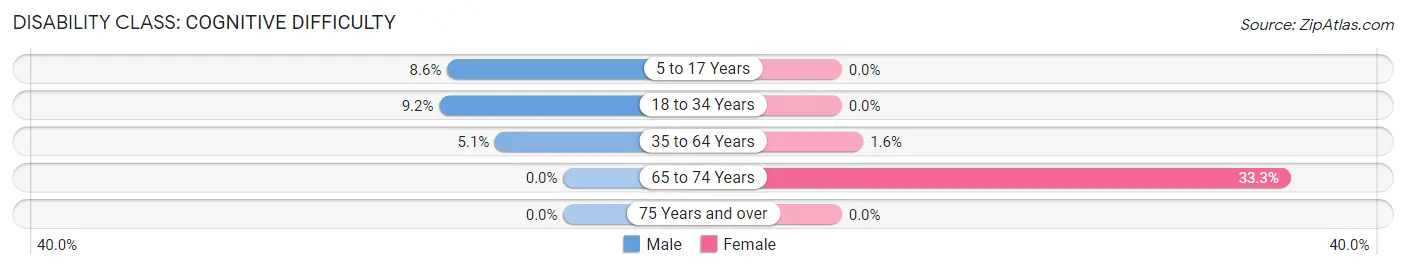
| Age Bracket | Male | Female |
| 5 to 17 Years | 5 (8.6%) | 0 (0.0%) |
| 18 to 34 Years | 7 (9.2%) | 0 (0.0%) |
| 35 to 64 Years | 4 (5.1%) | 1 (1.6%) |
| 65 to 74 Years | 0 (0.0%) | 2 (33.3%) |
| 75 Years and over | 0 (0.0%) | 0 (0.0%) |
Disability Class: Ambulatory Difficulty
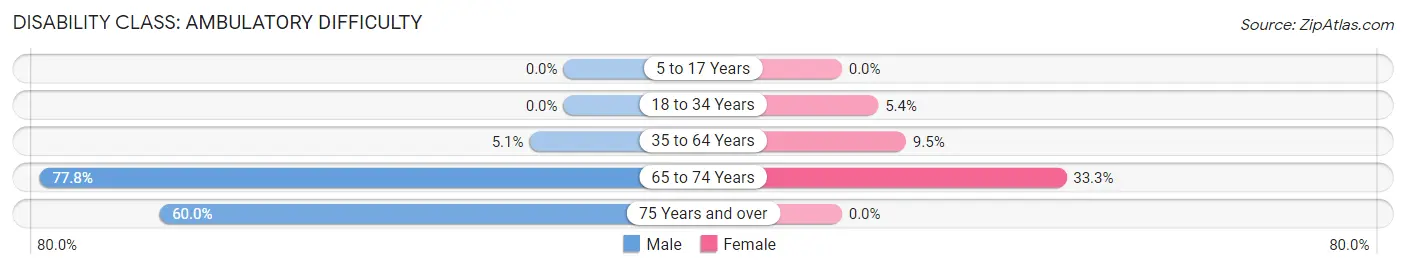
| Age Bracket | Male | Female |
| 5 to 17 Years | 0 (0.0%) | 0 (0.0%) |
| 18 to 34 Years | 0 (0.0%) | 4 (5.4%) |
| 35 to 64 Years | 4 (5.1%) | 6 (9.5%) |
| 65 to 74 Years | 7 (77.8%) | 2 (33.3%) |
| 75 Years and over | 3 (60.0%) | 0 (0.0%) |
Disability Class: Self-Care Difficulty
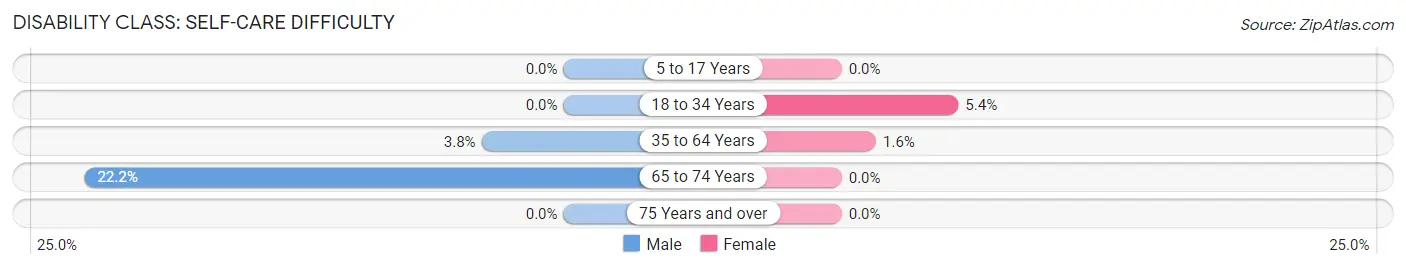
| Age Bracket | Male | Female |
| 5 to 17 Years | 0 (0.0%) | 0 (0.0%) |
| 18 to 34 Years | 0 (0.0%) | 4 (5.4%) |
| 35 to 64 Years | 3 (3.8%) | 1 (1.6%) |
| 65 to 74 Years | 2 (22.2%) | 0 (0.0%) |
| 75 Years and over | 0 (0.0%) | 0 (0.0%) |
Technology Access in Allensworth
Computing Device Access in Allensworth
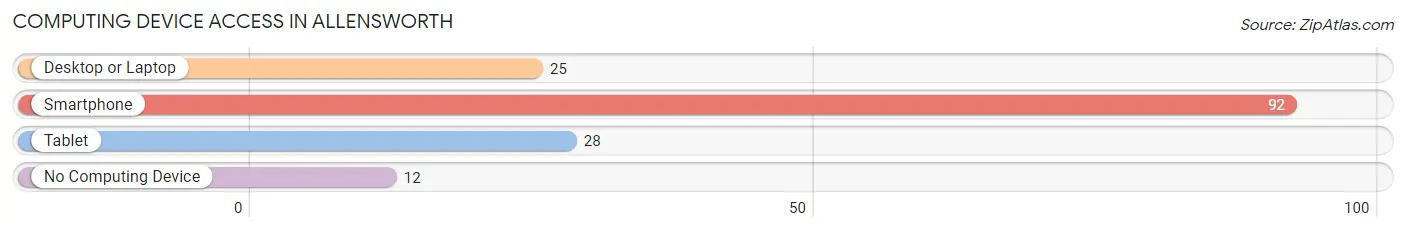
| Device Type | # Households | % Households |
| Desktop or Laptop | 25 | 24.0% |
| Smartphone | 92 | 88.5% |
| Tablet | 28 | 26.9% |
| No Computing Device | 12 | 11.5% |
| Total | 104 | 100.0% |
Internet Access in Allensworth
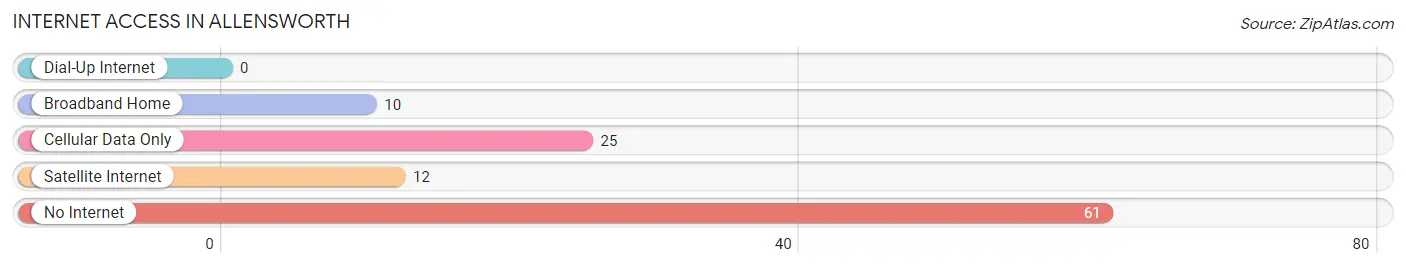
| Internet Type | # Households | % Households |
| Dial-Up Internet | 0 | 0.0% |
| Broadband Home | 10 | 9.6% |
| Cellular Data Only | 25 | 24.0% |
| Satellite Internet | 12 | 11.5% |
| No Internet | 61 | 58.7% |
| Total | 104 | 100.0% |
Allensworth Summary
Allensworth is a small unincorporated community located in Tulare County, California. It is situated in the San Joaquin Valley, approximately 30 miles north of Bakersfield. The town was founded in 1908 by Colonel Allen Allensworth, a former slave who had served in the Union Army during the Civil War. Allensworth was the first town in California to be founded, financed, and governed by African Americans.
History
Colonel Allensworth was born into slavery in Kentucky in 1842. After the Civil War, he joined the Union Army and rose to the rank of lieutenant colonel. After the war, he became a minister and eventually moved to California. In 1908, he and a group of African American investors purchased 1,400 acres of land in the San Joaquin Valley and founded the town of Allensworth.
The town was designed to be a self-sufficient community where African Americans could live and work without fear of discrimination. Allensworth was incorporated in 1914 and had a population of about 500 people. The town had its own school, churches, businesses, and a post office.
The town flourished for several years, but by the 1930s, the Great Depression had taken its toll. Many of the town’s residents moved away in search of work. In the 1940s, the town was almost completely abandoned. In 1976, the state of California purchased the town and established the Colonel Allensworth State Historic Park.
Geography
Allensworth is located in the San Joaquin Valley, approximately 30 miles north of Bakersfield. The town is situated on the west side of the valley, near the foothills of the Sierra Nevada Mountains. The town is surrounded by agricultural land, including vineyards, orchards, and fields of cotton and alfalfa.
The climate in Allensworth is hot and dry in the summer, with temperatures often reaching over 100 degrees Fahrenheit. Winters are mild, with temperatures rarely dropping below freezing. The area receives an average of 8 inches of rain per year.
Economy
The economy of Allensworth is largely based on agriculture. The town is surrounded by vineyards, orchards, and fields of cotton and alfalfa. The town also has a few small businesses, including a cafe, a general store, and a gas station.
The town is also home to the Colonel Allensworth State Historic Park, which is a popular tourist destination. The park offers camping, hiking, and other outdoor activities.
Demographics
As of the 2010 census, the population of Allensworth was 437. The racial makeup of the town was 94.2% White, 0.7% African American, 0.2% Native American, 0.2% Asian, 0.2% Pacific Islander, and 4.7% from other races. The median household income was $37,500.
Allensworth is a small, rural community with a rich history. The town was founded by African Americans in 1908 and has since become a popular tourist destination. The town is surrounded by agricultural land and is home to a few small businesses. The population of Allensworth is diverse, with a mix of White, African American, Native American, Asian, and Pacific Islander residents.
Common Questions
What is Per Capita Income in Allensworth?
Per Capita income in Allensworth is $12,198.
What is the Median Family Income in Allensworth?
Median Family Income in Allensworth is $49,276.
What is the Median Household income in Allensworth?
Median Household Income in Allensworth is $53,500.
What is Income or Wage Gap in Allensworth?
Income or Wage Gap in Allensworth is 4.9%.
Women in Allensworth earn 95.1 cents for every dollar earned by a man.
What is Inequality or Gini Index in Allensworth?
Inequality or Gini Index in Allensworth is 0.31.
What is the Total Population of Allensworth?
Total Population of Allensworth is 459.
What is the Total Male Population of Allensworth?
Total Male Population of Allensworth is 239.
What is the Total Female Population of Allensworth?
Total Female Population of Allensworth is 220.
What is the Ratio of Males per 100 Females in Allensworth?
There are 108.64 Males per 100 Females in Allensworth.
What is the Ratio of Females per 100 Males in Allensworth?
There are 92.05 Females per 100 Males in Allensworth.
What is the Median Population Age in Allensworth?
Median Population Age in Allensworth is 25.2 Years.
What is the Average Family Size in Allensworth
Average Family Size in Allensworth is 4.3 People.
What is the Average Household Size in Allensworth
Average Household Size in Allensworth is 4.4 People.
How Large is the Labor Force in Allensworth?
There are 199 People in the Labor Forcein in Allensworth.
What is the Percentage of People in the Labor Force in Allensworth?
61.2% of People are in the Labor Force in Allensworth.
What is the Unemployment Rate in Allensworth?
Unemployment Rate in Allensworth is 25.1%.