Winton, CA Map & Demographics
Winton Map
Winton Overview
$20,873
PER CAPITA INCOME
$58,161
AVG FAMILY INCOME
$54,503
AVG HOUSEHOLD INCOME
40.9%
WAGE / INCOME GAP [ % ]
59.1¢/ $1
WAGE / INCOME GAP [ $ ]
0.38
INEQUALITY / GINI INDEX
11,986
TOTAL POPULATION
6,577
MALE POPULATION
5,409
FEMALE POPULATION
121.59
MALES / 100 FEMALES
82.24
FEMALES / 100 MALES
29.1
MEDIAN AGE
4.2
AVG FAMILY SIZE
3.7
AVG HOUSEHOLD SIZE
5,005
LABOR FORCE [ PEOPLE ]
58.6%
PERCENT IN LABOR FORCE
11.3%
UNEMPLOYMENT RATE
Winton Zip Codes
Winton Area Codes
Income in Winton
Income Overview in Winton
Per Capita Income in Winton is $20,873, while median incomes of families and households are $58,161 and $54,503 respectively.
| Characteristic | Number | Measure |
| Per Capita Income | 11,986 | $20,873 |
| Median Family Income | 2,460 | $58,161 |
| Mean Family Income | 2,460 | $74,775 |
| Median Household Income | 3,271 | $54,503 |
| Mean Household Income | 3,271 | $72,474 |
| Income Deficit | 2,460 | $0 |
| Wage / Income Gap (%) | 11,986 | 40.87% |
| Wage / Income Gap ($) | 11,986 | 59.13¢ per $1 |
| Gini / Inequality Index | 11,986 | 0.38 |
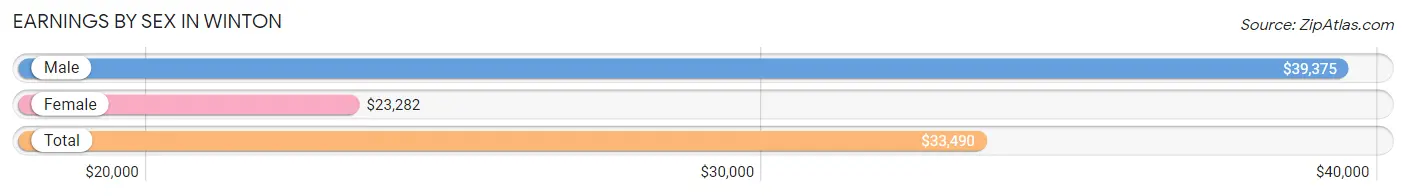
Earnings by Sex in Winton
Average Earnings in Winton are $33,490, $39,375 for men and $23,282 for women, a difference of 40.9%.
| Sex | Number | Average Earnings |
| Male | 3,258 (62.7%) | $39,375 |
| Female | 1,941 (37.3%) | $23,282 |
| Total | 5,199 (100.0%) | $33,490 |
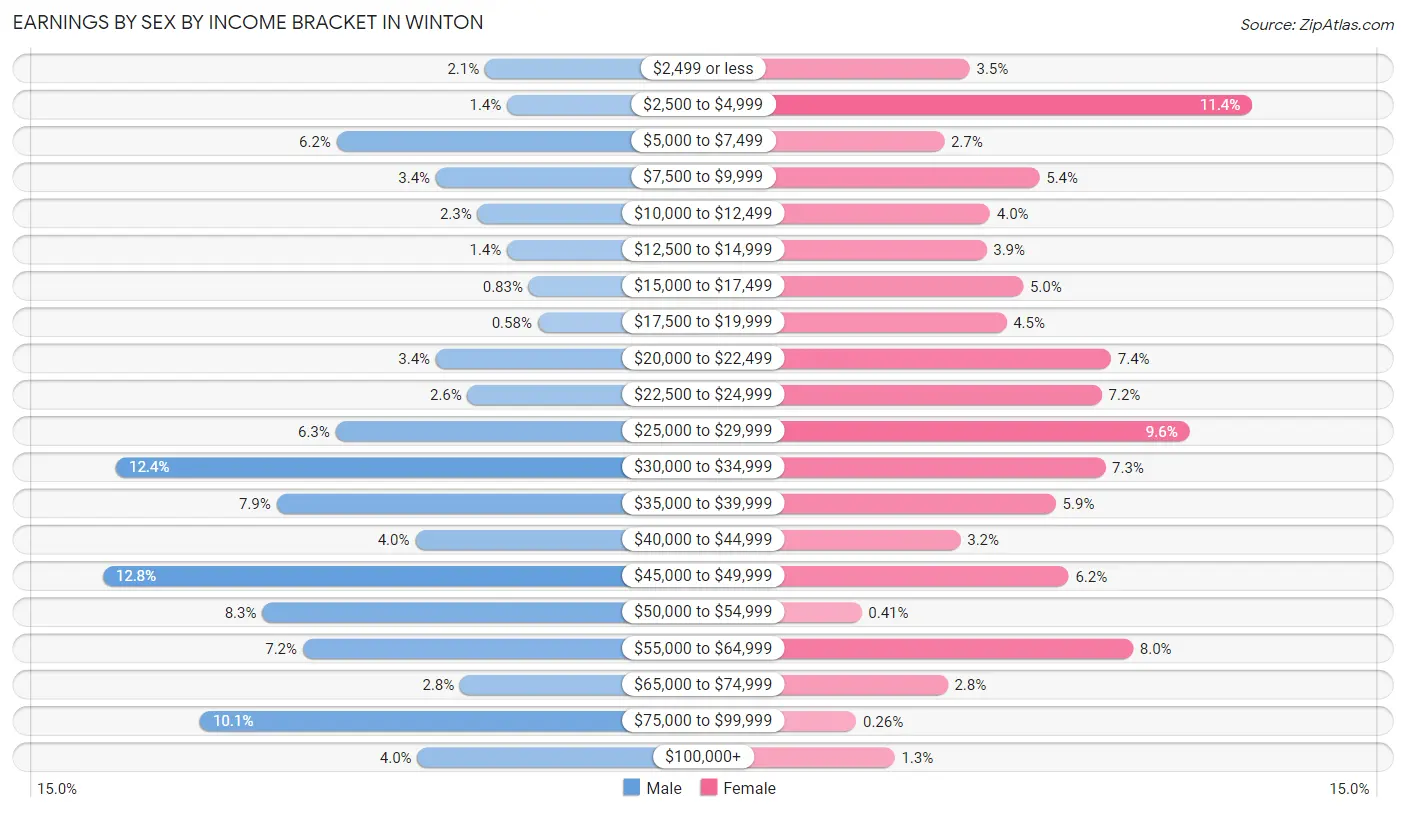
Earnings by Sex by Income Bracket in Winton
The most common earnings brackets in Winton are $45,000 to $49,999 for men (417 | 12.8%) and $2,500 to $4,999 for women (221 | 11.4%).
| Income | Male | Female |
| $2,499 or less | 67 (2.1%) | 67 (3.5%) |
| $2,500 to $4,999 | 47 (1.4%) | 221 (11.4%) |
| $5,000 to $7,499 | 203 (6.2%) | 53 (2.7%) |
| $7,500 to $9,999 | 112 (3.4%) | 105 (5.4%) |
| $10,000 to $12,499 | 74 (2.3%) | 78 (4.0%) |
| $12,500 to $14,999 | 47 (1.4%) | 76 (3.9%) |
| $15,000 to $17,499 | 27 (0.8%) | 96 (5.0%) |
| $17,500 to $19,999 | 19 (0.6%) | 87 (4.5%) |
| $20,000 to $22,499 | 112 (3.4%) | 144 (7.4%) |
| $22,500 to $24,999 | 83 (2.5%) | 139 (7.2%) |
| $25,000 to $29,999 | 204 (6.3%) | 187 (9.6%) |
| $30,000 to $34,999 | 405 (12.4%) | 141 (7.3%) |
| $35,000 to $39,999 | 258 (7.9%) | 114 (5.9%) |
| $40,000 to $44,999 | 131 (4.0%) | 62 (3.2%) |
| $45,000 to $49,999 | 417 (12.8%) | 121 (6.2%) |
| $50,000 to $54,999 | 271 (8.3%) | 8 (0.4%) |
| $55,000 to $64,999 | 234 (7.2%) | 156 (8.0%) |
| $65,000 to $74,999 | 90 (2.8%) | 55 (2.8%) |
| $75,000 to $99,999 | 328 (10.1%) | 5 (0.3%) |
| $100,000+ | 129 (4.0%) | 26 (1.3%) |
| Total | 3,258 (100.0%) | 1,941 (100.0%) |
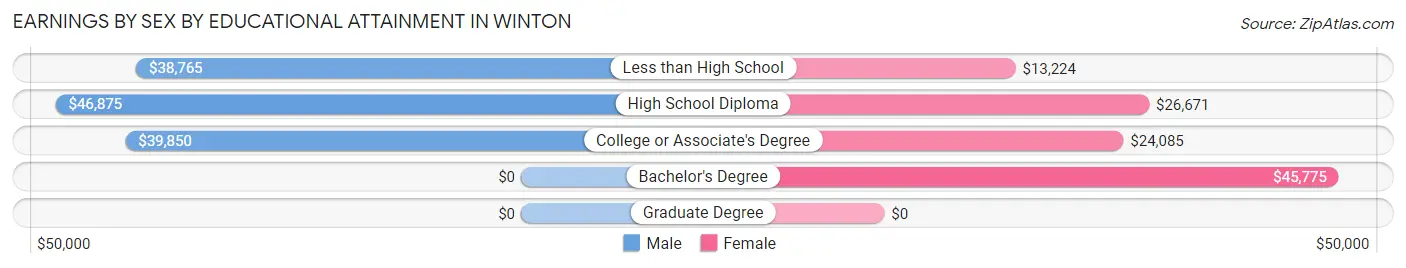
Earnings by Sex by Educational Attainment in Winton
Average earnings in Winton are $42,574 for men and $24,204 for women, a difference of 43.1%. Men with an educational attainment of high school diploma enjoy the highest average annual earnings of $46,875, while those with less than high school education earn the least with $38,765. Women with an educational attainment of bachelor's degree earn the most with the average annual earnings of $45,775, while those with less than high school education have the smallest earnings of $13,224.
| Educational Attainment | Male Income | Female Income |
| Less than High School | $38,765 | $13,224 |
| High School Diploma | $46,875 | $26,671 |
| College or Associate's Degree | $39,850 | $24,085 |
| Bachelor's Degree | - | - |
| Graduate Degree | - | - |
| Total | $42,574 | $24,204 |
Family Income in Winton
Family Income Brackets in Winton
According to the Winton family income data, there are 662 families falling into the $50,000 to $74,999 income range, which is the most common income bracket and makes up 26.9% of all families. Conversely, the $10,000 to $14,999 income bracket is the least frequent group with only 27 families (1.1%) belonging to this category.
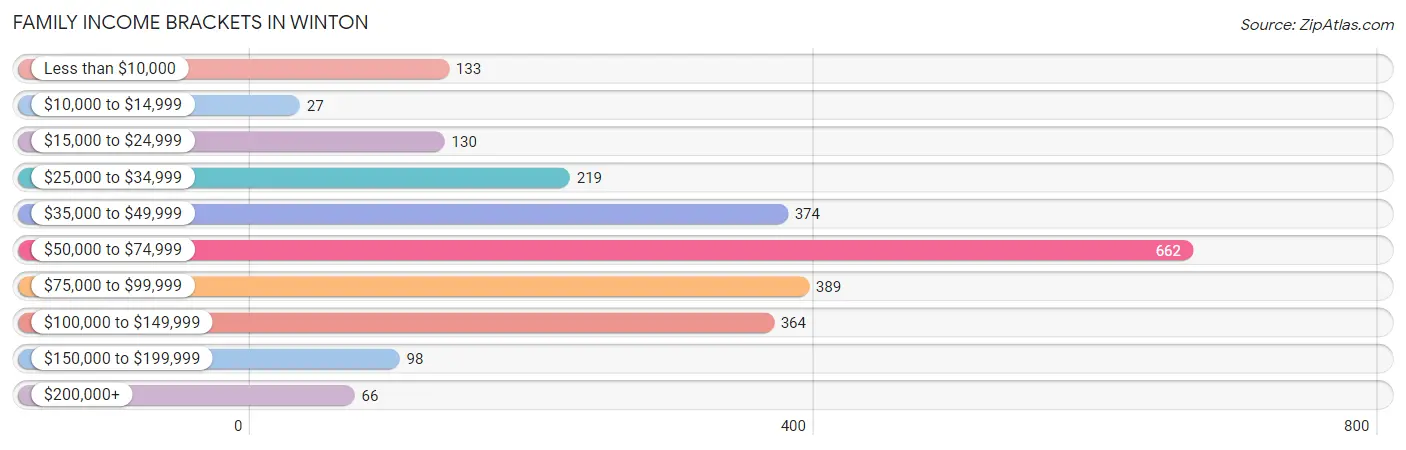
| Income Bracket | # Families | % Families |
| Less than $10,000 | 133 | 5.4% |
| $10,000 to $14,999 | 27 | 1.1% |
| $15,000 to $24,999 | 130 | 5.3% |
| $25,000 to $34,999 | 219 | 8.9% |
| $35,000 to $49,999 | 374 | 15.2% |
| $50,000 to $74,999 | 662 | 26.9% |
| $75,000 to $99,999 | 389 | 15.8% |
| $100,000 to $149,999 | 364 | 14.8% |
| $150,000 to $199,999 | 98 | 4.0% |
| $200,000+ | 66 | 2.7% |
Family Income by Famaliy Size in Winton
6-person families (87 | 3.5%) account for the highest median family income in Winton with $123,472 per family, while 2-person families (669 | 27.2%) have the highest median income of $23,789 per family member.
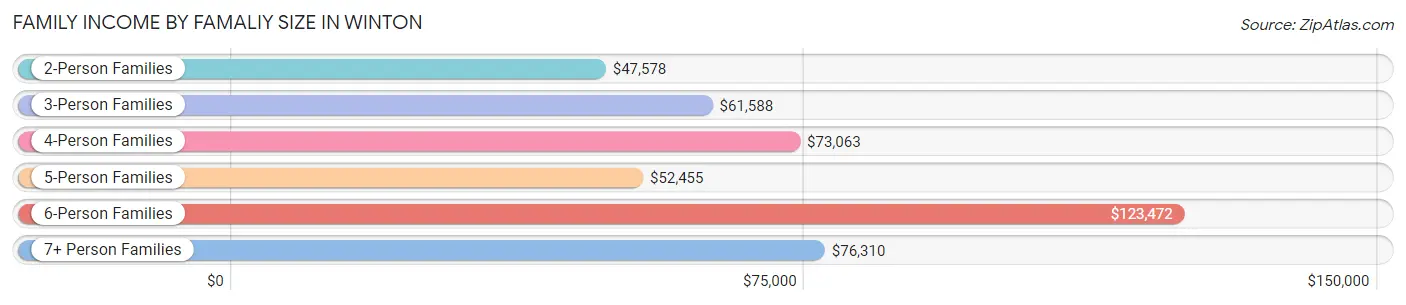
| Income Bracket | # Families | Median Income |
| 2-Person Families | 669 (27.2%) | $47,578 |
| 3-Person Families | 533 (21.7%) | $61,588 |
| 4-Person Families | 438 (17.8%) | $73,063 |
| 5-Person Families | 517 (21.0%) | $52,455 |
| 6-Person Families | 87 (3.5%) | $123,472 |
| 7+ Person Families | 216 (8.8%) | $76,310 |
| Total | 2,460 (100.0%) | $58,161 |
Family Income by Number of Earners in Winton
The median family income in Winton is $58,161, with families comprising 3+ earners (287) having the highest median family income of $104,297, while families with no earners (319) have the lowest median family income of $27,740, accounting for 11.7% and 13.0% of families, respectively.
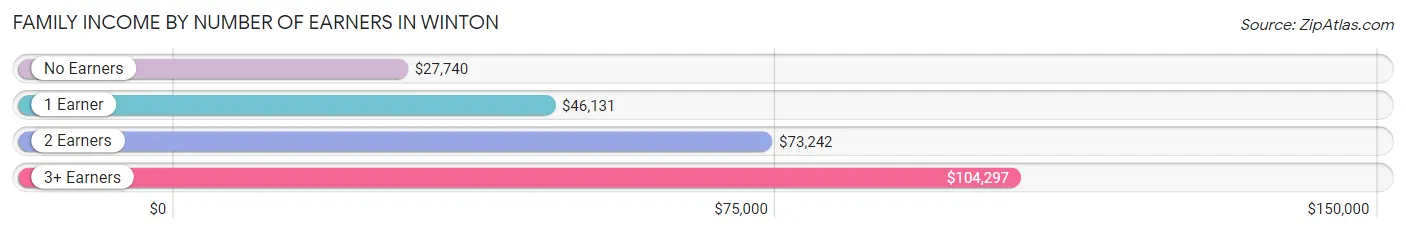
| Number of Earners | # Families | Median Income |
| No Earners | 319 (13.0%) | $27,740 |
| 1 Earner | 1,025 (41.7%) | $46,131 |
| 2 Earners | 829 (33.7%) | $73,242 |
| 3+ Earners | 287 (11.7%) | $104,297 |
| Total | 2,460 (100.0%) | $58,161 |
Household Income in Winton
Household Income Brackets in Winton
With 798 households falling in the category, the $50,000 to $74,999 income range is the most frequent in Winton, accounting for 24.4% of all households. In contrast, only 75 households (2.3%) fall into the $200,000+ income bracket, making it the least populous group.
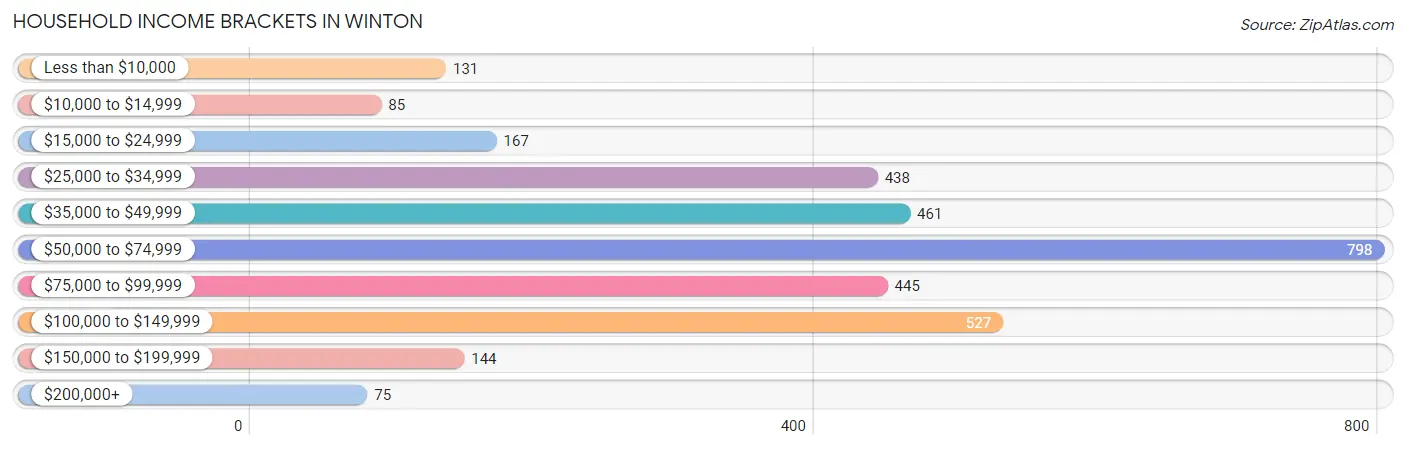
| Income Bracket | # Households | % Households |
| Less than $10,000 | 131 | 4.0% |
| $10,000 to $14,999 | 85 | 2.6% |
| $15,000 to $24,999 | 167 | 5.1% |
| $25,000 to $34,999 | 438 | 13.4% |
| $35,000 to $49,999 | 461 | 14.1% |
| $50,000 to $74,999 | 798 | 24.4% |
| $75,000 to $99,999 | 445 | 13.6% |
| $100,000 to $149,999 | 527 | 16.1% |
| $150,000 to $199,999 | 144 | 4.4% |
| $200,000+ | 75 | 2.3% |
Household Income by Householder Age in Winton
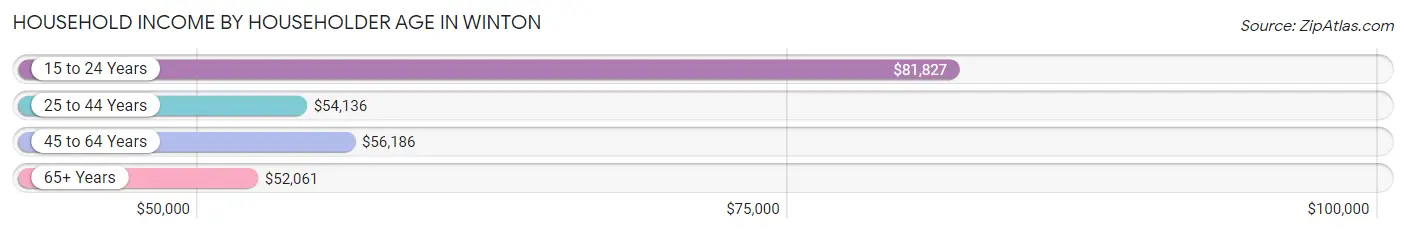
The median household income in Winton is $54,503, with the highest median household income of $81,827 found in the 15 to 24 years age bracket for the primary householder. A total of 110 households (3.4%) fall into this category. Meanwhile, the 65+ years age bracket for the primary householder has the lowest median household income of $52,061, with 660 households (20.2%) in this group.
| Income Bracket | # Households | Median Income |
| 15 to 24 Years | 110 (3.4%) | $81,827 |
| 25 to 44 Years | 1,398 (42.7%) | $54,136 |
| 45 to 64 Years | 1,103 (33.7%) | $56,186 |
| 65+ Years | 660 (20.2%) | $52,061 |
| Total | 3,271 (100.0%) | $54,503 |
Poverty in Winton
Income Below Poverty by Sex and Age in Winton
With 13.9% poverty level for males and 19.7% for females among the residents of Winton, under 5 year old males and 15 year old females are the most vulnerable to poverty, with 217 males (34.4%) and 18 females (64.3%) in their respective age groups living below the poverty level.
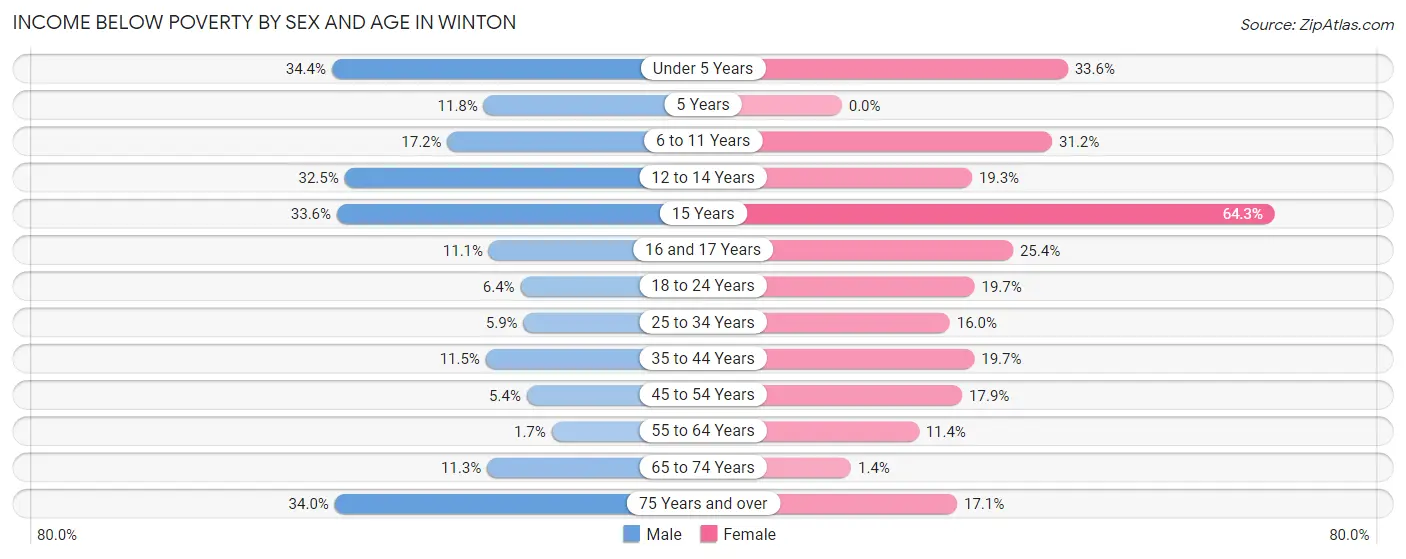
| Age Bracket | Male | Female |
| Under 5 Years | 217 (34.4%) | 158 (33.6%) |
| 5 Years | 27 (11.8%) | 0 (0.0%) |
| 6 to 11 Years | 108 (17.2%) | 183 (31.2%) |
| 12 to 14 Years | 115 (32.5%) | 69 (19.3%) |
| 15 Years | 38 (33.6%) | 18 (64.3%) |
| 16 and 17 Years | 22 (11.1%) | 61 (25.4%) |
| 18 to 24 Years | 46 (6.4%) | 107 (19.7%) |
| 25 to 34 Years | 63 (5.9%) | 150 (16.0%) |
| 35 to 44 Years | 107 (11.5%) | 110 (19.7%) |
| 45 to 54 Years | 29 (5.4%) | 99 (17.9%) |
| 55 to 64 Years | 9 (1.7%) | 61 (11.4%) |
| 65 to 74 Years | 45 (11.3%) | 4 (1.4%) |
| 75 Years and over | 90 (34.0%) | 45 (17.1%) |
| Total | 916 (13.9%) | 1,065 (19.7%) |
Income Above Poverty by Sex and Age in Winton
According to the poverty statistics in Winton, males aged 55 to 64 years and females aged 5 years are the age groups that are most secure financially, with 98.3% of males and 100.0% of females in these age groups living above the poverty line.
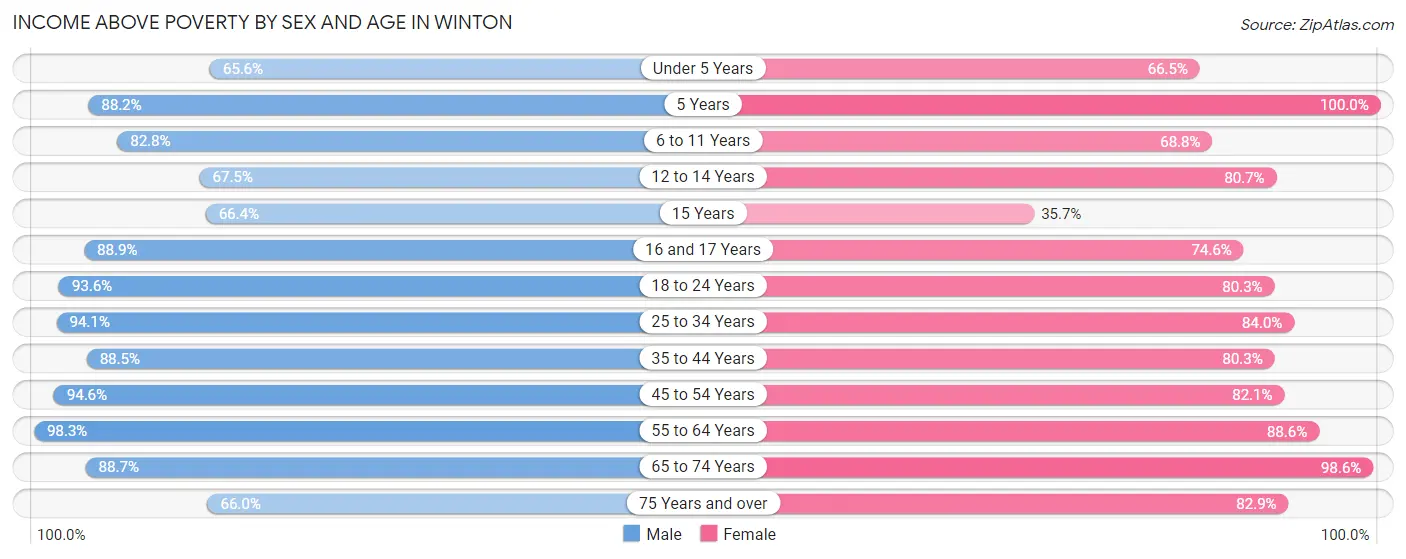
| Age Bracket | Male | Female |
| Under 5 Years | 414 (65.6%) | 313 (66.4%) |
| 5 Years | 201 (88.2%) | 36 (100.0%) |
| 6 to 11 Years | 519 (82.8%) | 403 (68.8%) |
| 12 to 14 Years | 239 (67.5%) | 288 (80.7%) |
| 15 Years | 75 (66.4%) | 10 (35.7%) |
| 16 and 17 Years | 177 (88.9%) | 179 (74.6%) |
| 18 to 24 Years | 676 (93.6%) | 436 (80.3%) |
| 25 to 34 Years | 999 (94.1%) | 785 (84.0%) |
| 35 to 44 Years | 821 (88.5%) | 449 (80.3%) |
| 45 to 54 Years | 504 (94.6%) | 455 (82.1%) |
| 55 to 64 Years | 509 (98.3%) | 473 (88.6%) |
| 65 to 74 Years | 352 (88.7%) | 285 (98.6%) |
| 75 Years and over | 175 (66.0%) | 218 (82.9%) |
| Total | 5,661 (86.1%) | 4,330 (80.3%) |
Income Below Poverty Among Married-Couple Families in Winton
The poverty statistics for married-couple families in Winton show that 10.4% or 157 of the total 1,513 families live below the poverty line. Families with 5 or more children have the highest poverty rate of 100.0%, comprising of 51 families. On the other hand, families with 1 or 2 children have the lowest poverty rate of 3.9%, which includes 16 families.
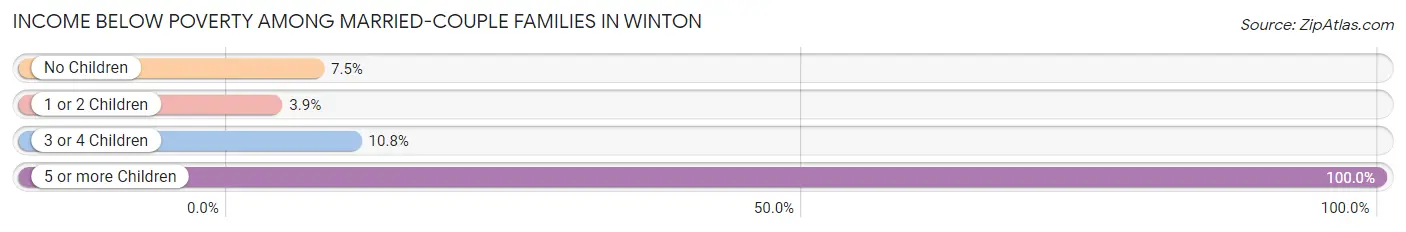
| Children | Above Poverty | Below Poverty |
| No Children | 642 (92.5%) | 52 (7.5%) |
| 1 or 2 Children | 399 (96.1%) | 16 (3.9%) |
| 3 or 4 Children | 315 (89.2%) | 38 (10.8%) |
| 5 or more Children | 0 (0.0%) | 51 (100.0%) |
| Total | 1,356 (89.6%) | 157 (10.4%) |
Income Below Poverty Among Single-Parent Households in Winton
According to the poverty data in Winton, 5.8% or 30 single-father households and 25.3% or 108 single-mother households are living below the poverty line. Among single-father households, those with 1 or 2 children have the highest poverty rate, with 30 households (9.0%) experiencing poverty. Likewise, among single-mother households, those with 3 or 4 children have the highest poverty rate, with 68 households (80.0%) falling below the poverty line.
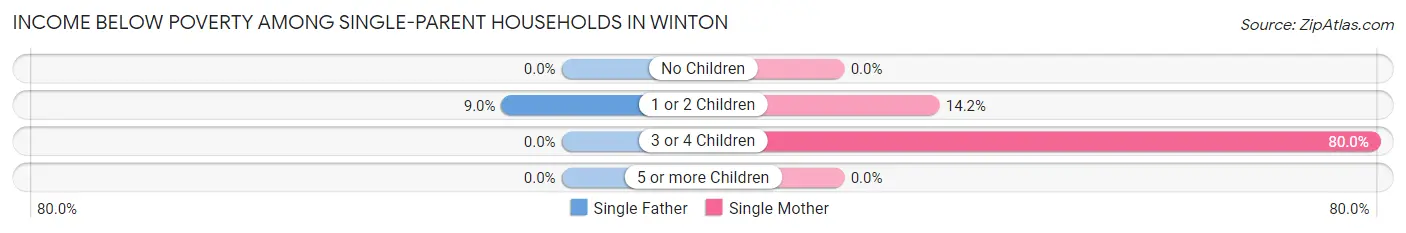
| Children | Single Father | Single Mother |
| No Children | 0 (0.0%) | 0 (0.0%) |
| 1 or 2 Children | 30 (9.0%) | 40 (14.2%) |
| 3 or 4 Children | 0 (0.0%) | 68 (80.0%) |
| 5 or more Children | 0 (0.0%) | 0 (0.0%) |
| Total | 30 (5.8%) | 108 (25.3%) |
Income Below Poverty Among Married-Couple vs Single-Parent Households in Winton
The poverty data for Winton shows that 157 of the married-couple family households (10.4%) and 138 of the single-parent households (14.6%) are living below the poverty level. Within the married-couple family households, those with 5 or more children have the highest poverty rate, with 51 households (100.0%) falling below the poverty line. Among the single-parent households, those with 3 or 4 children have the highest poverty rate, with 68 household (48.9%) living below poverty.
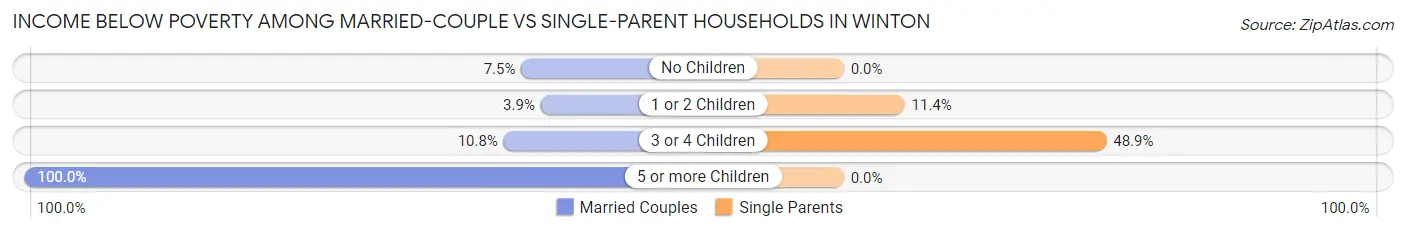
| Children | Married-Couple Families | Single-Parent Households |
| No Children | 52 (7.5%) | 0 (0.0%) |
| 1 or 2 Children | 16 (3.9%) | 70 (11.4%) |
| 3 or 4 Children | 38 (10.8%) | 68 (48.9%) |
| 5 or more Children | 51 (100.0%) | 0 (0.0%) |
| Total | 157 (10.4%) | 138 (14.6%) |
Race in Winton
The most populous races in Winton are Hispanic or Latino (9,496 | 79.2%), Some other Race (7,915 | 66.0%), and White / Caucasian (2,696 | 22.5%).
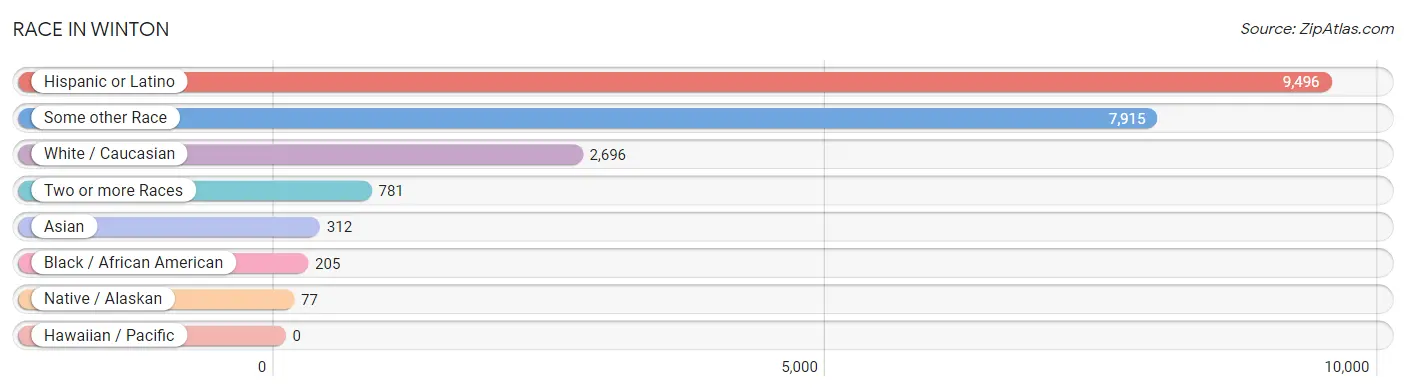
| Race | # Population | % Population |
| Asian | 312 | 2.6% |
| Black / African American | 205 | 1.7% |
| Hawaiian / Pacific | 0 | 0.0% |
| Hispanic or Latino | 9,496 | 79.2% |
| Native / Alaskan | 77 | 0.6% |
| White / Caucasian | 2,696 | 22.5% |
| Two or more Races | 781 | 6.5% |
| Some other Race | 7,915 | 66.0% |
| Total | 11,986 | 100.0% |
Ancestry in Winton
The most populous ancestries reported in Winton are Mexican (9,365 | 78.1%), Portuguese (391 | 3.3%), German (287 | 2.4%), Irish (274 | 2.3%), and Bangladeshi (172 | 1.4%), together accounting for 87.5% of all Winton residents.
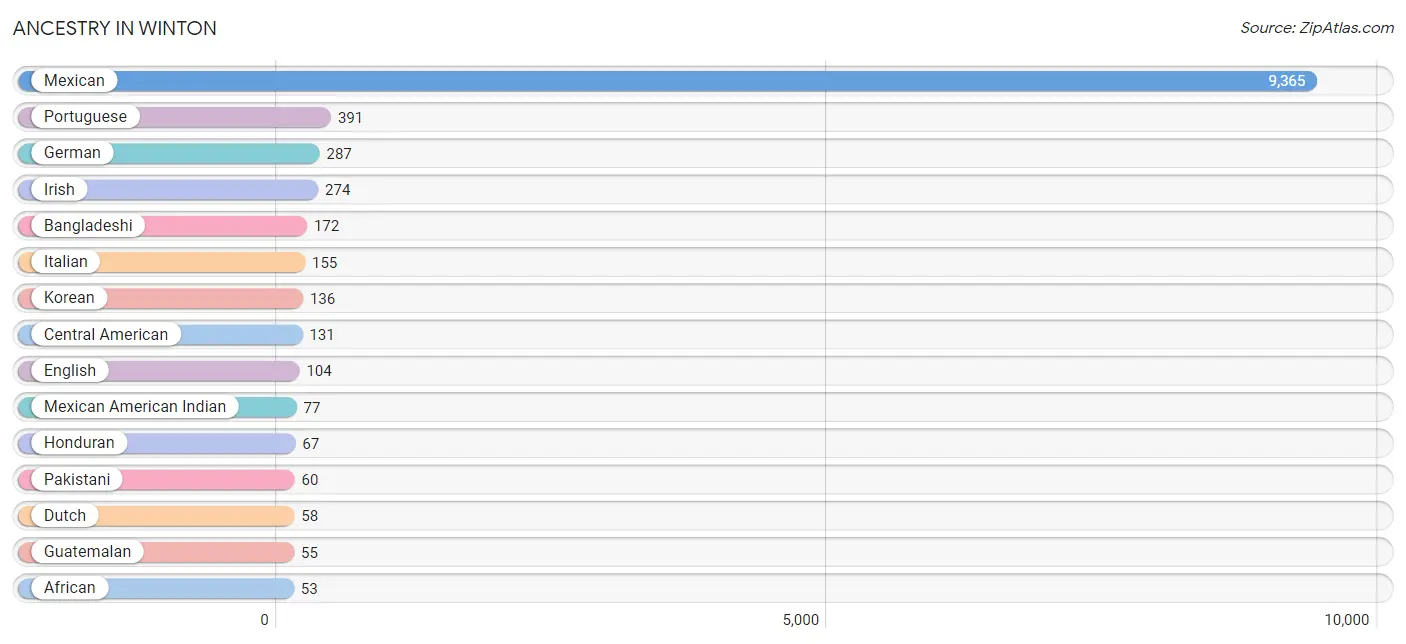
| Ancestry | # Population | % Population |
| African | 53 | 0.4% |
| American | 45 | 0.4% |
| Bangladeshi | 172 | 1.4% |
| British | 10 | 0.1% |
| Burmese | 39 | 0.3% |
| Central American | 131 | 1.1% |
| Cherokee | 7 | 0.1% |
| Danish | 29 | 0.2% |
| Dutch | 58 | 0.5% |
| English | 104 | 0.9% |
| European | 14 | 0.1% |
| Finnish | 6 | 0.1% |
| French | 42 | 0.4% |
| French Canadian | 15 | 0.1% |
| German | 287 | 2.4% |
| Guatemalan | 55 | 0.5% |
| Honduran | 67 | 0.6% |
| Hungarian | 11 | 0.1% |
| Irish | 274 | 2.3% |
| Italian | 155 | 1.3% |
| Korean | 136 | 1.1% |
| Mexican | 9,365 | 78.1% |
| Mexican American Indian | 77 | 0.6% |
| Norwegian | 22 | 0.2% |
| Pakistani | 60 | 0.5% |
| Panamanian | 9 | 0.1% |
| Portuguese | 391 | 3.3% |
| Scottish | 24 | 0.2% |
| Subsaharan African | 53 | 0.4% | View All 29 Rows |
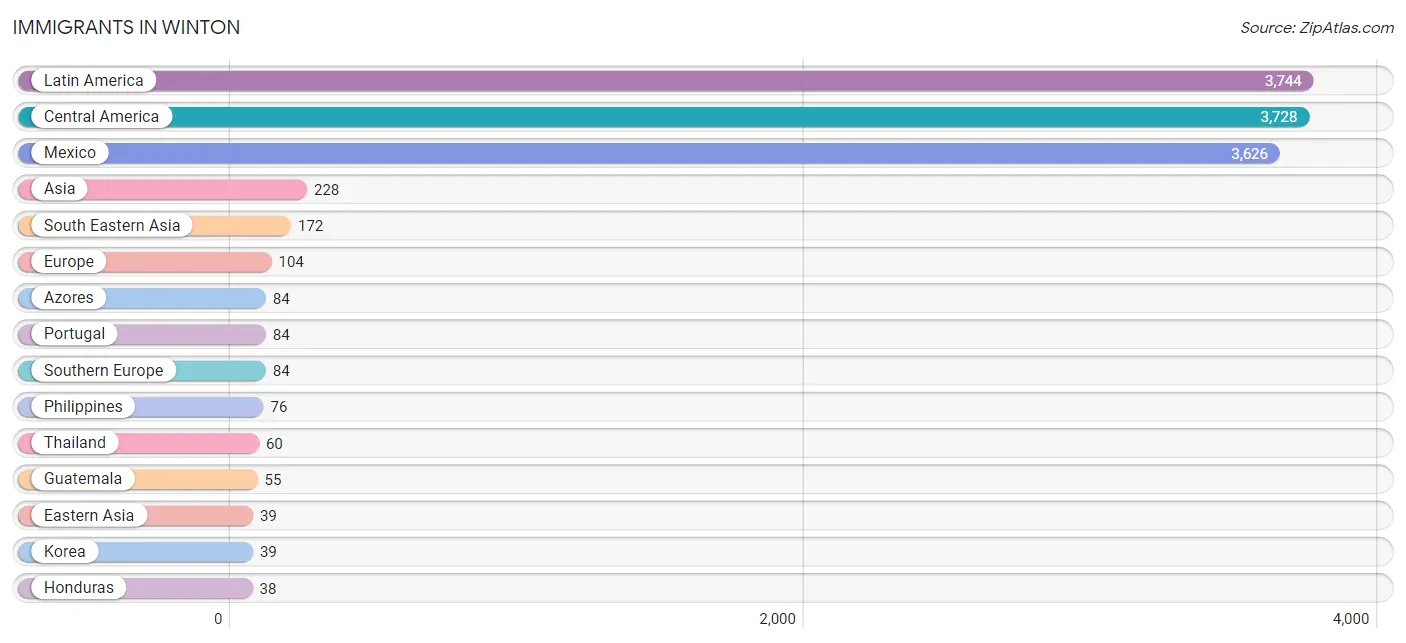
Immigrants in Winton
The most numerous immigrant groups reported in Winton came from Latin America (3,744 | 31.2%), Central America (3,728 | 31.1%), Mexico (3,626 | 30.2%), Asia (228 | 1.9%), and South Eastern Asia (172 | 1.4%), together accounting for 95.9% of all Winton residents.
| Immigration Origin | # Population | % Population |
| Asia | 228 | 1.9% |
| Azores | 84 | 0.7% |
| Central America | 3,728 | 31.1% |
| Eastern Asia | 39 | 0.3% |
| Eastern Europe | 10 | 0.1% |
| England | 10 | 0.1% |
| Europe | 104 | 0.9% |
| Guatemala | 55 | 0.5% |
| Honduras | 38 | 0.3% |
| Hungary | 10 | 0.1% |
| India | 17 | 0.1% |
| Korea | 39 | 0.3% |
| Laos | 36 | 0.3% |
| Latin America | 3,744 | 31.2% |
| Mexico | 3,626 | 30.2% |
| Northern Europe | 10 | 0.1% |
| Panama | 9 | 0.1% |
| Peru | 16 | 0.1% |
| Philippines | 76 | 0.6% |
| Portugal | 84 | 0.7% |
| South America | 16 | 0.1% |
| South Central Asia | 17 | 0.1% |
| South Eastern Asia | 172 | 1.4% |
| Southern Europe | 84 | 0.7% |
| Thailand | 60 | 0.5% | View All 25 Rows |
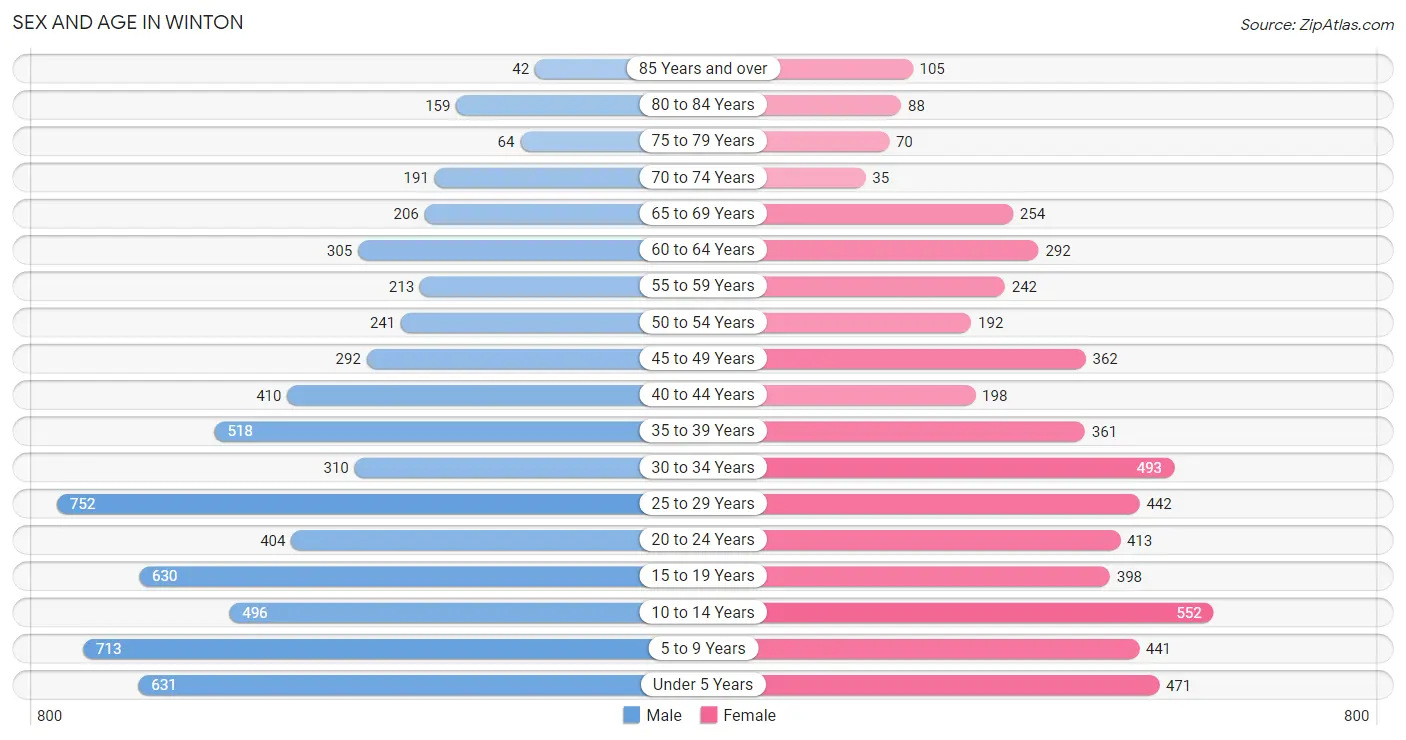
Sex and Age in Winton
Sex and Age in Winton
The most populous age groups in Winton are 25 to 29 Years (752 | 11.4%) for men and 10 to 14 Years (552 | 10.2%) for women.
| Age Bracket | Male | Female |
| Under 5 Years | 631 (9.6%) | 471 (8.7%) |
| 5 to 9 Years | 713 (10.8%) | 441 (8.2%) |
| 10 to 14 Years | 496 (7.5%) | 552 (10.2%) |
| 15 to 19 Years | 630 (9.6%) | 398 (7.4%) |
| 20 to 24 Years | 404 (6.1%) | 413 (7.6%) |
| 25 to 29 Years | 752 (11.4%) | 442 (8.2%) |
| 30 to 34 Years | 310 (4.7%) | 493 (9.1%) |
| 35 to 39 Years | 518 (7.9%) | 361 (6.7%) |
| 40 to 44 Years | 410 (6.2%) | 198 (3.7%) |
| 45 to 49 Years | 292 (4.4%) | 362 (6.7%) |
| 50 to 54 Years | 241 (3.7%) | 192 (3.5%) |
| 55 to 59 Years | 213 (3.2%) | 242 (4.5%) |
| 60 to 64 Years | 305 (4.6%) | 292 (5.4%) |
| 65 to 69 Years | 206 (3.1%) | 254 (4.7%) |
| 70 to 74 Years | 191 (2.9%) | 35 (0.6%) |
| 75 to 79 Years | 64 (1.0%) | 70 (1.3%) |
| 80 to 84 Years | 159 (2.4%) | 88 (1.6%) |
| 85 Years and over | 42 (0.6%) | 105 (1.9%) |
| Total | 6,577 (100.0%) | 5,409 (100.0%) |
Families and Households in Winton
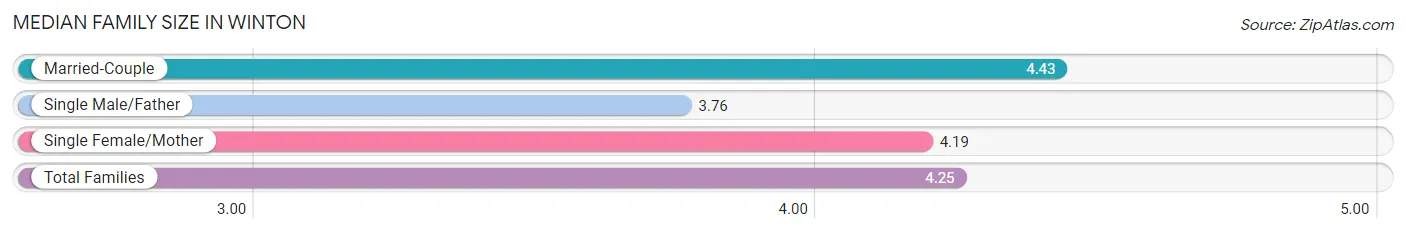
Median Family Size in Winton
The median family size in Winton is 4.25 persons per family, with married-couple families (1,513 | 61.5%) accounting for the largest median family size of 4.43 persons per family. On the other hand, single male/father families (520 | 21.1%) represent the smallest median family size with 3.76 persons per family.
| Family Type | # Families | Family Size |
| Married-Couple | 1,513 (61.5%) | 4.43 |
| Single Male/Father | 520 (21.1%) | 3.76 |
| Single Female/Mother | 427 (17.4%) | 4.19 |
| Total Families | 2,460 (100.0%) | 4.25 |
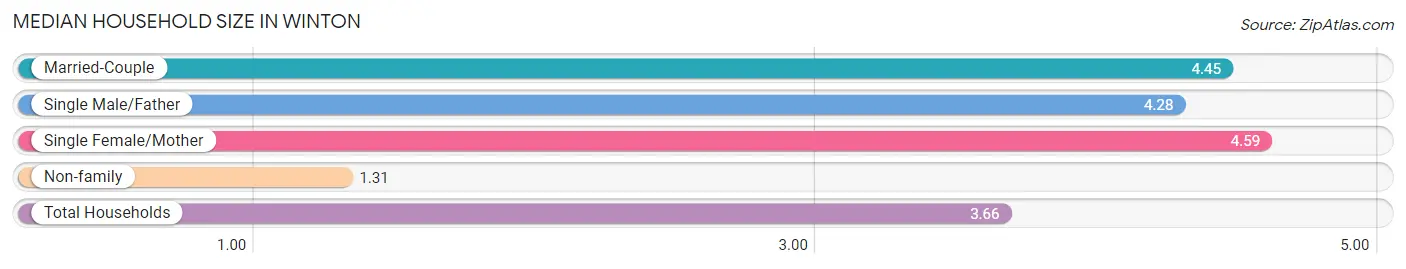
Median Household Size in Winton
The median household size in Winton is 3.66 persons per household, with single female/mother households (427 | 13.1%) accounting for the largest median household size of 4.59 persons per household. non-family households (811 | 24.8%) represent the smallest median household size with 1.31 persons per household.
| Household Type | # Households | Household Size |
| Married-Couple | 1,513 (46.3%) | 4.45 |
| Single Male/Father | 520 (15.9%) | 4.28 |
| Single Female/Mother | 427 (13.1%) | 4.59 |
| Non-family | 811 (24.8%) | 1.31 |
| Total Households | 3,271 (100.0%) | 3.66 |
Household Size by Marriage Status in Winton
Out of a total of 3,271 households in Winton, 2,460 (75.2%) are family households, while 811 (24.8%) are nonfamily households. The most numerous type of family households are 4-person households, comprising 558, and the most common type of nonfamily households are 1-person households, comprising 651.
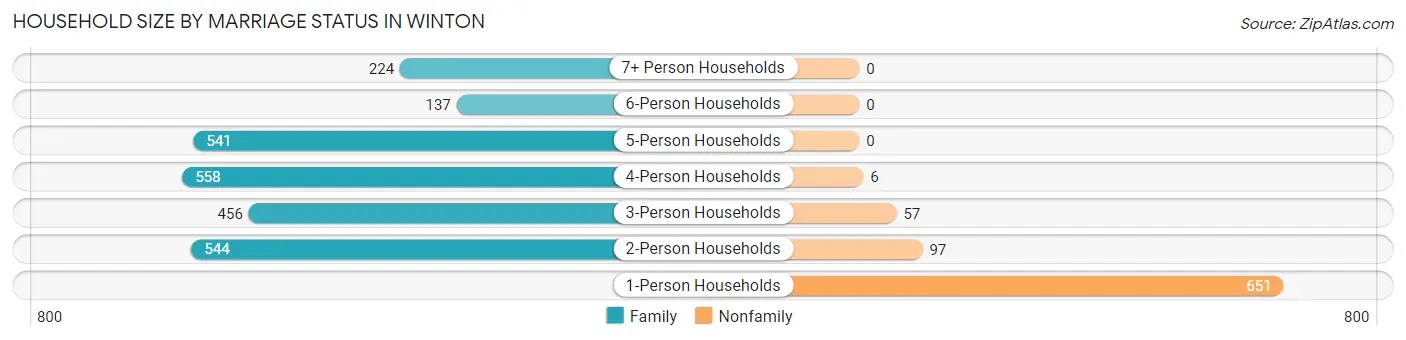
| Household Size | Family Households | Nonfamily Households |
| 1-Person Households | - | 651 (19.9%) |
| 2-Person Households | 544 (16.6%) | 97 (3.0%) |
| 3-Person Households | 456 (13.9%) | 57 (1.7%) |
| 4-Person Households | 558 (17.1%) | 6 (0.2%) |
| 5-Person Households | 541 (16.5%) | 0 (0.0%) |
| 6-Person Households | 137 (4.2%) | 0 (0.0%) |
| 7+ Person Households | 224 (6.9%) | 0 (0.0%) |
| Total | 2,460 (75.2%) | 811 (24.8%) |
Female Fertility in Winton
Fertility by Age in Winton
Average fertility rate in Winton is 89.0 births per 1,000 women. Women in the age bracket of 20 to 34 years have the highest fertility rate with 131.0 births per 1,000 women. Women in the age bracket of 20 to 34 years acount for 69.6% of all women with births.
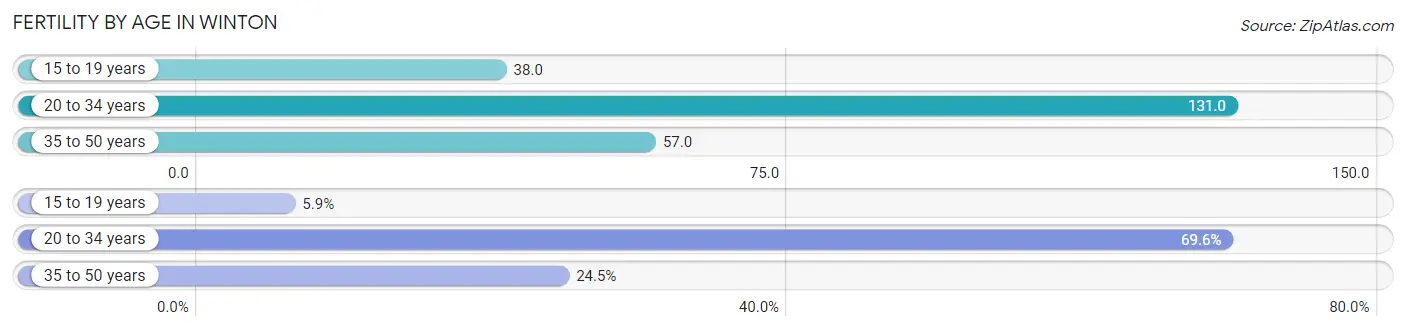
| Age Bracket | Women with Births | Births / 1,000 Women |
| 15 to 19 years | 15 (5.9%) | 38.0 |
| 20 to 34 years | 176 (69.6%) | 131.0 |
| 35 to 50 years | 62 (24.5%) | 57.0 |
| Total | 253 (100.0%) | 89.0 |
Fertility by Age by Marriage Status in Winton
45.8% of women with births (253) in Winton are married. The highest percentage of unmarried women with births falls into 15 to 19 years age bracket with 100.0% of them unmarried at the time of birth, while the lowest percentage of unmarried women with births belong to 35 to 50 years age bracket with 0.0% of them unmarried.
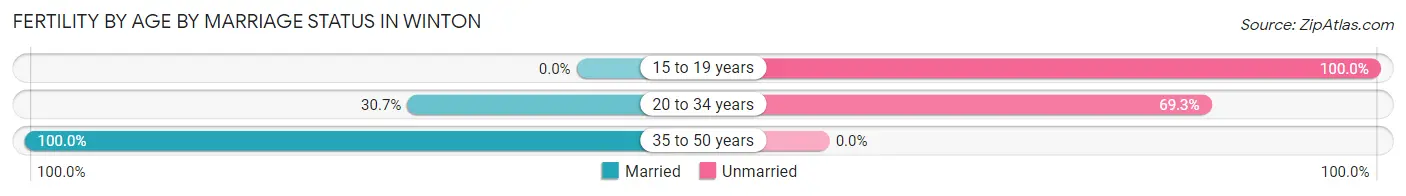
| Age Bracket | Married | Unmarried |
| 15 to 19 years | 0 (0.0%) | 15 (100.0%) |
| 20 to 34 years | 54 (30.7%) | 122 (69.3%) |
| 35 to 50 years | 62 (100.0%) | 0 (0.0%) |
| Total | 116 (45.9%) | 137 (54.1%) |
Fertility by Education in Winton
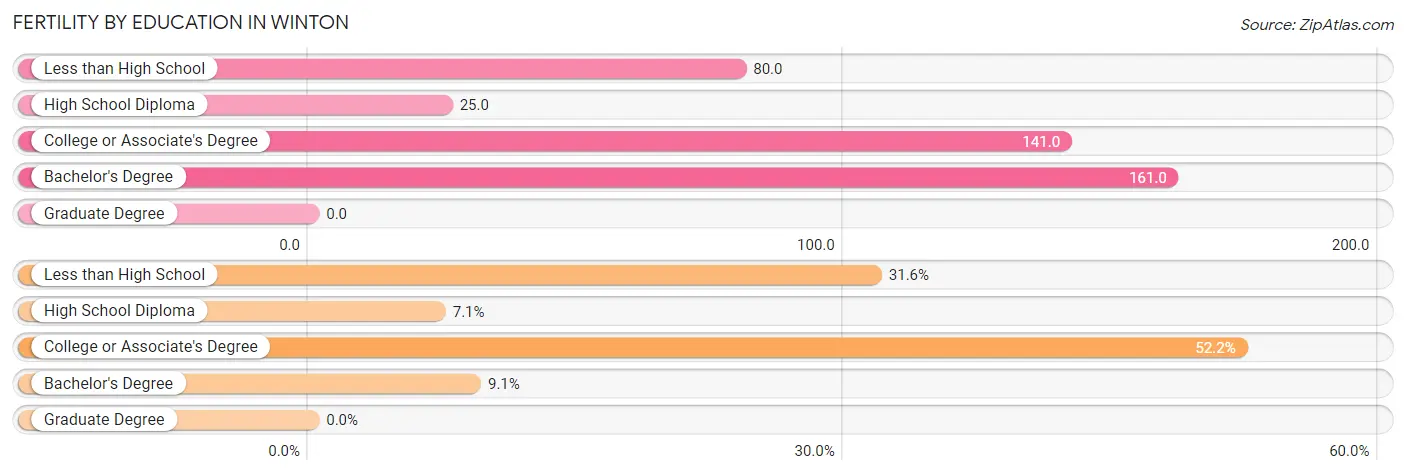
| Educational Attainment | Women with Births | Births / 1,000 Women |
| Less than High School | 80 (31.6%) | 80.0 |
| High School Diploma | 18 (7.1%) | 25.0 |
| College or Associate's Degree | 132 (52.2%) | 141.0 |
| Bachelor's Degree | 23 (9.1%) | 161.0 |
| Graduate Degree | 0 (0.0%) | 0.0 |
| Total | 253 (100.0%) | 89.0 |
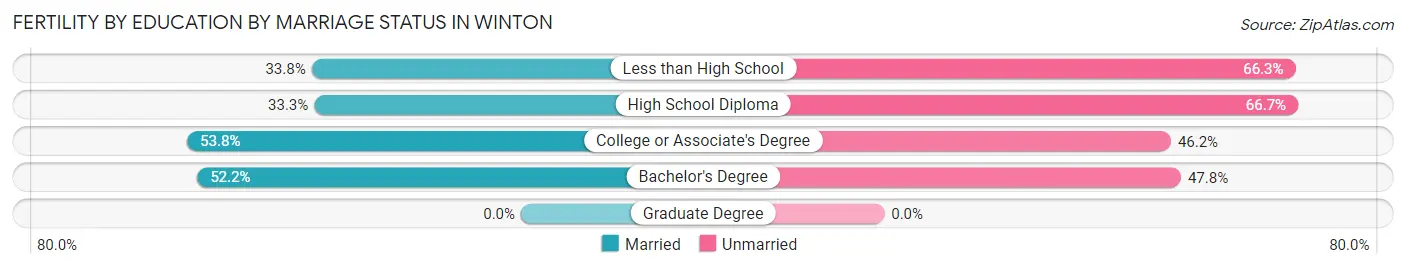
Fertility by Education by Marriage Status in Winton
54.1% of women with births in Winton are unmarried. Women with the educational attainment of college or associate's degree are most likely to be married with 53.8% of them married at childbirth, while women with the educational attainment of high school diploma are least likely to be married with 66.7% of them unmarried at childbirth.
| Educational Attainment | Married | Unmarried |
| Less than High School | 27 (33.8%) | 53 (66.2%) |
| High School Diploma | 6 (33.3%) | 12 (66.7%) |
| College or Associate's Degree | 71 (53.8%) | 61 (46.2%) |
| Bachelor's Degree | 12 (52.2%) | 11 (47.8%) |
| Graduate Degree | 0 (0.0%) | 0 (0.0%) |
| Total | 116 (45.9%) | 137 (54.1%) |
Employment Characteristics in Winton
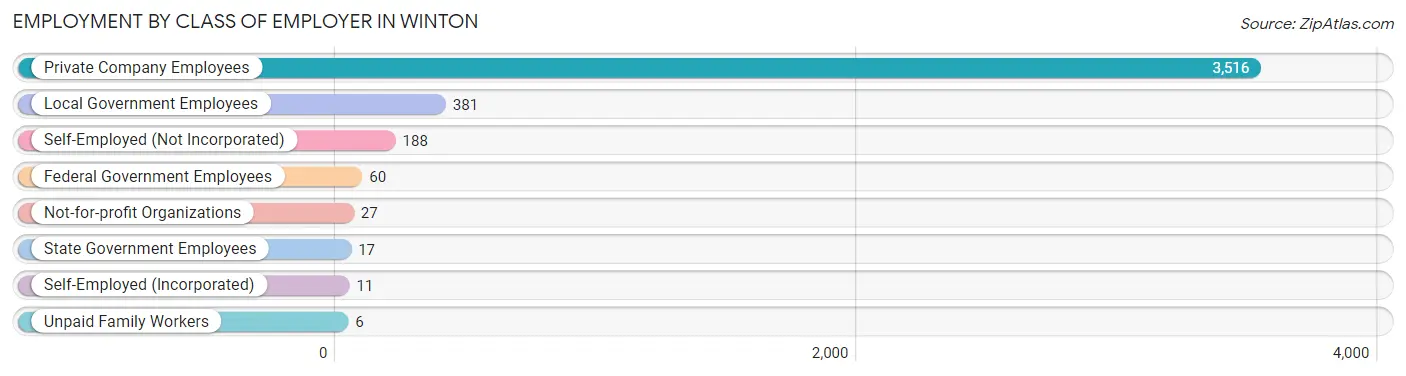
Employment by Class of Employer in Winton
Among the 4,206 employed individuals in Winton, private company employees (3,516 | 83.6%), local government employees (381 | 9.1%), and self-employed (not incorporated) (188 | 4.5%) make up the most common classes of employment.
| Employer Class | # Employees | % Employees |
| Private Company Employees | 3,516 | 83.6% |
| Self-Employed (Incorporated) | 11 | 0.3% |
| Self-Employed (Not Incorporated) | 188 | 4.5% |
| Not-for-profit Organizations | 27 | 0.6% |
| Local Government Employees | 381 | 9.1% |
| State Government Employees | 17 | 0.4% |
| Federal Government Employees | 60 | 1.4% |
| Unpaid Family Workers | 6 | 0.1% |
| Total | 4,206 | 100.0% |
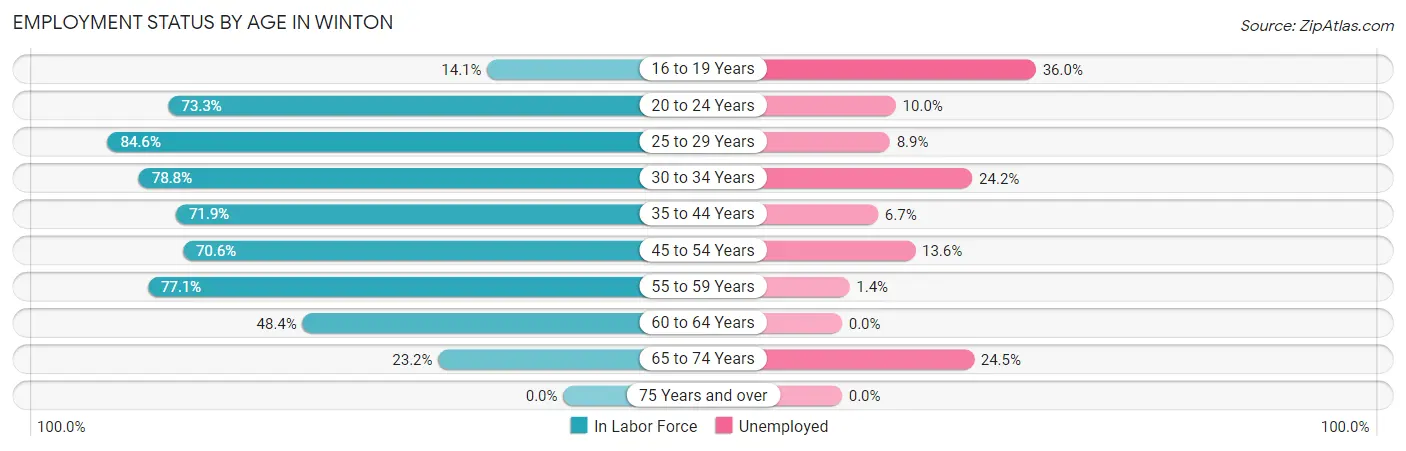
Employment Status by Age in Winton
According to the labor force statistics for Winton, out of the total population over 16 years of age (8,541), 58.6% or 5,005 individuals are in the labor force, with 11.3% or 566 of them unemployed. The age group with the highest labor force participation rate is 25 to 29 years, with 84.6% or 1,010 individuals in the labor force. Within the labor force, the 16 to 19 years age range has the highest percentage of unemployed individuals, with 36.0% or 45 of them being unemployed.
| Age Bracket | In Labor Force | Unemployed |
| 16 to 19 Years | 125 (14.1%) | 45 (36.0%) |
| 20 to 24 Years | 599 (73.3%) | 60 (10.0%) |
| 25 to 29 Years | 1,010 (84.6%) | 90 (8.9%) |
| 30 to 34 Years | 633 (78.8%) | 153 (24.2%) |
| 35 to 44 Years | 1,069 (71.9%) | 72 (6.7%) |
| 45 to 54 Years | 767 (70.6%) | 104 (13.6%) |
| 55 to 59 Years | 351 (77.1%) | 5 (1.4%) |
| 60 to 64 Years | 289 (48.4%) | 0 (0.0%) |
| 65 to 74 Years | 159 (23.2%) | 39 (24.5%) |
| 75 Years and over | 0 (0.0%) | 0 (0.0%) |
| Total | 5,005 (58.6%) | 566 (11.3%) |
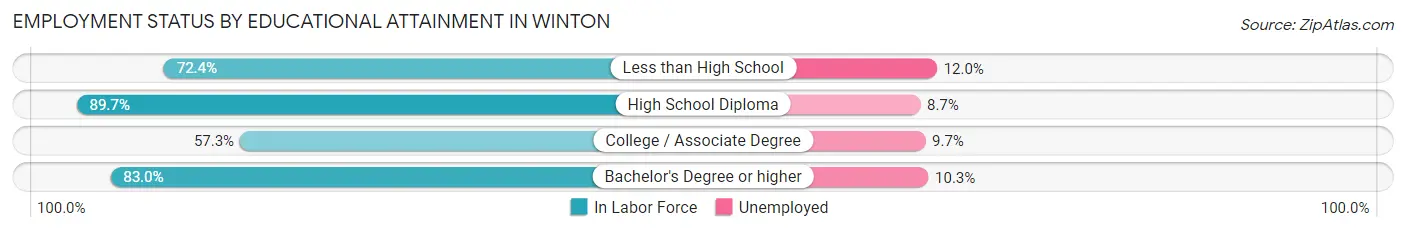
Employment Status by Educational Attainment in Winton
According to labor force statistics for Winton, 73.3% of individuals (4,122) out of the total population between 25 and 64 years of age (5,623) are in the labor force, with 10.2% or 420 of them being unemployed. The group with the highest labor force participation rate are those with the educational attainment of high school diploma, with 89.7% or 1,409 individuals in the labor force. Within the labor force, individuals with less than high school education have the highest percentage of unemployment, with 12.0% or 183 of them being unemployed.
| Educational Attainment | In Labor Force | Unemployed |
| Less than High School | 1,528 (72.4%) | 253 (12.0%) |
| High School Diploma | 1,409 (89.7%) | 137 (8.7%) |
| College / Associate Degree | 958 (57.3%) | 162 (9.7%) |
| Bachelor's Degree or higher | 224 (83.0%) | 28 (10.3%) |
| Total | 4,122 (73.3%) | 574 (10.2%) |
Employment Occupations by Sex in Winton
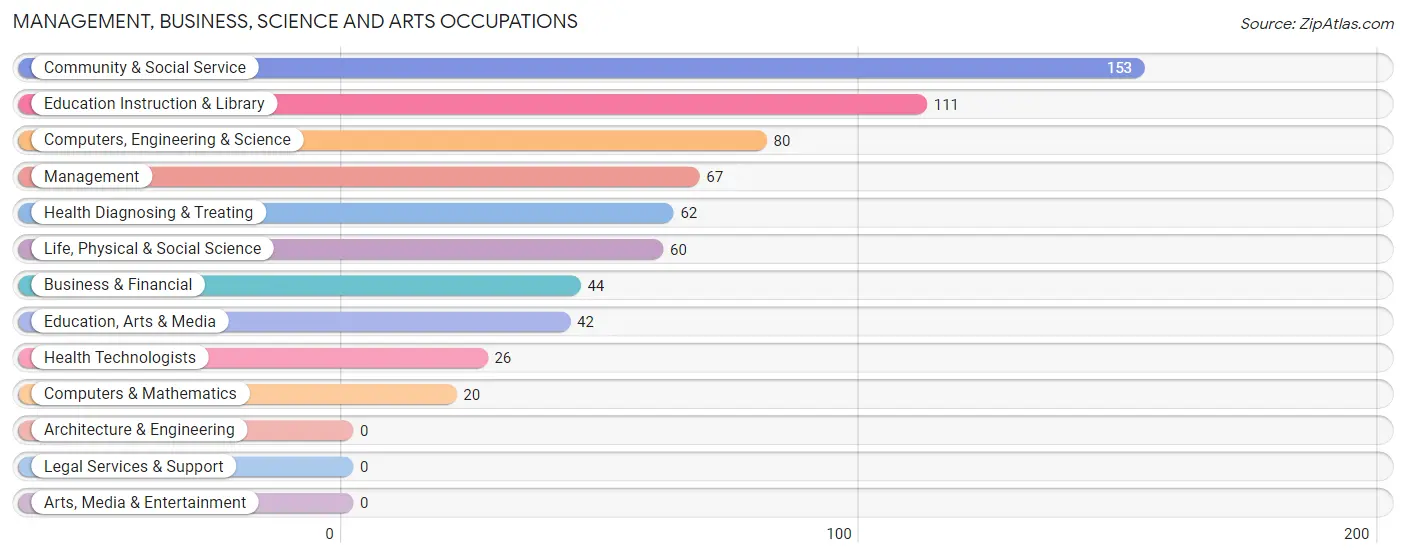
Management, Business, Science and Arts Occupations
The most common Management, Business, Science and Arts occupations in Winton are Community & Social Service (153 | 3.5%), Education Instruction & Library (111 | 2.5%), Computers, Engineering & Science (80 | 1.8%), Management (67 | 1.5%), and Health Diagnosing & Treating (62 | 1.4%).
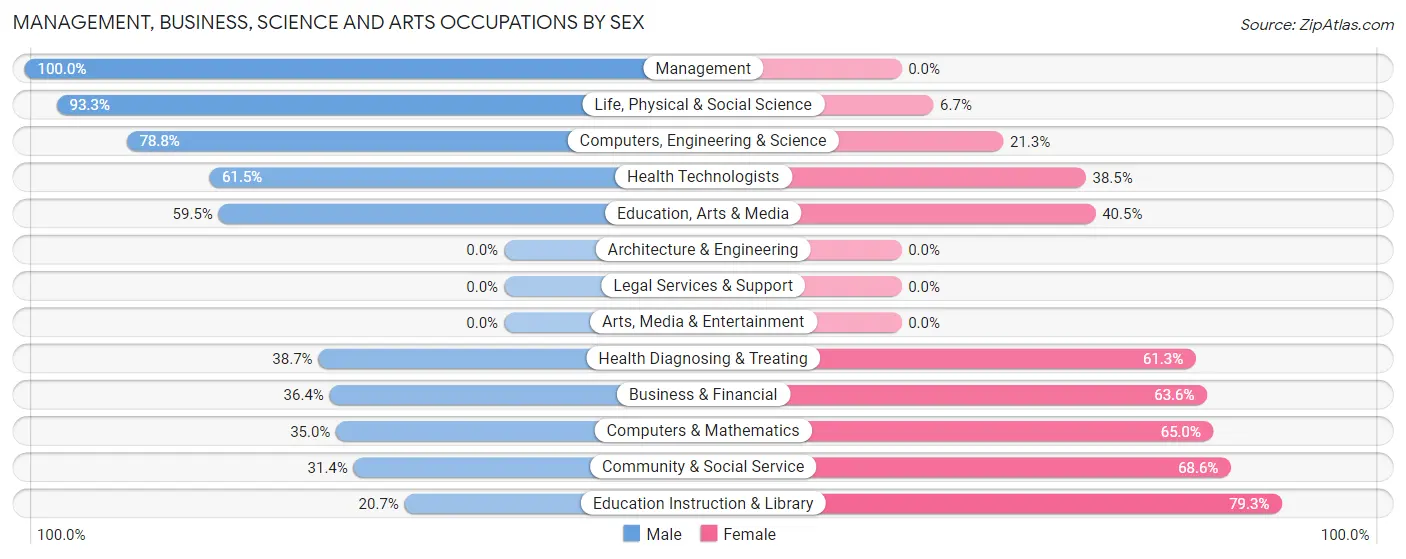
Management, Business, Science and Arts Occupations by Sex
Within the Management, Business, Science and Arts occupations in Winton, the most male-oriented occupations are Management (100.0%), Life, Physical & Social Science (93.3%), and Computers, Engineering & Science (78.7%), while the most female-oriented occupations are Education Instruction & Library (79.3%), Community & Social Service (68.6%), and Computers & Mathematics (65.0%).
| Occupation | Male | Female |
| Management | 67 (100.0%) | 0 (0.0%) |
| Business & Financial | 16 (36.4%) | 28 (63.6%) |
| Computers, Engineering & Science | 63 (78.7%) | 17 (21.2%) |
| Computers & Mathematics | 7 (35.0%) | 13 (65.0%) |
| Architecture & Engineering | 0 (0.0%) | 0 (0.0%) |
| Life, Physical & Social Science | 56 (93.3%) | 4 (6.7%) |
| Community & Social Service | 48 (31.4%) | 105 (68.6%) |
| Education, Arts & Media | 25 (59.5%) | 17 (40.5%) |
| Legal Services & Support | 0 (0.0%) | 0 (0.0%) |
| Education Instruction & Library | 23 (20.7%) | 88 (79.3%) |
| Arts, Media & Entertainment | 0 (0.0%) | 0 (0.0%) |
| Health Diagnosing & Treating | 24 (38.7%) | 38 (61.3%) |
| Health Technologists | 16 (61.5%) | 10 (38.5%) |
| Total (Category) | 218 (53.7%) | 188 (46.3%) |
| Total (Overall) | 2,809 (63.5%) | 1,612 (36.5%) |
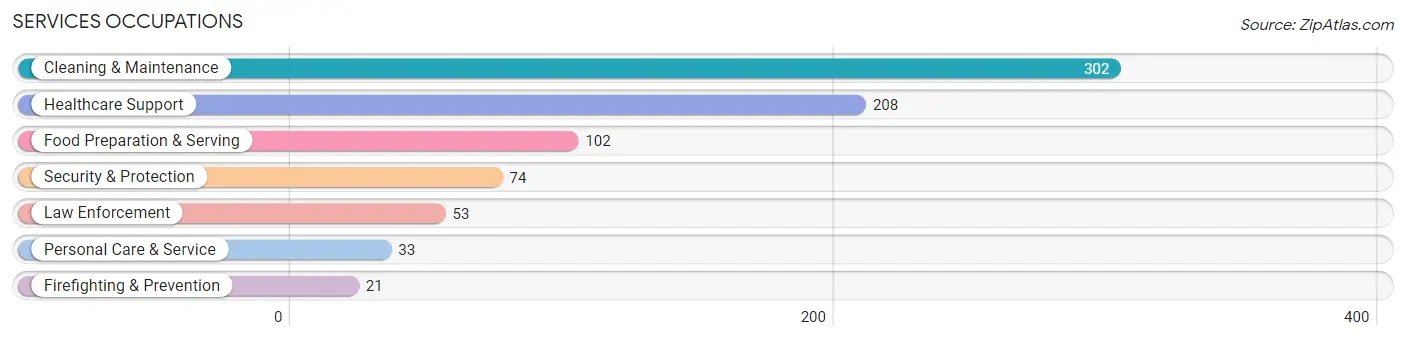
Services Occupations
The most common Services occupations in Winton are Cleaning & Maintenance (302 | 6.8%), Healthcare Support (208 | 4.7%), Food Preparation & Serving (102 | 2.3%), Security & Protection (74 | 1.7%), and Law Enforcement (53 | 1.2%).
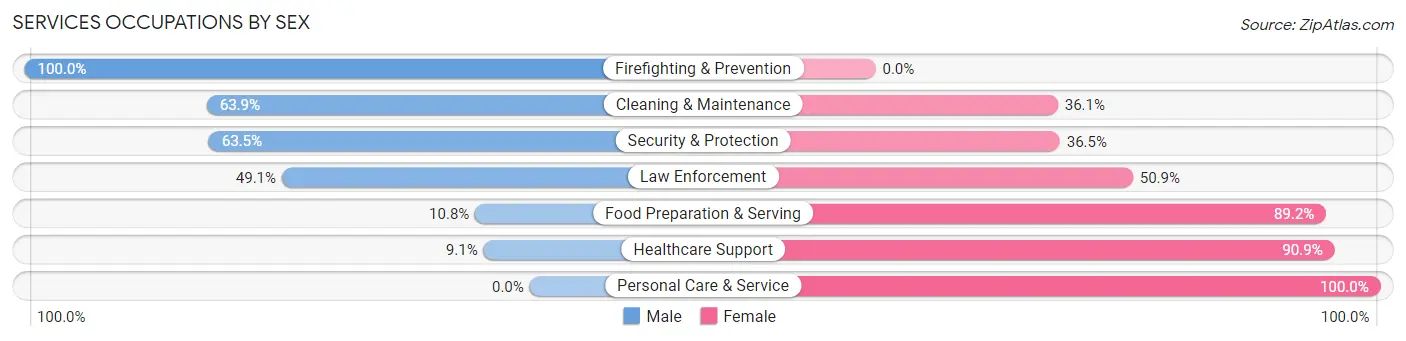
Services Occupations by Sex
Within the Services occupations in Winton, the most male-oriented occupations are Firefighting & Prevention (100.0%), Cleaning & Maintenance (63.9%), and Security & Protection (63.5%), while the most female-oriented occupations are Personal Care & Service (100.0%), Healthcare Support (90.9%), and Food Preparation & Serving (89.2%).
| Occupation | Male | Female |
| Healthcare Support | 19 (9.1%) | 189 (90.9%) |
| Security & Protection | 47 (63.5%) | 27 (36.5%) |
| Firefighting & Prevention | 21 (100.0%) | 0 (0.0%) |
| Law Enforcement | 26 (49.1%) | 27 (50.9%) |
| Food Preparation & Serving | 11 (10.8%) | 91 (89.2%) |
| Cleaning & Maintenance | 193 (63.9%) | 109 (36.1%) |
| Personal Care & Service | 0 (0.0%) | 33 (100.0%) |
| Total (Category) | 270 (37.6%) | 449 (62.5%) |
| Total (Overall) | 2,809 (63.5%) | 1,612 (36.5%) |
Sales and Office Occupations
The most common Sales and Office occupations in Winton are Sales & Related (332 | 7.5%), and Office & Administration (300 | 6.8%).
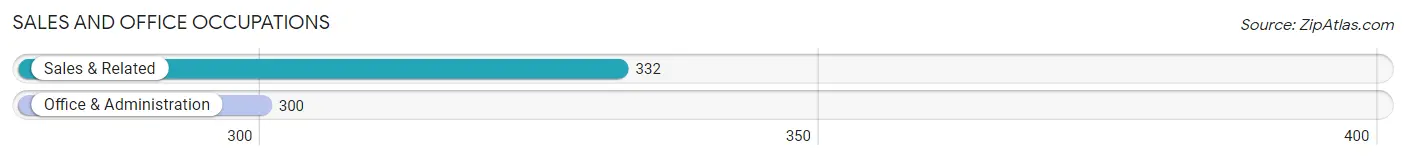
Sales and Office Occupations by Sex
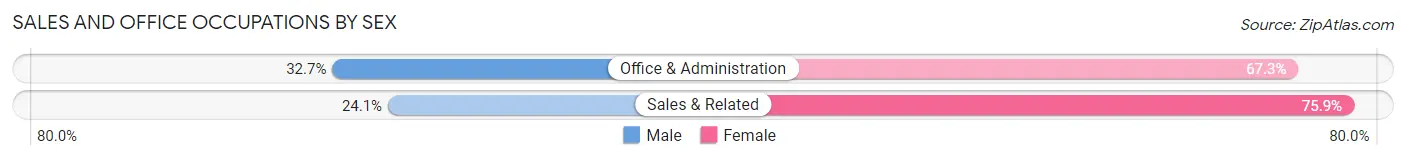
| Occupation | Male | Female |
| Sales & Related | 80 (24.1%) | 252 (75.9%) |
| Office & Administration | 98 (32.7%) | 202 (67.3%) |
| Total (Category) | 178 (28.2%) | 454 (71.8%) |
| Total (Overall) | 2,809 (63.5%) | 1,612 (36.5%) |
Natural Resources, Construction and Maintenance Occupations
The most common Natural Resources, Construction and Maintenance occupations in Winton are Farming, Fishing & Forestry (818 | 18.5%), Construction & Extraction (354 | 8.0%), and Installation, Maintenance & Repair (230 | 5.2%).
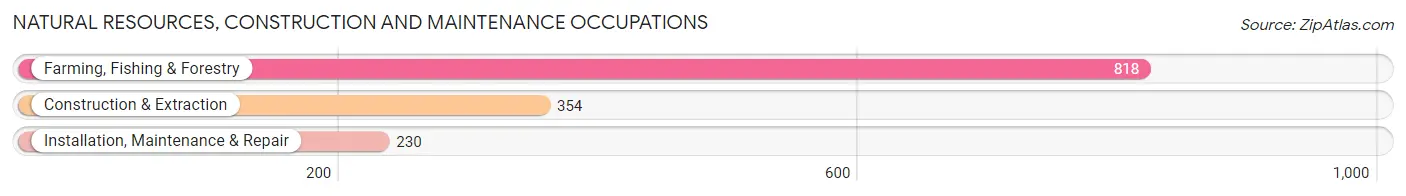
Natural Resources, Construction and Maintenance Occupations by Sex
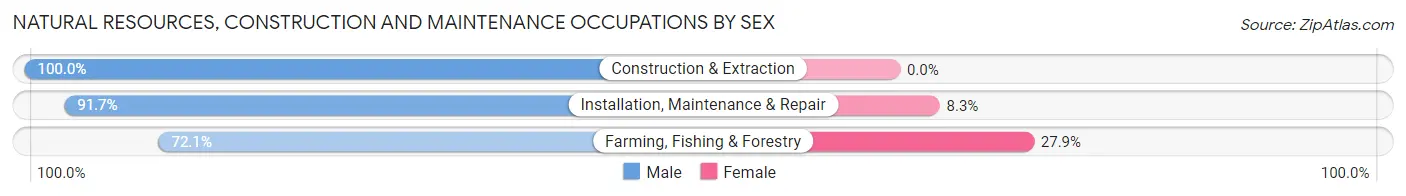
| Occupation | Male | Female |
| Farming, Fishing & Forestry | 590 (72.1%) | 228 (27.9%) |
| Construction & Extraction | 354 (100.0%) | 0 (0.0%) |
| Installation, Maintenance & Repair | 211 (91.7%) | 19 (8.3%) |
| Total (Category) | 1,155 (82.4%) | 247 (17.6%) |
| Total (Overall) | 2,809 (63.5%) | 1,612 (36.5%) |
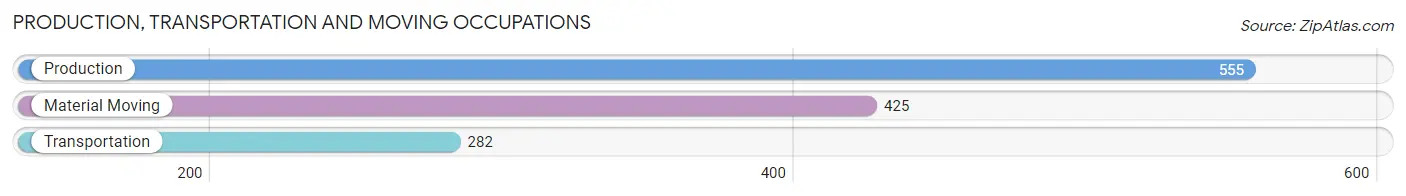
Production, Transportation and Moving Occupations
The most common Production, Transportation and Moving occupations in Winton are Production (555 | 12.6%), Material Moving (425 | 9.6%), and Transportation (282 | 6.4%).
Production, Transportation and Moving Occupations by Sex
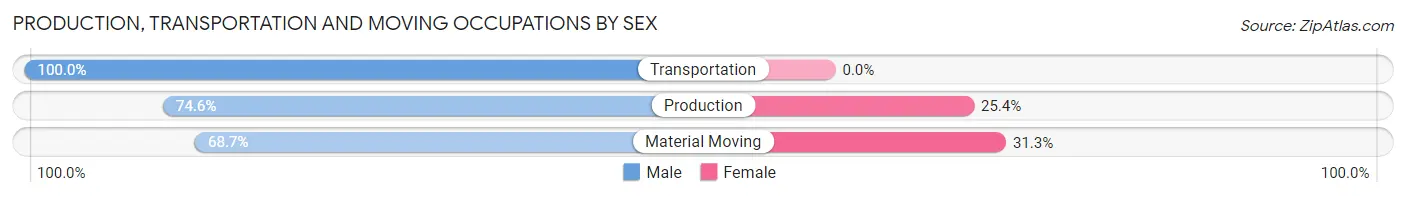
| Occupation | Male | Female |
| Production | 414 (74.6%) | 141 (25.4%) |
| Transportation | 282 (100.0%) | 0 (0.0%) |
| Material Moving | 292 (68.7%) | 133 (31.3%) |
| Total (Category) | 988 (78.3%) | 274 (21.7%) |
| Total (Overall) | 2,809 (63.5%) | 1,612 (36.5%) |
Employment Industries by Sex in Winton
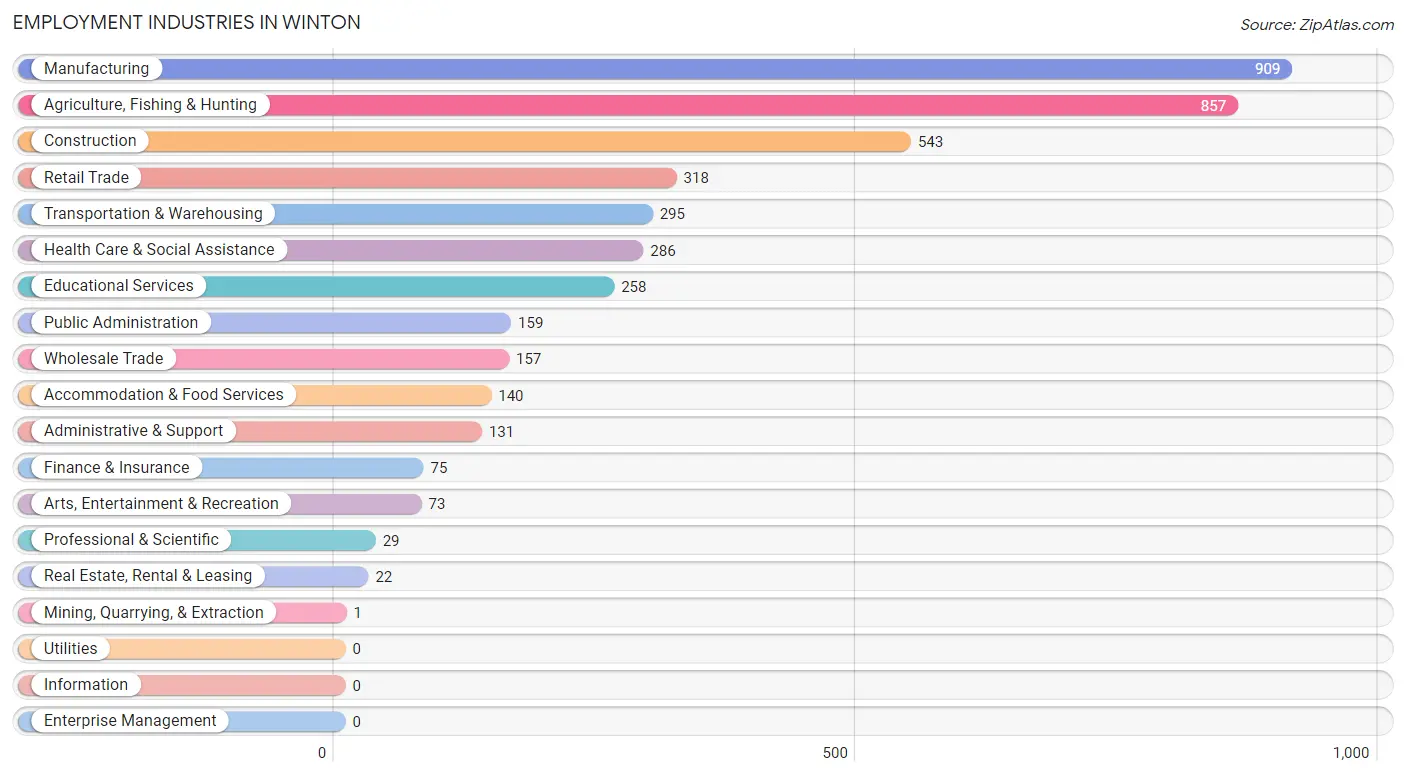
Employment Industries in Winton
The major employment industries in Winton include Manufacturing (909 | 20.6%), Agriculture, Fishing & Hunting (857 | 19.4%), Construction (543 | 12.3%), Retail Trade (318 | 7.2%), and Transportation & Warehousing (295 | 6.7%).
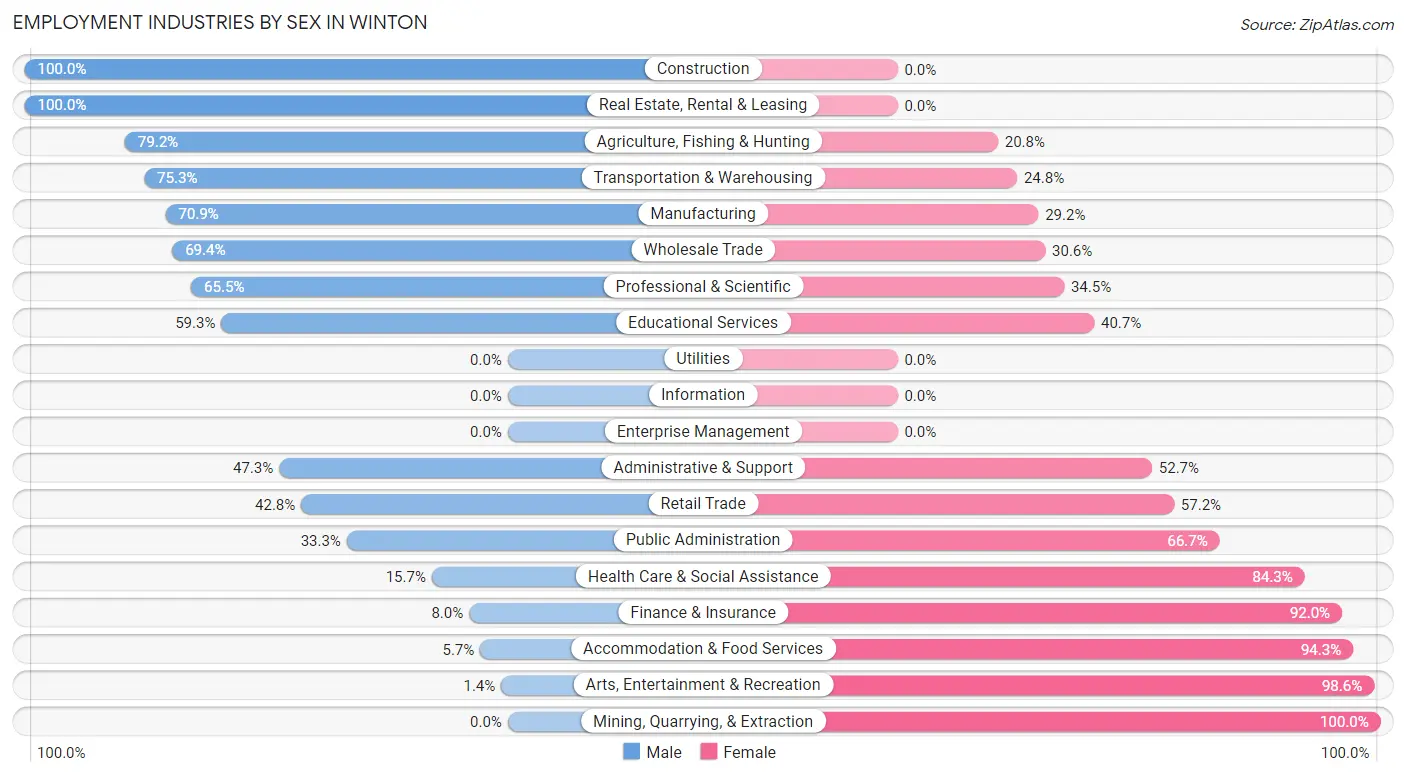
Employment Industries by Sex in Winton
The Winton industries that see more men than women are Construction (100.0%), Real Estate, Rental & Leasing (100.0%), and Agriculture, Fishing & Hunting (79.2%), whereas the industries that tend to have a higher number of women are Mining, Quarrying, & Extraction (100.0%), Arts, Entertainment & Recreation (98.6%), and Accommodation & Food Services (94.3%).
| Industry | Male | Female |
| Agriculture, Fishing & Hunting | 679 (79.2%) | 178 (20.8%) |
| Mining, Quarrying, & Extraction | 0 (0.0%) | 1 (100.0%) |
| Construction | 543 (100.0%) | 0 (0.0%) |
| Manufacturing | 644 (70.9%) | 265 (29.1%) |
| Wholesale Trade | 109 (69.4%) | 48 (30.6%) |
| Retail Trade | 136 (42.8%) | 182 (57.2%) |
| Transportation & Warehousing | 222 (75.2%) | 73 (24.7%) |
| Utilities | 0 (0.0%) | 0 (0.0%) |
| Information | 0 (0.0%) | 0 (0.0%) |
| Finance & Insurance | 6 (8.0%) | 69 (92.0%) |
| Real Estate, Rental & Leasing | 22 (100.0%) | 0 (0.0%) |
| Professional & Scientific | 19 (65.5%) | 10 (34.5%) |
| Enterprise Management | 0 (0.0%) | 0 (0.0%) |
| Administrative & Support | 62 (47.3%) | 69 (52.7%) |
| Educational Services | 153 (59.3%) | 105 (40.7%) |
| Health Care & Social Assistance | 45 (15.7%) | 241 (84.3%) |
| Arts, Entertainment & Recreation | 1 (1.4%) | 72 (98.6%) |
| Accommodation & Food Services | 8 (5.7%) | 132 (94.3%) |
| Public Administration | 53 (33.3%) | 106 (66.7%) |
| Total | 2,809 (63.5%) | 1,612 (36.5%) |
Education in Winton
School Enrollment in Winton
The most common levels of schooling among the 3,776 students in Winton are middle school (876 | 23.2%), elementary school (826 | 21.9%), and high school (749 | 19.8%).
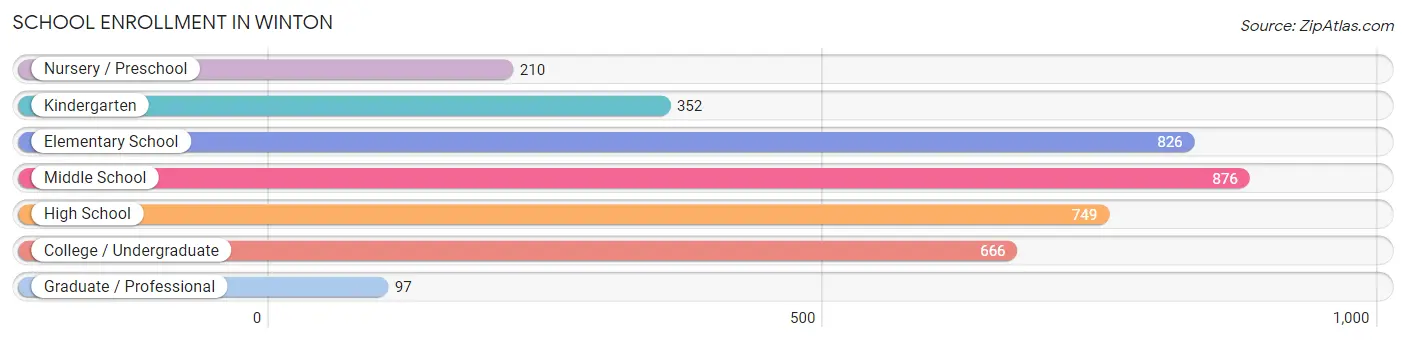
| School Level | # Students | % Students |
| Nursery / Preschool | 210 | 5.6% |
| Kindergarten | 352 | 9.3% |
| Elementary School | 826 | 21.9% |
| Middle School | 876 | 23.2% |
| High School | 749 | 19.8% |
| College / Undergraduate | 666 | 17.6% |
| Graduate / Professional | 97 | 2.6% |
| Total | 3,776 | 100.0% |
School Enrollment by Age by Funding Source in Winton
Out of a total of 3,776 students who are enrolled in schools in Winton, 106 (2.8%) attend a private institution, while the remaining 3,670 (97.2%) are enrolled in public schools. The age group of 20 to 24 year olds has the highest likelihood of being enrolled in private schools, with 22 (11.6% in the age bracket) enrolled. Conversely, the age group of 3 to 4 year olds has the lowest likelihood of being enrolled in a private school, with 191 (100.0% in the age bracket) attending a public institution.
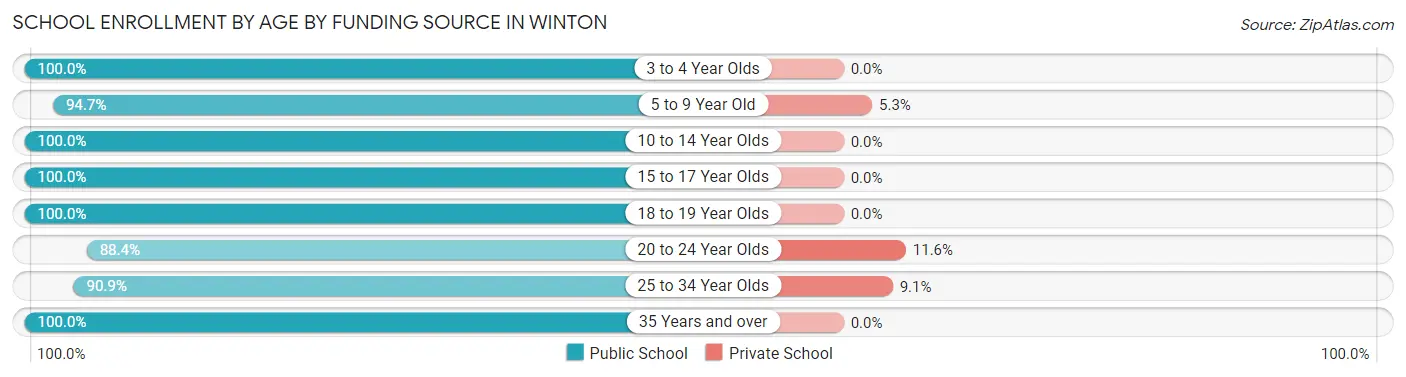
| Age Bracket | Public School | Private School |
| 3 to 4 Year Olds | 191 (100.0%) | 0 (0.0%) |
| 5 to 9 Year Old | 1,093 (94.7%) | 61 (5.3%) |
| 10 to 14 Year Olds | 1,048 (100.0%) | 0 (0.0%) |
| 15 to 17 Year Olds | 553 (100.0%) | 0 (0.0%) |
| 18 to 19 Year Olds | 369 (100.0%) | 0 (0.0%) |
| 20 to 24 Year Olds | 168 (88.4%) | 22 (11.6%) |
| 25 to 34 Year Olds | 229 (90.9%) | 23 (9.1%) |
| 35 Years and over | 19 (100.0%) | 0 (0.0%) |
| Total | 3,670 (97.2%) | 106 (2.8%) |
Educational Attainment by Field of Study in Winton
Liberal arts & history (70 | 23.0%), science & technology (53 | 17.4%), arts & humanities (50 | 16.4%), psychology (47 | 15.4%), and business (37 | 12.1%) are the most common fields of study among 305 individuals in Winton who have obtained a bachelor's degree or higher.
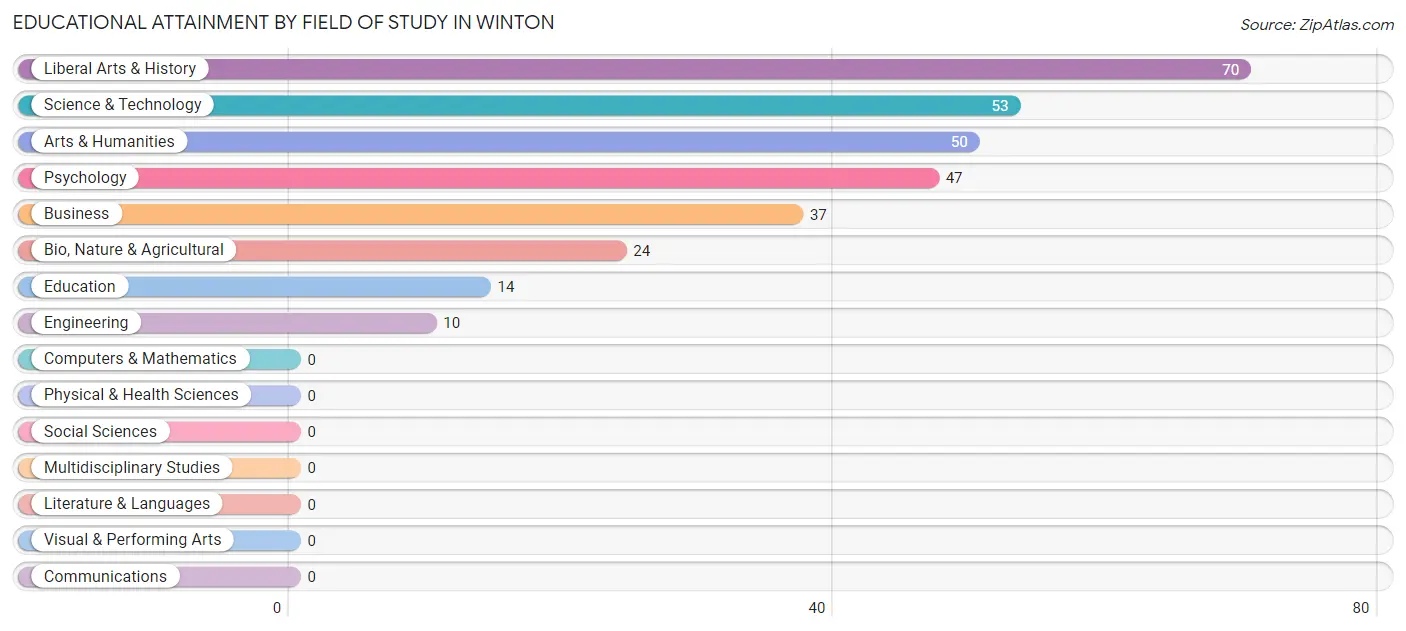
| Field of Study | # Graduates | % Graduates |
| Computers & Mathematics | 0 | 0.0% |
| Bio, Nature & Agricultural | 24 | 7.9% |
| Physical & Health Sciences | 0 | 0.0% |
| Psychology | 47 | 15.4% |
| Social Sciences | 0 | 0.0% |
| Engineering | 10 | 3.3% |
| Multidisciplinary Studies | 0 | 0.0% |
| Science & Technology | 53 | 17.4% |
| Business | 37 | 12.1% |
| Education | 14 | 4.6% |
| Literature & Languages | 0 | 0.0% |
| Liberal Arts & History | 70 | 23.0% |
| Visual & Performing Arts | 0 | 0.0% |
| Communications | 0 | 0.0% |
| Arts & Humanities | 50 | 16.4% |
| Total | 305 | 100.0% |
Transportation & Commute in Winton
Vehicle Availability by Sex in Winton
The most prevalent vehicle ownership categories in Winton are males with 2 vehicles (1,095, accounting for 40.3%) and females with 2 vehicles (605, making up 73.6%).
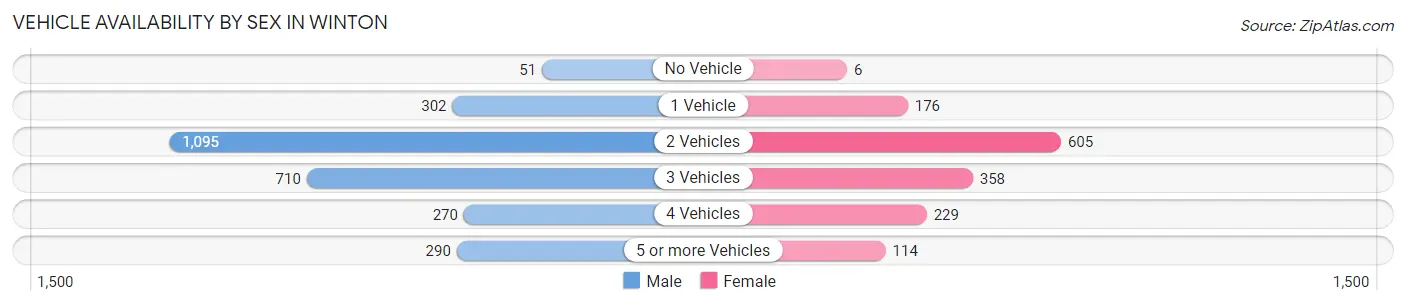
| Vehicles Available | Male | Female |
| No Vehicle | 51 (1.9%) | 6 (0.4%) |
| 1 Vehicle | 302 (11.1%) | 176 (11.8%) |
| 2 Vehicles | 1,095 (40.3%) | 605 (40.7%) |
| 3 Vehicles | 710 (26.1%) | 358 (24.1%) |
| 4 Vehicles | 270 (9.9%) | 229 (15.4%) |
| 5 or more Vehicles | 290 (10.7%) | 114 (7.7%) |
| Total | 2,718 (100.0%) | 1,488 (100.0%) |
Commute Time in Winton
The most frequently occuring commute durations in Winton are 15 to 19 minutes (761 commuters, 18.4%), 20 to 24 minutes (607 commuters, 14.7%), and 10 to 14 minutes (547 commuters, 13.2%).
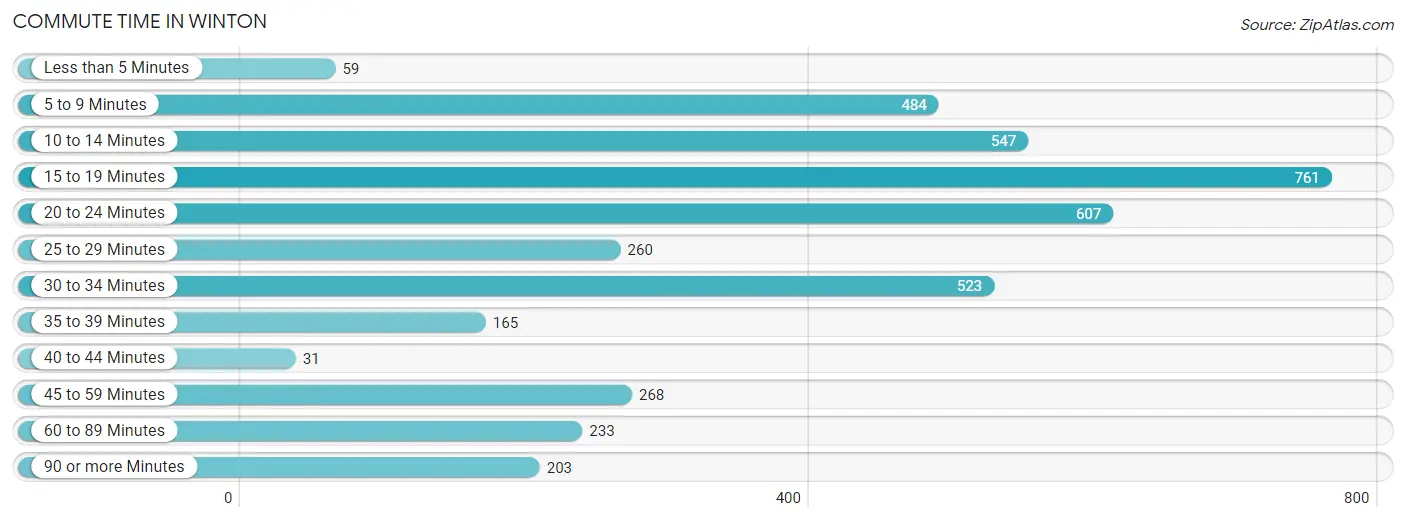
| Commute Time | # Commuters | % Commuters |
| Less than 5 Minutes | 59 | 1.4% |
| 5 to 9 Minutes | 484 | 11.7% |
| 10 to 14 Minutes | 547 | 13.2% |
| 15 to 19 Minutes | 761 | 18.4% |
| 20 to 24 Minutes | 607 | 14.7% |
| 25 to 29 Minutes | 260 | 6.3% |
| 30 to 34 Minutes | 523 | 12.6% |
| 35 to 39 Minutes | 165 | 4.0% |
| 40 to 44 Minutes | 31 | 0.7% |
| 45 to 59 Minutes | 268 | 6.5% |
| 60 to 89 Minutes | 233 | 5.6% |
| 90 or more Minutes | 203 | 4.9% |
Commute Time by Sex in Winton
The most common commute times in Winton are 15 to 19 minutes (456 commuters, 16.9%) for males and 15 to 19 minutes (305 commuters, 21.1%) for females.
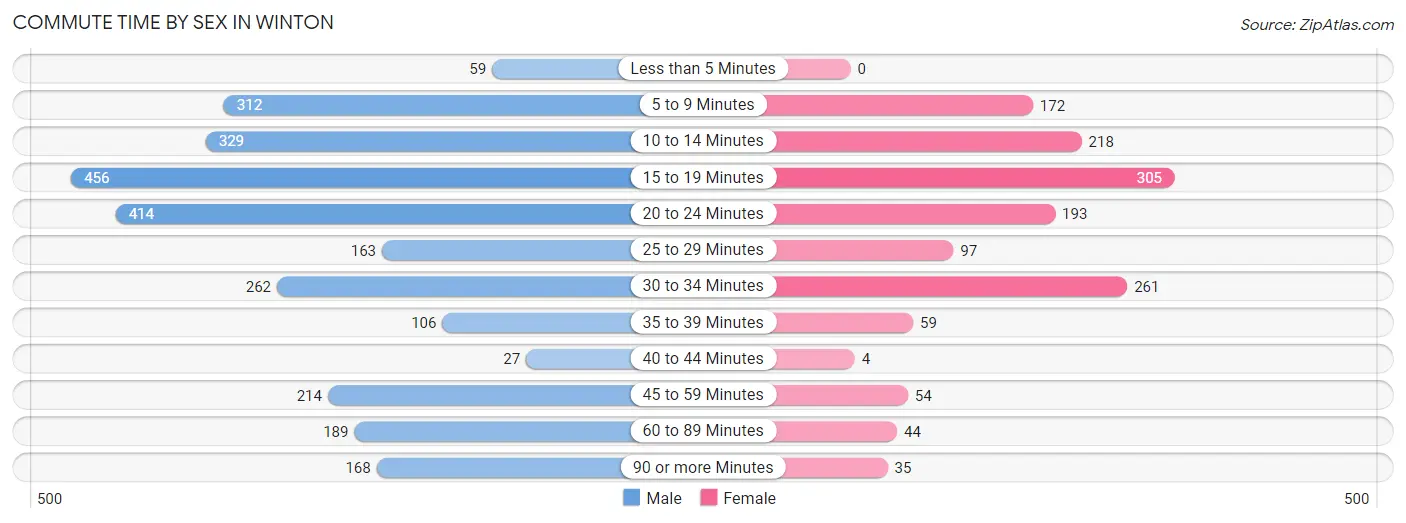
| Commute Time | Male | Female |
| Less than 5 Minutes | 59 (2.2%) | 0 (0.0%) |
| 5 to 9 Minutes | 312 (11.6%) | 172 (11.9%) |
| 10 to 14 Minutes | 329 (12.2%) | 218 (15.1%) |
| 15 to 19 Minutes | 456 (16.9%) | 305 (21.1%) |
| 20 to 24 Minutes | 414 (15.3%) | 193 (13.4%) |
| 25 to 29 Minutes | 163 (6.0%) | 97 (6.7%) |
| 30 to 34 Minutes | 262 (9.7%) | 261 (18.1%) |
| 35 to 39 Minutes | 106 (3.9%) | 59 (4.1%) |
| 40 to 44 Minutes | 27 (1.0%) | 4 (0.3%) |
| 45 to 59 Minutes | 214 (7.9%) | 54 (3.7%) |
| 60 to 89 Minutes | 189 (7.0%) | 44 (3.0%) |
| 90 or more Minutes | 168 (6.2%) | 35 (2.4%) |
Time of Departure to Work by Sex in Winton
The most frequent times of departure to work in Winton are 6:00 AM to 6:29 AM (555, 20.6%) for males and 7:00 AM to 7:29 AM (231, 16.0%) for females.
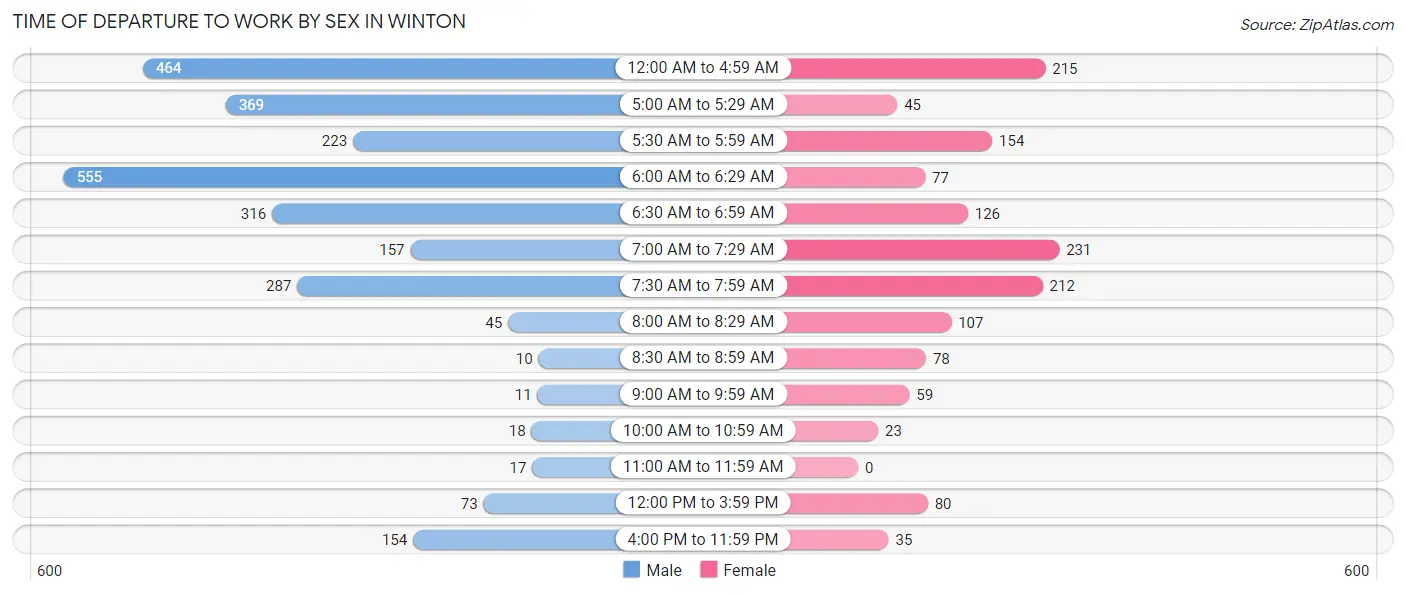
| Time of Departure | Male | Female |
| 12:00 AM to 4:59 AM | 464 (17.2%) | 215 (14.9%) |
| 5:00 AM to 5:29 AM | 369 (13.7%) | 45 (3.1%) |
| 5:30 AM to 5:59 AM | 223 (8.3%) | 154 (10.7%) |
| 6:00 AM to 6:29 AM | 555 (20.6%) | 77 (5.3%) |
| 6:30 AM to 6:59 AM | 316 (11.7%) | 126 (8.7%) |
| 7:00 AM to 7:29 AM | 157 (5.8%) | 231 (16.0%) |
| 7:30 AM to 7:59 AM | 287 (10.6%) | 212 (14.7%) |
| 8:00 AM to 8:29 AM | 45 (1.7%) | 107 (7.4%) |
| 8:30 AM to 8:59 AM | 10 (0.4%) | 78 (5.4%) |
| 9:00 AM to 9:59 AM | 11 (0.4%) | 59 (4.1%) |
| 10:00 AM to 10:59 AM | 18 (0.7%) | 23 (1.6%) |
| 11:00 AM to 11:59 AM | 17 (0.6%) | 0 (0.0%) |
| 12:00 PM to 3:59 PM | 73 (2.7%) | 80 (5.6%) |
| 4:00 PM to 11:59 PM | 154 (5.7%) | 35 (2.4%) |
| Total | 2,699 (100.0%) | 1,442 (100.0%) |
Housing Occupancy in Winton
Occupancy by Ownership in Winton
Of the total 3,271 dwellings in Winton, owner-occupied units account for 1,895 (57.9%), while renter-occupied units make up 1,376 (42.1%).
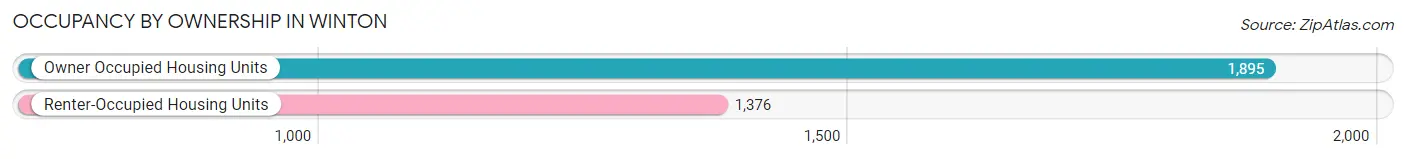
| Occupancy | # Housing Units | % Housing Units |
| Owner Occupied Housing Units | 1,895 | 57.9% |
| Renter-Occupied Housing Units | 1,376 | 42.1% |
| Total Occupied Housing Units | 3,271 | 100.0% |
Occupancy by Household Size in Winton
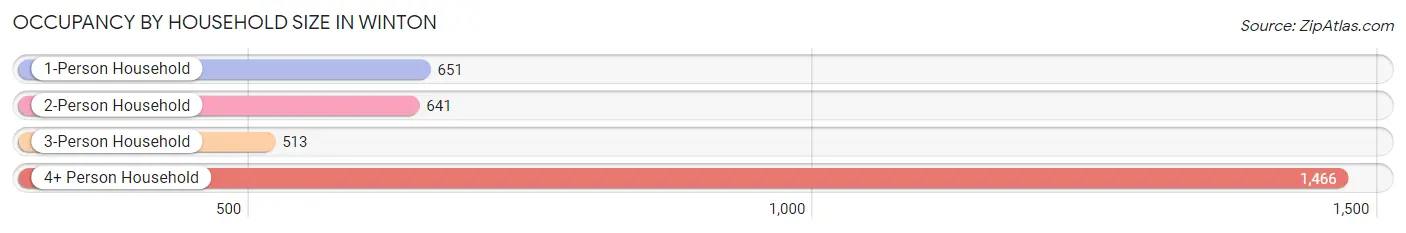
| Household Size | # Housing Units | % Housing Units |
| 1-Person Household | 651 | 19.9% |
| 2-Person Household | 641 | 19.6% |
| 3-Person Household | 513 | 15.7% |
| 4+ Person Household | 1,466 | 44.8% |
| Total Housing Units | 3,271 | 100.0% |
Occupancy by Ownership by Household Size in Winton
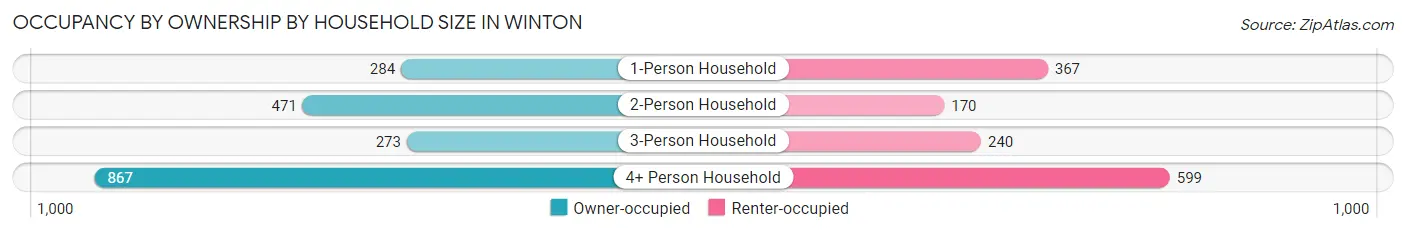
| Household Size | Owner-occupied | Renter-occupied |
| 1-Person Household | 284 (43.6%) | 367 (56.4%) |
| 2-Person Household | 471 (73.5%) | 170 (26.5%) |
| 3-Person Household | 273 (53.2%) | 240 (46.8%) |
| 4+ Person Household | 867 (59.1%) | 599 (40.9%) |
| Total Housing Units | 1,895 (57.9%) | 1,376 (42.1%) |
Occupancy by Educational Attainment in Winton
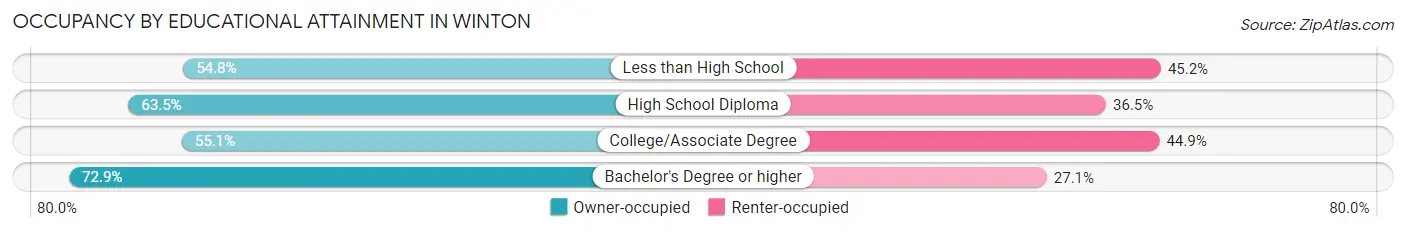
| Household Size | Owner-occupied | Renter-occupied |
| Less than High School | 636 (54.8%) | 524 (45.2%) |
| High School Diploma | 547 (63.5%) | 314 (36.5%) |
| College/Associate Degree | 615 (55.1%) | 502 (44.9%) |
| Bachelor's Degree or higher | 97 (72.9%) | 36 (27.1%) |
Occupancy by Age of Householder in Winton
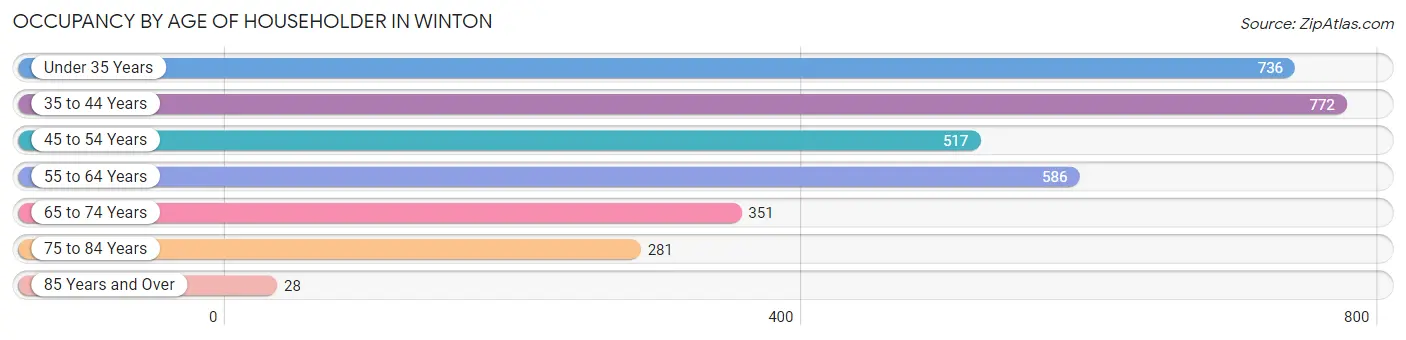
| Age Bracket | # Households | % Households |
| Under 35 Years | 736 | 22.5% |
| 35 to 44 Years | 772 | 23.6% |
| 45 to 54 Years | 517 | 15.8% |
| 55 to 64 Years | 586 | 17.9% |
| 65 to 74 Years | 351 | 10.7% |
| 75 to 84 Years | 281 | 8.6% |
| 85 Years and Over | 28 | 0.9% |
| Total | 3,271 | 100.0% |
Housing Finances in Winton
Median Income by Occupancy in Winton
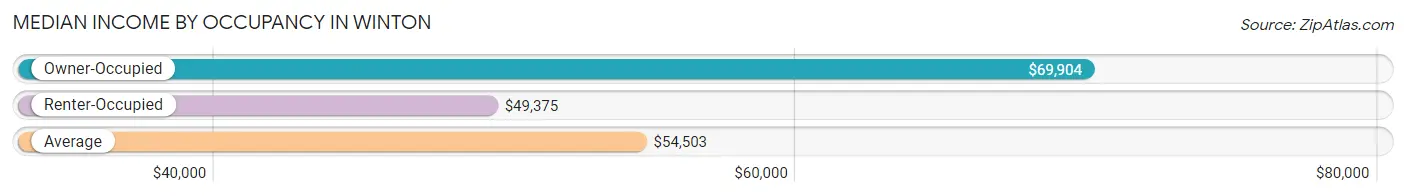
| Occupancy Type | # Households | Median Income |
| Owner-Occupied | 1,895 (57.9%) | $69,904 |
| Renter-Occupied | 1,376 (42.1%) | $49,375 |
| Average | 3,271 (100.0%) | $54,503 |
Occupancy by Householder Income Bracket in Winton
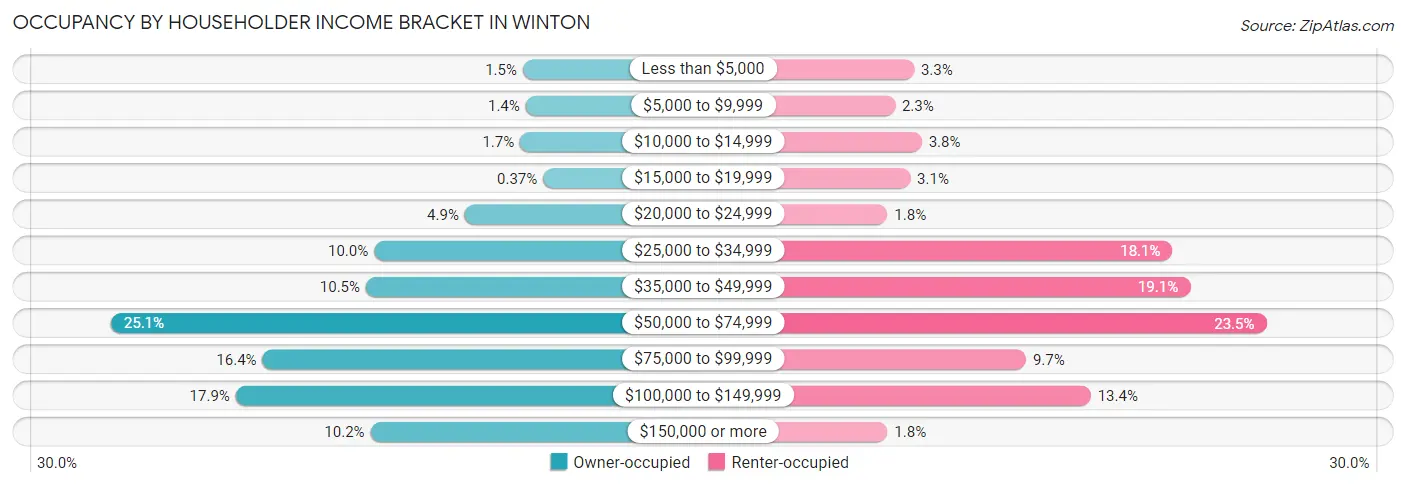
| Income Bracket | Owner-occupied | Renter-occupied |
| Less than $5,000 | 29 (1.5%) | 46 (3.3%) |
| $5,000 to $9,999 | 26 (1.4%) | 31 (2.2%) |
| $10,000 to $14,999 | 32 (1.7%) | 52 (3.8%) |
| $15,000 to $19,999 | 7 (0.4%) | 43 (3.1%) |
| $20,000 to $24,999 | 92 (4.9%) | 25 (1.8%) |
| $25,000 to $34,999 | 190 (10.0%) | 249 (18.1%) |
| $35,000 to $49,999 | 199 (10.5%) | 263 (19.1%) |
| $50,000 to $74,999 | 475 (25.1%) | 323 (23.5%) |
| $75,000 to $99,999 | 311 (16.4%) | 134 (9.7%) |
| $100,000 to $149,999 | 340 (17.9%) | 185 (13.4%) |
| $150,000 or more | 194 (10.2%) | 25 (1.8%) |
| Total | 1,895 (100.0%) | 1,376 (100.0%) |
Monthly Housing Cost Tiers in Winton
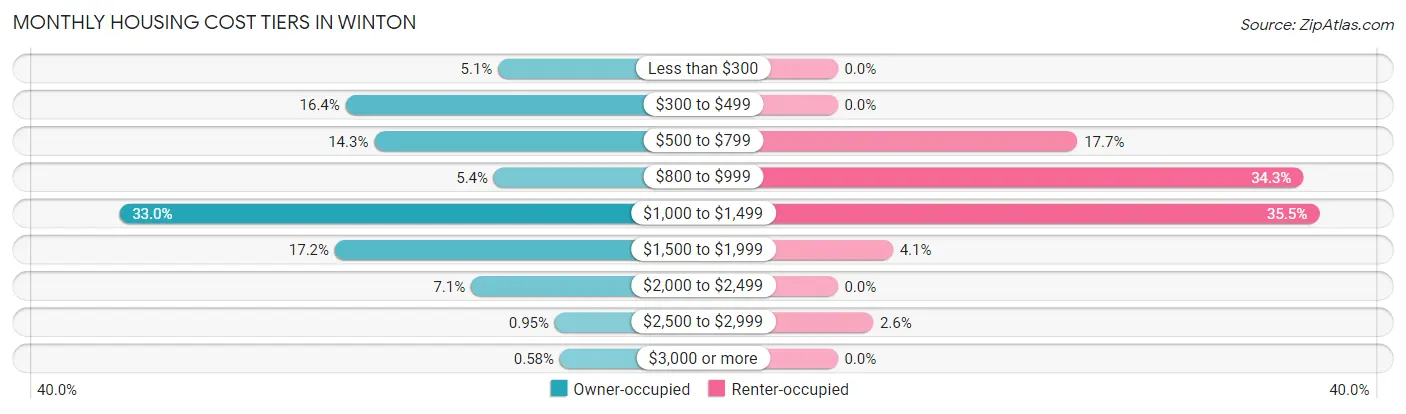
| Monthly Cost | Owner-occupied | Renter-occupied |
| Less than $300 | 97 (5.1%) | 0 (0.0%) |
| $300 to $499 | 310 (16.4%) | 0 (0.0%) |
| $500 to $799 | 270 (14.2%) | 243 (17.7%) |
| $800 to $999 | 103 (5.4%) | 472 (34.3%) |
| $1,000 to $1,499 | 626 (33.0%) | 488 (35.5%) |
| $1,500 to $1,999 | 325 (17.2%) | 56 (4.1%) |
| $2,000 to $2,499 | 135 (7.1%) | 0 (0.0%) |
| $2,500 to $2,999 | 18 (0.9%) | 36 (2.6%) |
| $3,000 or more | 11 (0.6%) | 0 (0.0%) |
| Total | 1,895 (100.0%) | 1,376 (100.0%) |
Physical Housing Characteristics in Winton
Housing Structures in Winton
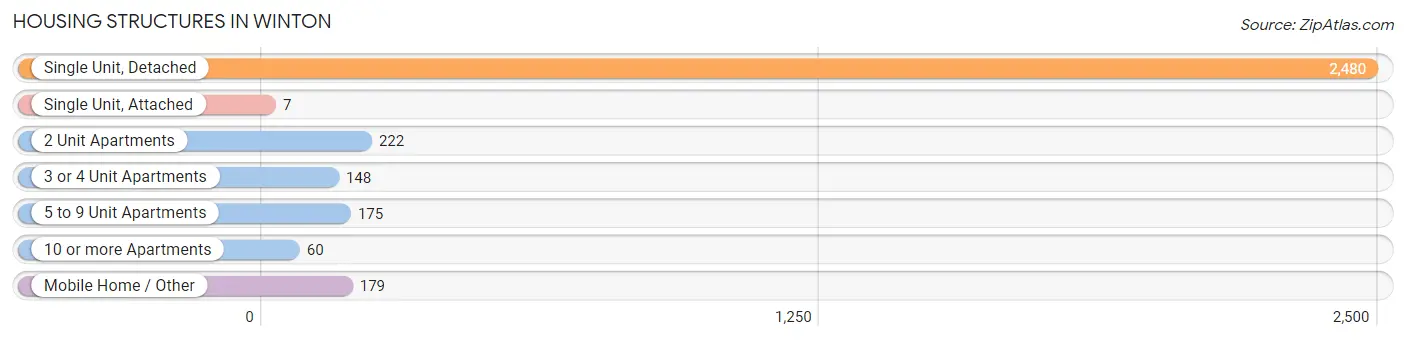
| Structure Type | # Housing Units | % Housing Units |
| Single Unit, Detached | 2,480 | 75.8% |
| Single Unit, Attached | 7 | 0.2% |
| 2 Unit Apartments | 222 | 6.8% |
| 3 or 4 Unit Apartments | 148 | 4.5% |
| 5 to 9 Unit Apartments | 175 | 5.3% |
| 10 or more Apartments | 60 | 1.8% |
| Mobile Home / Other | 179 | 5.5% |
| Total | 3,271 | 100.0% |
Housing Structures by Occupancy in Winton
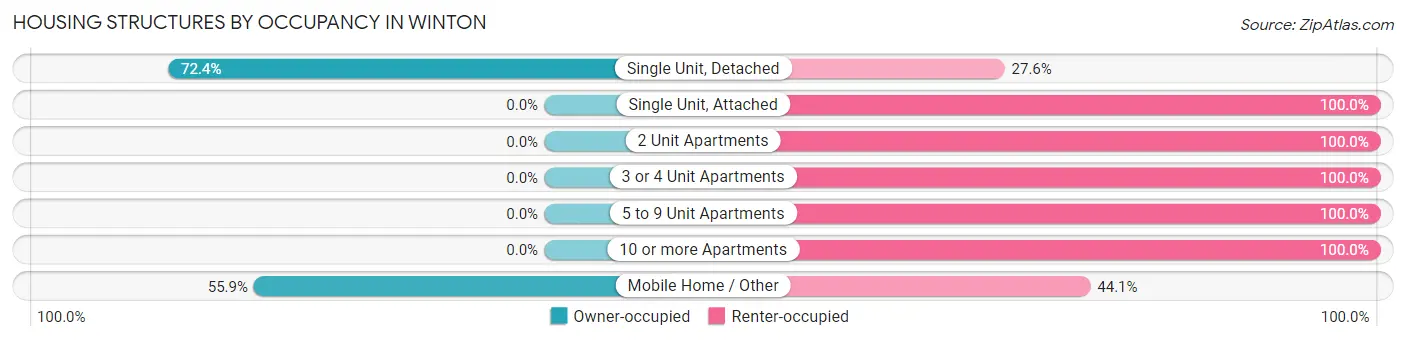
| Structure Type | Owner-occupied | Renter-occupied |
| Single Unit, Detached | 1,795 (72.4%) | 685 (27.6%) |
| Single Unit, Attached | 0 (0.0%) | 7 (100.0%) |
| 2 Unit Apartments | 0 (0.0%) | 222 (100.0%) |
| 3 or 4 Unit Apartments | 0 (0.0%) | 148 (100.0%) |
| 5 to 9 Unit Apartments | 0 (0.0%) | 175 (100.0%) |
| 10 or more Apartments | 0 (0.0%) | 60 (100.0%) |
| Mobile Home / Other | 100 (55.9%) | 79 (44.1%) |
| Total | 1,895 (57.9%) | 1,376 (42.1%) |
Housing Structures by Number of Rooms in Winton
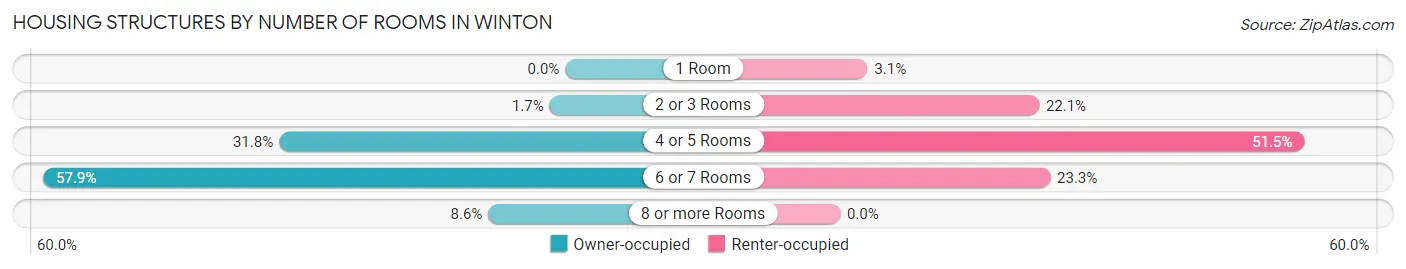
| Number of Rooms | Owner-occupied | Renter-occupied |
| 1 Room | 0 (0.0%) | 42 (3.0%) |
| 2 or 3 Rooms | 33 (1.7%) | 304 (22.1%) |
| 4 or 5 Rooms | 602 (31.8%) | 709 (51.5%) |
| 6 or 7 Rooms | 1,098 (57.9%) | 321 (23.3%) |
| 8 or more Rooms | 162 (8.6%) | 0 (0.0%) |
| Total | 1,895 (100.0%) | 1,376 (100.0%) |
Housing Structure by Heating Type in Winton
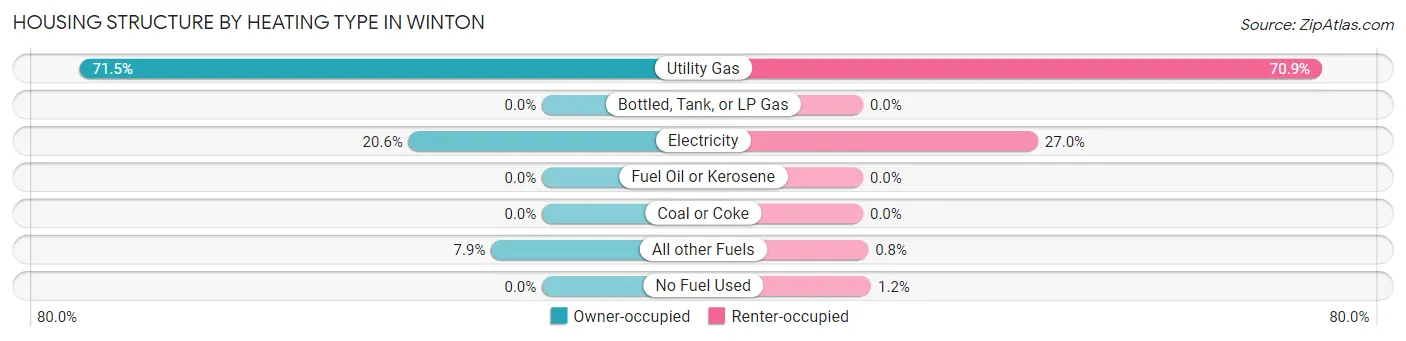
| Heating Type | Owner-occupied | Renter-occupied |
| Utility Gas | 1,355 (71.5%) | 976 (70.9%) |
| Bottled, Tank, or LP Gas | 0 (0.0%) | 0 (0.0%) |
| Electricity | 391 (20.6%) | 372 (27.0%) |
| Fuel Oil or Kerosene | 0 (0.0%) | 0 (0.0%) |
| Coal or Coke | 0 (0.0%) | 0 (0.0%) |
| All other Fuels | 149 (7.9%) | 11 (0.8%) |
| No Fuel Used | 0 (0.0%) | 17 (1.2%) |
| Total | 1,895 (100.0%) | 1,376 (100.0%) |
Household Vehicle Usage in Winton
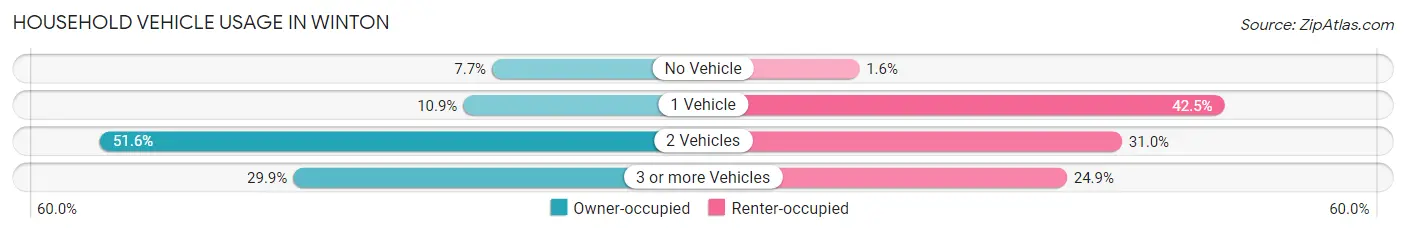
| Vehicles per Household | Owner-occupied | Renter-occupied |
| No Vehicle | 145 (7.6%) | 22 (1.6%) |
| 1 Vehicle | 206 (10.9%) | 585 (42.5%) |
| 2 Vehicles | 977 (51.6%) | 427 (31.0%) |
| 3 or more Vehicles | 567 (29.9%) | 342 (24.8%) |
| Total | 1,895 (100.0%) | 1,376 (100.0%) |
Real Estate & Mortgages in Winton
Real Estate and Mortgage Overview in Winton
| Characteristic | Without Mortgage | With Mortgage |
| Housing Units | 686 | 1,209 |
| Median Property Value | $255,000 | $271,400 |
| Median Household Income | $50,988 | $149 |
| Monthly Housing Costs | $382 | $11 |
| Real Estate Taxes | $1,121 | $12 |
Property Value by Mortgage Status in Winton
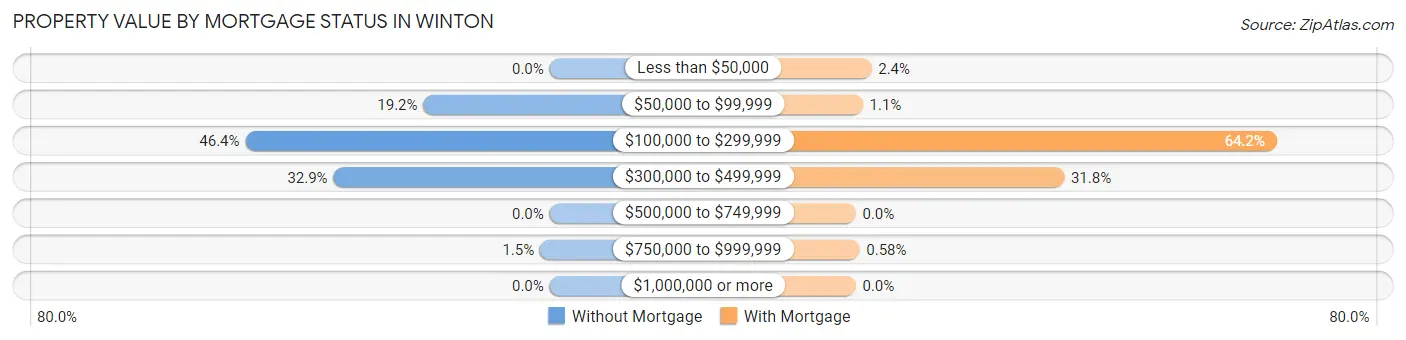
| Property Value | Without Mortgage | With Mortgage |
| Less than $50,000 | 0 (0.0%) | 29 (2.4%) |
| $50,000 to $99,999 | 132 (19.2%) | 13 (1.1%) |
| $100,000 to $299,999 | 318 (46.4%) | 776 (64.2%) |
| $300,000 to $499,999 | 226 (32.9%) | 384 (31.8%) |
| $500,000 to $749,999 | 0 (0.0%) | 0 (0.0%) |
| $750,000 to $999,999 | 10 (1.5%) | 7 (0.6%) |
| $1,000,000 or more | 0 (0.0%) | 0 (0.0%) |
| Total | 686 (100.0%) | 1,209 (100.0%) |
Household Income by Mortgage Status in Winton
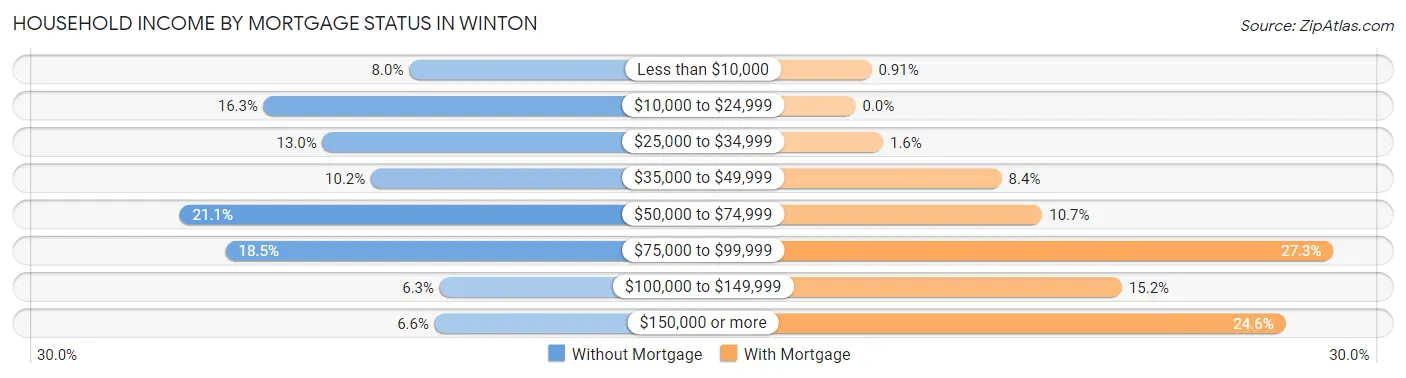
| Household Income | Without Mortgage | With Mortgage |
| Less than $10,000 | 55 (8.0%) | 11 (0.9%) |
| $10,000 to $24,999 | 112 (16.3%) | 0 (0.0%) |
| $25,000 to $34,999 | 89 (13.0%) | 19 (1.6%) |
| $35,000 to $49,999 | 70 (10.2%) | 101 (8.4%) |
| $50,000 to $74,999 | 145 (21.1%) | 129 (10.7%) |
| $75,000 to $99,999 | 127 (18.5%) | 330 (27.3%) |
| $100,000 to $149,999 | 43 (6.3%) | 184 (15.2%) |
| $150,000 or more | 45 (6.6%) | 297 (24.6%) |
| Total | 686 (100.0%) | 1,209 (100.0%) |
Property Value to Household Income Ratio in Winton
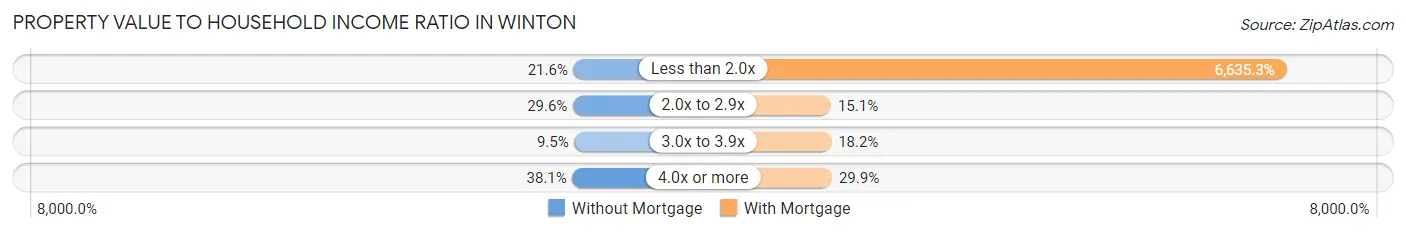
| Value-to-Income Ratio | Without Mortgage | With Mortgage |
| Less than 2.0x | 148 (21.6%) | 80,221 (6,635.3%) |
| 2.0x to 2.9x | 203 (29.6%) | 183 (15.1%) |
| 3.0x to 3.9x | 65 (9.5%) | 220 (18.2%) |
| 4.0x or more | 261 (38.1%) | 361 (29.9%) |
| Total | 686 (100.0%) | 1,209 (100.0%) |
Real Estate Taxes by Mortgage Status in Winton
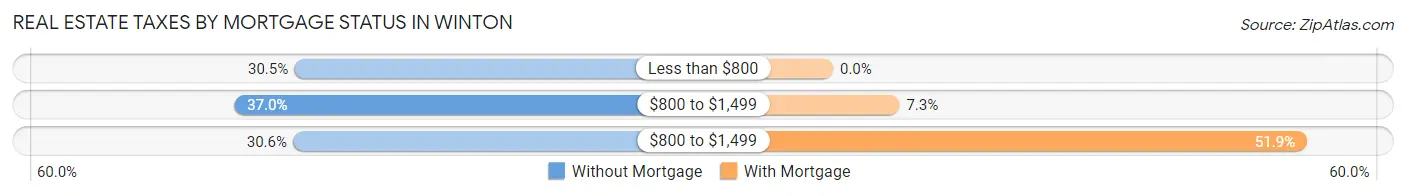
| Property Taxes | Without Mortgage | With Mortgage |
| Less than $800 | 209 (30.5%) | 0 (0.0%) |
| $800 to $1,499 | 254 (37.0%) | 88 (7.3%) |
| $800 to $1,499 | 210 (30.6%) | 628 (51.9%) |
| Total | 686 (100.0%) | 1,209 (100.0%) |
Health & Disability in Winton
Health Insurance Coverage by Age in Winton
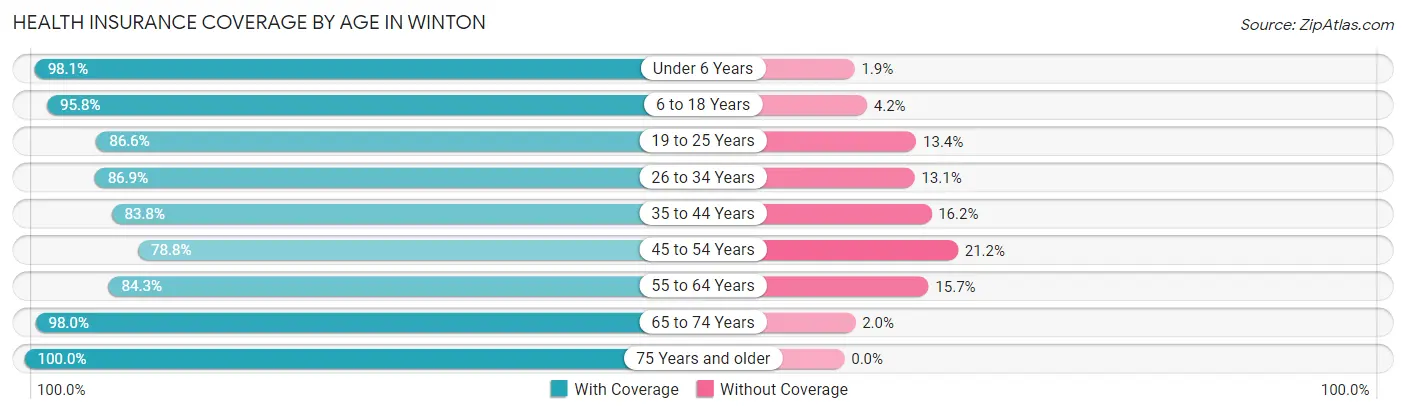
| Age Bracket | With Coverage | Without Coverage |
| Under 6 Years | 1,340 (98.1%) | 26 (1.9%) |
| 6 to 18 Years | 2,705 (95.8%) | 119 (4.2%) |
| 19 to 25 Years | 957 (86.6%) | 148 (13.4%) |
| 26 to 34 Years | 1,594 (86.9%) | 240 (13.1%) |
| 35 to 44 Years | 1,246 (83.8%) | 241 (16.2%) |
| 45 to 54 Years | 857 (78.8%) | 230 (21.2%) |
| 55 to 64 Years | 887 (84.3%) | 165 (15.7%) |
| 65 to 74 Years | 672 (98.0%) | 14 (2.0%) |
| 75 Years and older | 528 (100.0%) | 0 (0.0%) |
| Total | 10,786 (90.1%) | 1,183 (9.9%) |
Health Insurance Coverage by Citizenship Status in Winton
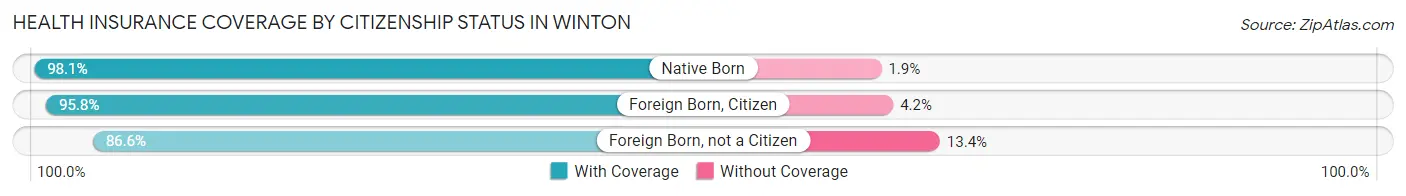
| Citizenship Status | With Coverage | Without Coverage |
| Native Born | 1,340 (98.1%) | 26 (1.9%) |
| Foreign Born, Citizen | 2,705 (95.8%) | 119 (4.2%) |
| Foreign Born, not a Citizen | 957 (86.6%) | 148 (13.4%) |
Health Insurance Coverage by Household Income in Winton
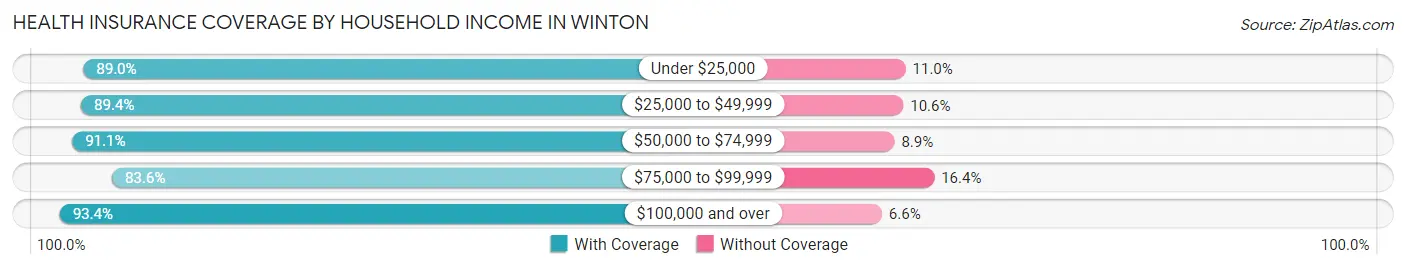
| Household Income | With Coverage | Without Coverage |
| Under $25,000 | 840 (89.0%) | 104 (11.0%) |
| $25,000 to $49,999 | 2,288 (89.4%) | 271 (10.6%) |
| $50,000 to $74,999 | 2,834 (91.1%) | 278 (8.9%) |
| $75,000 to $99,999 | 1,516 (83.6%) | 297 (16.4%) |
| $100,000 and over | 3,308 (93.4%) | 233 (6.6%) |
Public vs Private Health Insurance Coverage by Age in Winton
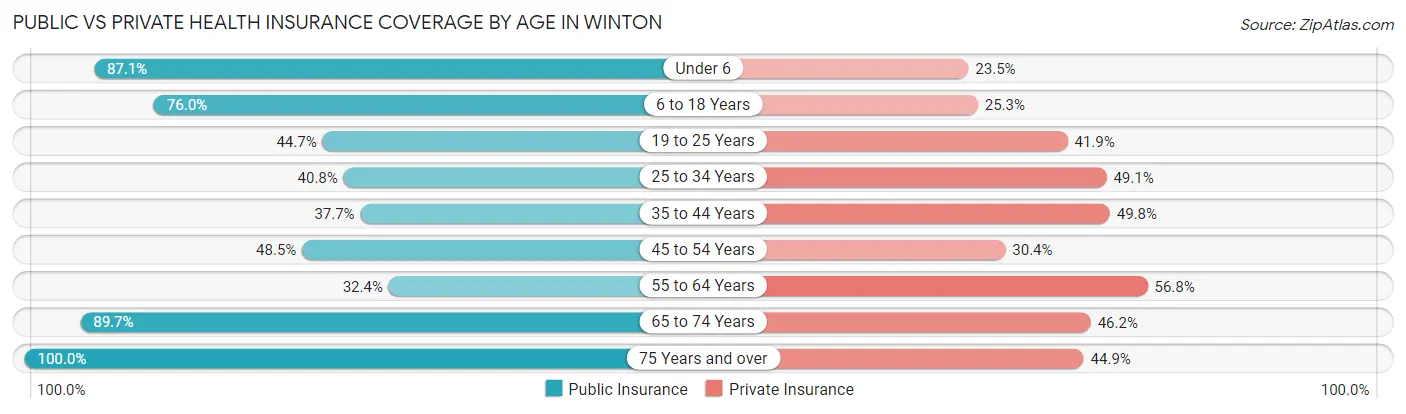
| Age Bracket | Public Insurance | Private Insurance |
| Under 6 | 1,190 (87.1%) | 321 (23.5%) |
| 6 to 18 Years | 2,146 (76.0%) | 713 (25.3%) |
| 19 to 25 Years | 494 (44.7%) | 463 (41.9%) |
| 25 to 34 Years | 748 (40.8%) | 901 (49.1%) |
| 35 to 44 Years | 560 (37.7%) | 740 (49.8%) |
| 45 to 54 Years | 527 (48.5%) | 330 (30.4%) |
| 55 to 64 Years | 341 (32.4%) | 597 (56.8%) |
| 65 to 74 Years | 615 (89.6%) | 317 (46.2%) |
| 75 Years and over | 528 (100.0%) | 237 (44.9%) |
| Total | 7,149 (59.7%) | 4,619 (38.6%) |
Disability Status by Sex by Age in Winton
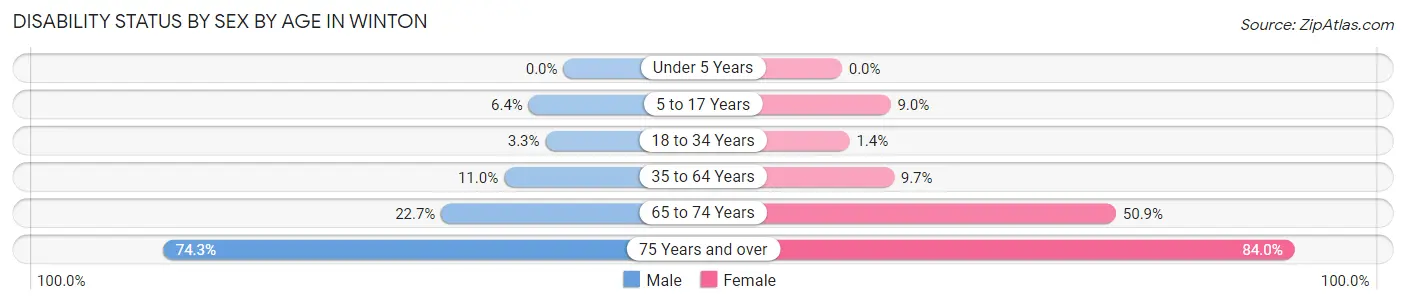
| Age Bracket | Male | Female |
| Under 5 Years | 0 (0.0%) | 0 (0.0%) |
| 5 to 17 Years | 98 (6.4%) | 114 (9.0%) |
| 18 to 34 Years | 59 (3.3%) | 21 (1.4%) |
| 35 to 64 Years | 218 (11.0%) | 159 (9.7%) |
| 65 to 74 Years | 90 (22.7%) | 147 (50.9%) |
| 75 Years and over | 197 (74.3%) | 221 (84.0%) |
Disability Class by Sex by Age in Winton
Disability Class: Hearing Difficulty
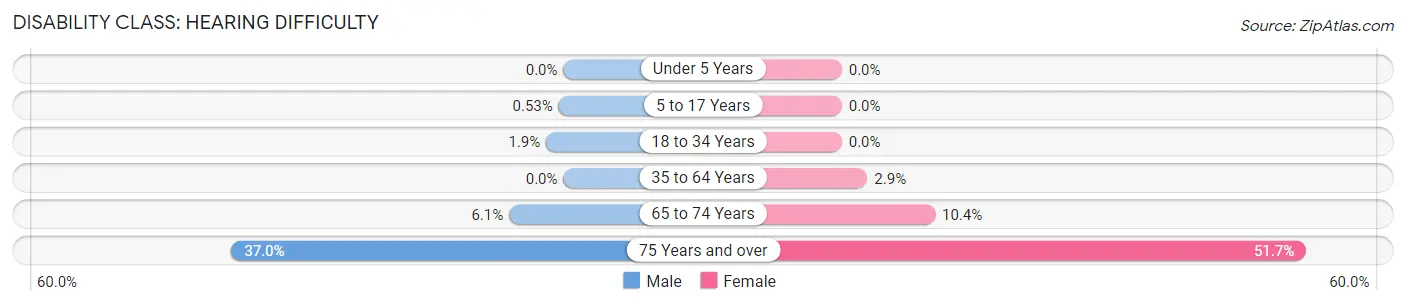
| Age Bracket | Male | Female |
| Under 5 Years | 0 (0.0%) | 0 (0.0%) |
| 5 to 17 Years | 8 (0.5%) | 0 (0.0%) |
| 18 to 34 Years | 34 (1.9%) | 0 (0.0%) |
| 35 to 64 Years | 0 (0.0%) | 47 (2.9%) |
| 65 to 74 Years | 24 (6.0%) | 30 (10.4%) |
| 75 Years and over | 98 (37.0%) | 136 (51.7%) |
Disability Class: Vision Difficulty
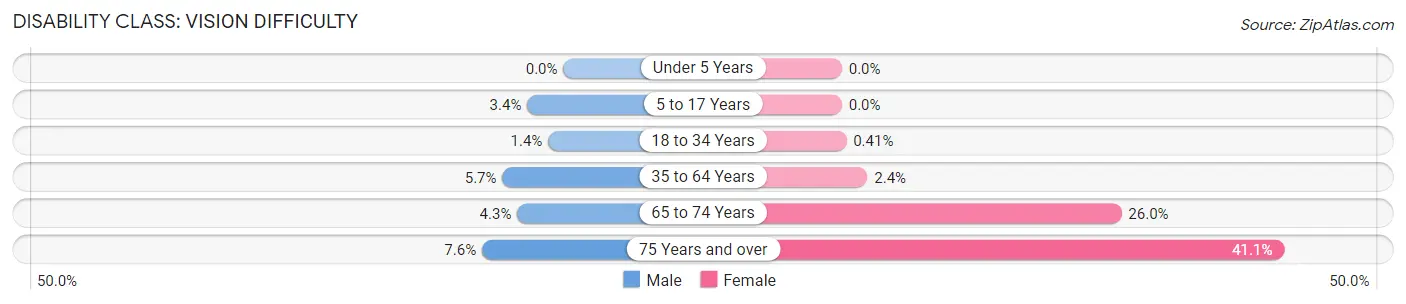
| Age Bracket | Male | Female |
| Under 5 Years | 0 (0.0%) | 0 (0.0%) |
| 5 to 17 Years | 51 (3.4%) | 0 (0.0%) |
| 18 to 34 Years | 25 (1.4%) | 6 (0.4%) |
| 35 to 64 Years | 112 (5.7%) | 39 (2.4%) |
| 65 to 74 Years | 17 (4.3%) | 75 (26.0%) |
| 75 Years and over | 20 (7.5%) | 108 (41.1%) |
Disability Class: Cognitive Difficulty
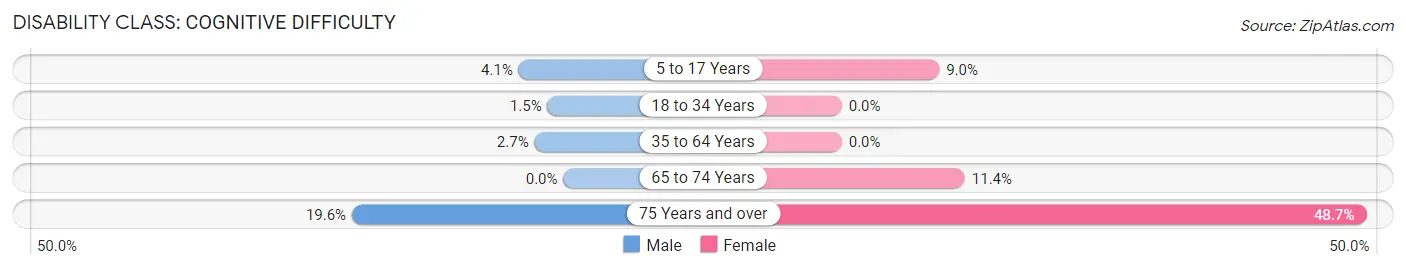
| Age Bracket | Male | Female |
| 5 to 17 Years | 63 (4.1%) | 114 (9.0%) |
| 18 to 34 Years | 26 (1.5%) | 0 (0.0%) |
| 35 to 64 Years | 53 (2.7%) | 0 (0.0%) |
| 65 to 74 Years | 0 (0.0%) | 33 (11.4%) |
| 75 Years and over | 52 (19.6%) | 128 (48.7%) |
Disability Class: Ambulatory Difficulty
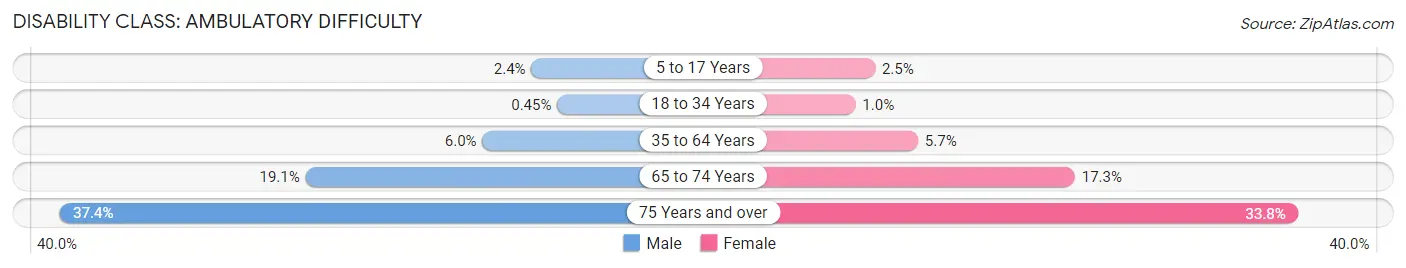
| Age Bracket | Male | Female |
| 5 to 17 Years | 36 (2.4%) | 31 (2.5%) |
| 18 to 34 Years | 8 (0.4%) | 15 (1.0%) |
| 35 to 64 Years | 119 (6.0%) | 93 (5.7%) |
| 65 to 74 Years | 76 (19.1%) | 50 (17.3%) |
| 75 Years and over | 99 (37.4%) | 89 (33.8%) |
Disability Class: Self-Care Difficulty
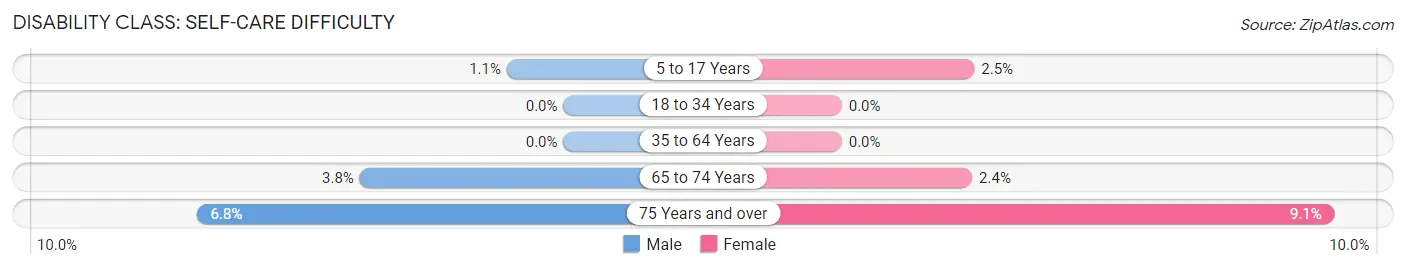
| Age Bracket | Male | Female |
| 5 to 17 Years | 16 (1.1%) | 31 (2.5%) |
| 18 to 34 Years | 0 (0.0%) | 0 (0.0%) |
| 35 to 64 Years | 0 (0.0%) | 0 (0.0%) |
| 65 to 74 Years | 15 (3.8%) | 7 (2.4%) |
| 75 Years and over | 18 (6.8%) | 24 (9.1%) |
Technology Access in Winton
Computing Device Access in Winton
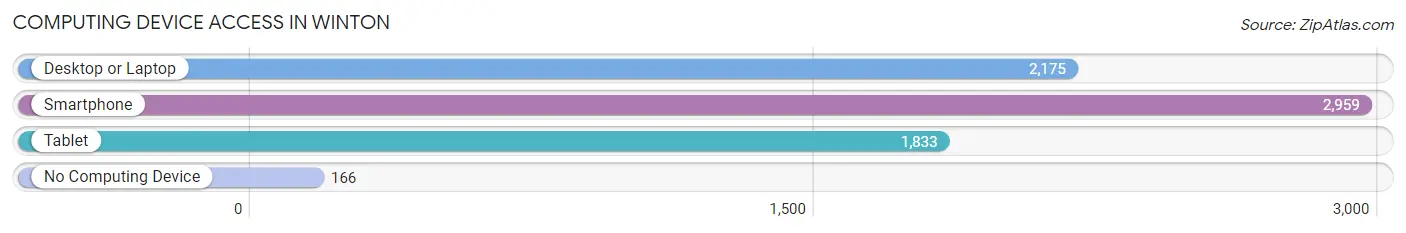
| Device Type | # Households | % Households |
| Desktop or Laptop | 2,175 | 66.5% |
| Smartphone | 2,959 | 90.5% |
| Tablet | 1,833 | 56.0% |
| No Computing Device | 166 | 5.1% |
| Total | 3,271 | 100.0% |
Internet Access in Winton
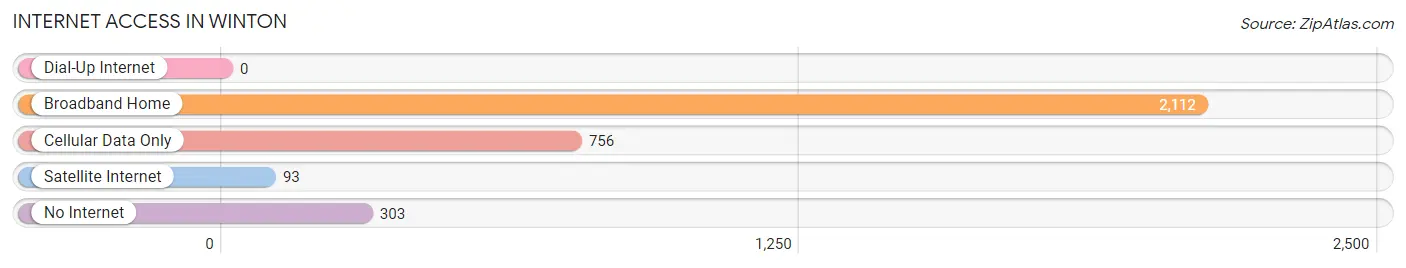
| Internet Type | # Households | % Households |
| Dial-Up Internet | 0 | 0.0% |
| Broadband Home | 2,112 | 64.6% |
| Cellular Data Only | 756 | 23.1% |
| Satellite Internet | 93 | 2.8% |
| No Internet | 303 | 9.3% |
| Total | 3,271 | 100.0% |
Winton Summary
Winton is a small unincorporated community located in Merced County, California. It is situated in the San Joaquin Valley, approximately 8 miles south of Merced and about 70 miles south of Sacramento. The population of Winton was estimated to be around 4,000 in 2020.
History
The area that is now Winton was originally inhabited by the Yokuts Native American tribe. The first European settlers arrived in the area in the late 1800s, and the town was officially founded in 1891. The town was named after William Winton, a local rancher and businessman.
In the early 1900s, Winton was a thriving agricultural community, with many of its residents working in the local fields and orchards. The town was also home to a number of small businesses, including a general store, a blacksmith shop, and a hotel.
Geography
Winton is located in the San Joaquin Valley, approximately 8 miles south of Merced and about 70 miles south of Sacramento. The town is situated at an elevation of approximately 200 feet above sea level. The climate in Winton is generally warm and dry, with temperatures ranging from the mid-50s in the winter to the mid-90s in the summer.
Economy
The economy of Winton is largely based on agriculture. The town is home to a number of farms and orchards, which produce a variety of crops, including almonds, walnuts, peaches, and tomatoes. In addition, Winton is home to a number of small businesses, including restaurants, gas stations, and convenience stores.
Demographics
As of 2020, the population of Winton was estimated to be around 4,000. The town is predominantly Hispanic, with approximately 75% of the population identifying as such. The median household income in Winton is approximately $45,000, and the median home value is around $200,000.
Conclusion
Winton is a small unincorporated community located in Merced County, California. It is situated in the San Joaquin Valley, approximately 8 miles south of Merced and about 70 miles south of Sacramento. The population of Winton was estimated to be around 4,000 in 2020. The town is predominantly Hispanic, with approximately 75% of the population identifying as such. The economy of Winton is largely based on agriculture, with a number of farms and orchards producing a variety of crops. In addition, Winton is home to a number of small businesses, including restaurants, gas stations, and convenience stores.
Common Questions
What is Per Capita Income in Winton?
Per Capita income in Winton is $20,873.
What is the Median Family Income in Winton?
Median Family Income in Winton is $58,161.
What is the Median Household income in Winton?
Median Household Income in Winton is $54,503.
What is Income or Wage Gap in Winton?
Income or Wage Gap in Winton is 40.9%.
Women in Winton earn 59.1 cents for every dollar earned by a man.
What is Inequality or Gini Index in Winton?
Inequality or Gini Index in Winton is 0.38.
What is the Total Population of Winton?
Total Population of Winton is 11,986.
What is the Total Male Population of Winton?
Total Male Population of Winton is 6,577.
What is the Total Female Population of Winton?
Total Female Population of Winton is 5,409.
What is the Ratio of Males per 100 Females in Winton?
There are 121.59 Males per 100 Females in Winton.
What is the Ratio of Females per 100 Males in Winton?
There are 82.24 Females per 100 Males in Winton.
What is the Median Population Age in Winton?
Median Population Age in Winton is 29.1 Years.
What is the Average Family Size in Winton
Average Family Size in Winton is 4.2 People.
What is the Average Household Size in Winton
Average Household Size in Winton is 3.7 People.
How Large is the Labor Force in Winton?
There are 5,005 People in the Labor Forcein in Winton.
What is the Percentage of People in the Labor Force in Winton?
58.6% of People are in the Labor Force in Winton.
What is the Unemployment Rate in Winton?
Unemployment Rate in Winton is 11.3%.