Zip Codes with the Highest Percentage of Population with a Degree in Liberal Arts and History in San Luis Obispo, CA
RELATED REPORTS & OPTIONS
Liberal Arts and History
San Luis Obispo
Compare Zip Codes
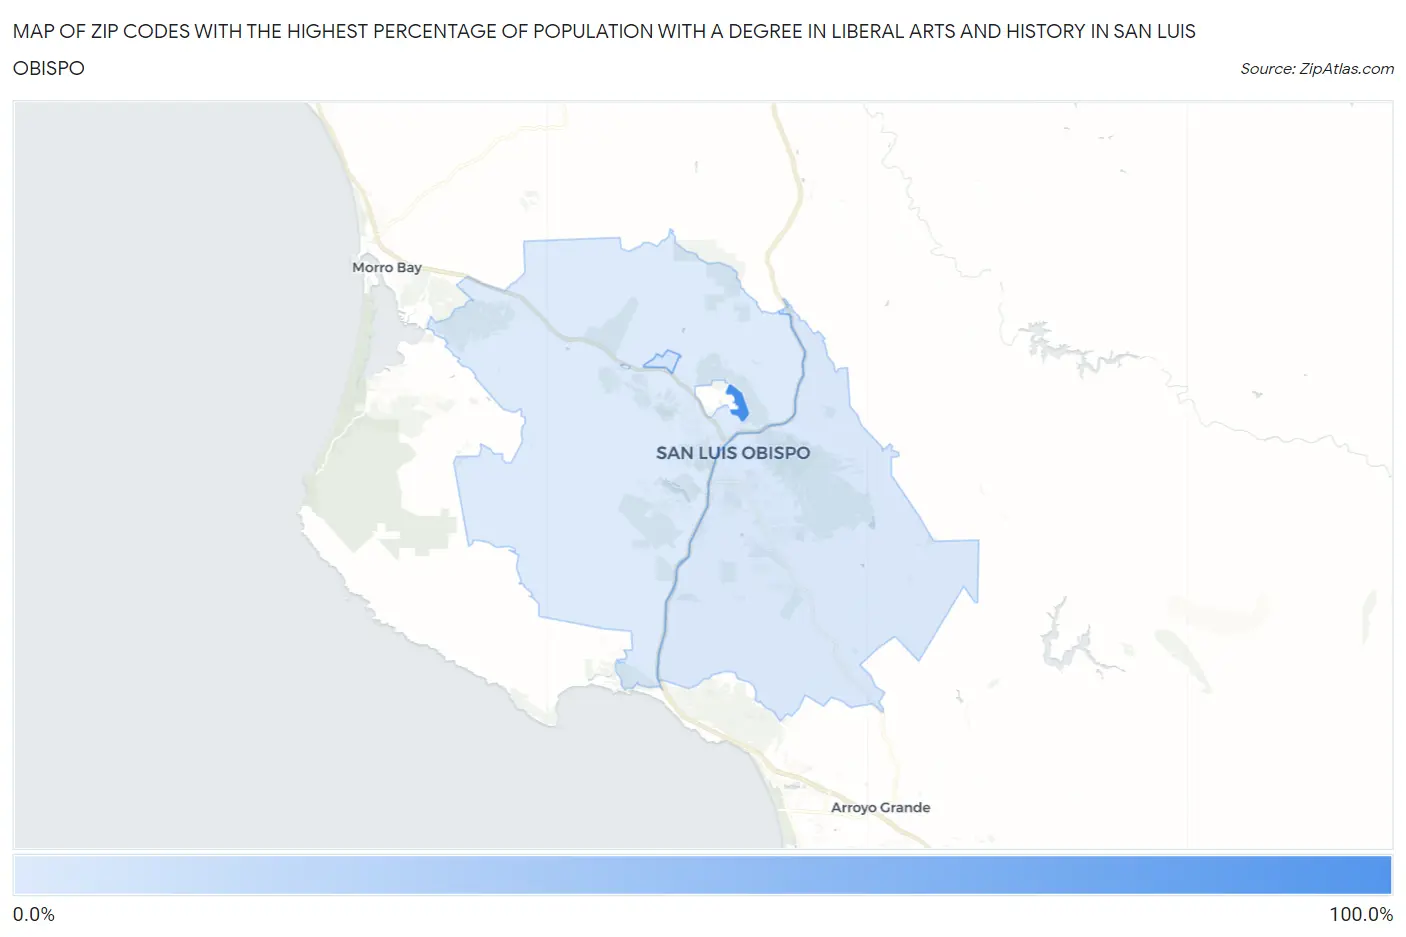
Map of Zip Codes with the Highest Percentage of Population with a Degree in Liberal Arts and History in San Luis Obispo
4.1%
100.0%
Zip Codes with the Highest Percentage of Population with a Degree in Liberal Arts and History in San Luis Obispo, CA
| Zip Code | % Graduates | vs State | vs National | |
| 1. | 93410 | 100.0% | 5.5%(+94.5)#1 | 4.9%(+95.1)#1 |
| 2. | 93409 | 8.3% | 5.5%(+2.84)#350 | 4.9%(+3.46)#4,509 |
| 3. | 93401 | 6.1% | 5.5%(+0.566)#730 | 4.9%(+1.19)#8,352 |
| 4. | 93405 | 4.1% | 5.5%(-1.45)#1,173 | 4.9%(-0.822)#14,584 |
1
Common Questions
What are the Top 3 Zip Codes with the Highest Percentage of Population with a Degree in Liberal Arts and History in San Luis Obispo, CA?
Top 3 Zip Codes with the Highest Percentage of Population with a Degree in Liberal Arts and History in San Luis Obispo, CA are:
What zip code has the Highest Percentage of Population with a Degree in Liberal Arts and History in San Luis Obispo, CA?
93410 has the Highest Percentage of Population with a Degree in Liberal Arts and History in San Luis Obispo, CA with 100.0%.
What is the Percentage of Population with a Degree in Liberal Arts and History in San Luis Obispo, CA?
Percentage of Population with a Degree in Liberal Arts and History in San Luis Obispo is 5.3%.
What is the Percentage of Population with a Degree in Liberal Arts and History in California?
Percentage of Population with a Degree in Liberal Arts and History in California is 5.5%.
What is the Percentage of Population with a Degree in Liberal Arts and History in the United States?
Percentage of Population with a Degree in Liberal Arts and History in the United States is 4.9%.