Cities with the Highest Percentage of Population with a Degree in Liberal Arts and History in Montana
RELATED REPORTS & OPTIONS
Liberal Arts and History
Montana
Compare Cities
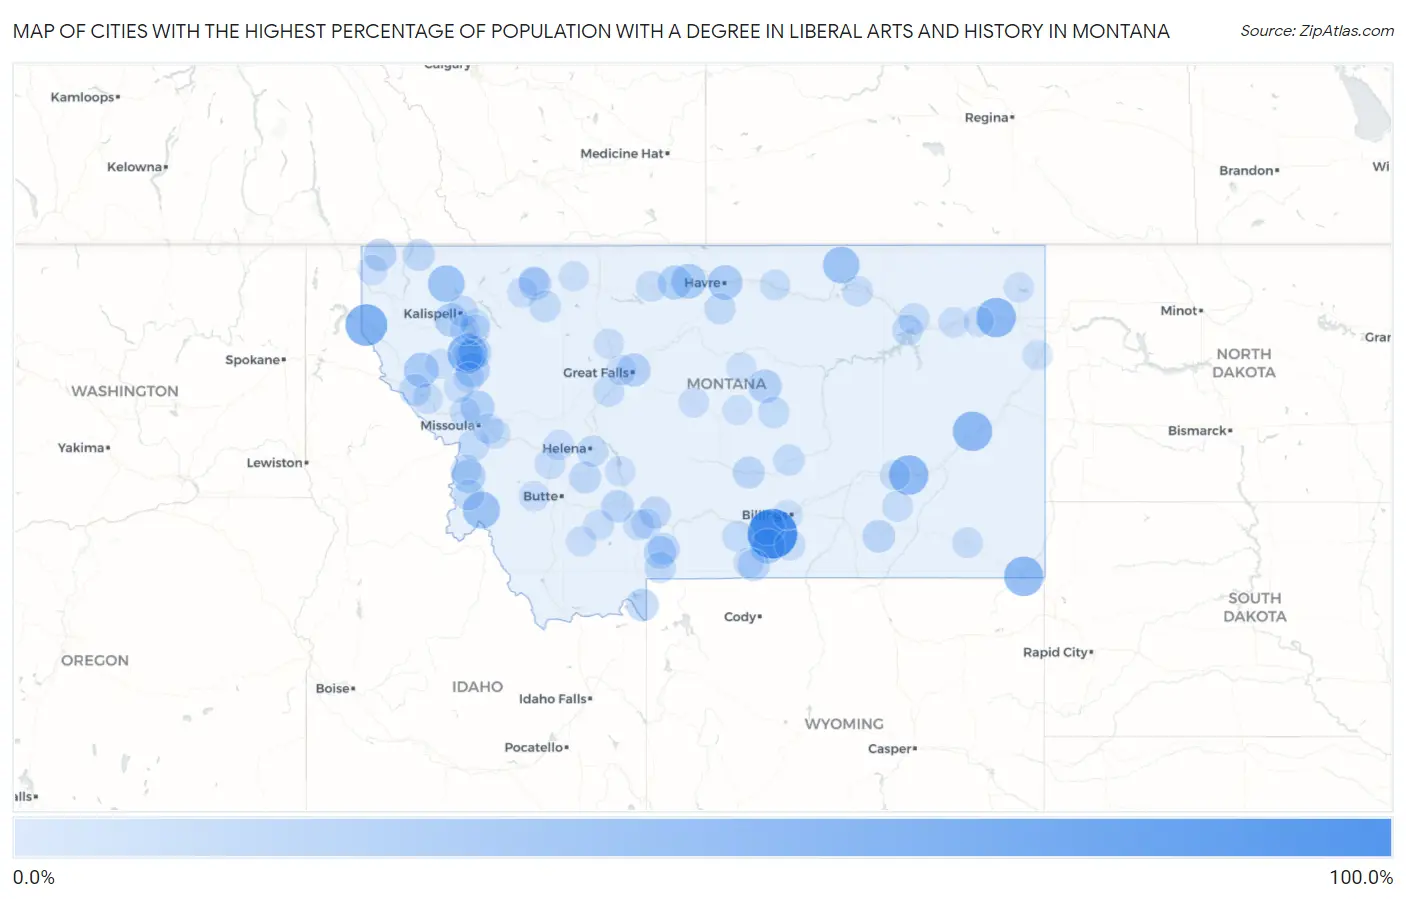
Map of Cities with the Highest Percentage of Population with a Degree in Liberal Arts and History in Montana
0.0%
100.0%
Cities with the Highest Percentage of Population with a Degree in Liberal Arts and History in Montana
| City | % Graduates | vs State | vs National | |
| 1. | Sapphire Ridge | 100.0% | 5.3%(+94.7)#1 | 4.9%(+95.1)#85 |
| 2. | Silesia | 100.0% | 5.3%(+94.7)#2 | 4.9%(+95.1)#90 |
| 3. | Nye | 61.1% | 5.3%(+55.8)#3 | 4.9%(+56.2)#166 |
| 4. | Heron | 60.6% | 5.3%(+55.3)#4 | 4.9%(+55.7)#171 |
| 5. | Rocky Point | 51.6% | 5.3%(+46.3)#5 | 4.9%(+46.7)#218 |
| 6. | Terry | 50.0% | 5.3%(+44.7)#6 | 4.9%(+45.1)#231 |
| 7. | Brockton | 50.0% | 5.3%(+44.7)#7 | 4.9%(+45.1)#233 |
| 8. | Alzada | 50.0% | 5.3%(+44.7)#8 | 4.9%(+45.1)#277 |
| 9. | Rosebud | 50.0% | 5.3%(+44.7)#9 | 4.9%(+45.1)#278 |
| 10. | Sula | 38.9% | 5.3%(+33.6)#10 | 4.9%(+34.0)#400 |
| 11. | Silver Star | 38.6% | 5.3%(+33.3)#11 | 4.9%(+33.8)#403 |
| 12. | Olney | 36.7% | 5.3%(+31.4)#12 | 4.9%(+31.8)#445 |
| 13. | Whitewater | 36.7% | 5.3%(+31.4)#13 | 4.9%(+31.8)#446 |
| 14. | Park City | 29.8% | 5.3%(+24.5)#14 | 4.9%(+24.9)#664 |
| 15. | Gildford | 28.0% | 5.3%(+22.7)#15 | 4.9%(+23.1)#738 |
| 16. | Fromberg | 27.9% | 5.3%(+22.6)#16 | 4.9%(+23.0)#742 |
| 17. | Havre North | 27.7% | 5.3%(+22.4)#17 | 4.9%(+22.8)#753 |
| 18. | Weeksville | 27.3% | 5.3%(+22.0)#18 | 4.9%(+22.4)#780 |
| 19. | Ronan | 25.1% | 5.3%(+19.8)#19 | 4.9%(+20.2)#884 |
| 20. | Helmville | 25.0% | 5.3%(+19.7)#20 | 4.9%(+20.1)#921 |
| 21. | Rudyard | 24.1% | 5.3%(+18.8)#21 | 4.9%(+19.2)#961 |
| 22. | Evaro | 23.4% | 5.3%(+18.1)#22 | 4.9%(+18.5)#1,005 |
| 23. | Kila | 22.6% | 5.3%(+17.3)#23 | 4.9%(+17.7)#1,053 |
| 24. | Hamilton | 21.3% | 5.3%(+16.0)#24 | 4.9%(+16.4)#1,171 |
| 25. | Roy | 21.1% | 5.3%(+15.8)#25 | 4.9%(+16.2)#1,189 |
| 26. | Black Eagle | 20.7% | 5.3%(+15.4)#26 | 4.9%(+15.8)#1,217 |
| 27. | Finley Point | 19.1% | 5.3%(+13.8)#27 | 4.9%(+14.2)#1,384 |
| 28. | Rockvale | 18.4% | 5.3%(+13.1)#28 | 4.9%(+13.5)#1,459 |
| 29. | South Browning | 17.9% | 5.3%(+12.6)#29 | 4.9%(+13.0)#1,525 |
| 30. | Yaak | 17.9% | 5.3%(+12.6)#30 | 4.9%(+13.0)#1,536 |
| 31. | Busby | 17.6% | 5.3%(+12.4)#31 | 4.9%(+12.8)#1,556 |
| 32. | South Glastonbury | 17.4% | 5.3%(+12.1)#32 | 4.9%(+12.5)#1,598 |
| 33. | Fishtail | 16.7% | 5.3%(+11.4)#33 | 4.9%(+11.8)#1,746 |
| 34. | Glen | 16.7% | 5.3%(+11.4)#34 | 4.9%(+11.8)#1,756 |
| 35. | West Yellowstone | 16.6% | 5.3%(+11.3)#35 | 4.9%(+11.7)#1,765 |
| 36. | Three Forks | 16.5% | 5.3%(+11.2)#36 | 4.9%(+11.6)#1,770 |
| 37. | Ryegate | 15.4% | 5.3%(+10.1)#37 | 4.9%(+10.5)#1,982 |
| 38. | Bearcreek | 14.7% | 5.3%(+9.41)#38 | 4.9%(+9.83)#2,110 |
| 39. | Eureka | 14.4% | 5.3%(+9.15)#39 | 4.9%(+9.57)#2,163 |
| 40. | Boulder | 14.4% | 5.3%(+9.13)#40 | 4.9%(+9.55)#2,168 |
| 41. | Bridger | 14.3% | 5.3%(+8.99)#41 | 4.9%(+9.41)#2,240 |
| 42. | St Regis | 13.9% | 5.3%(+8.60)#42 | 4.9%(+9.02)#2,335 |
| 43. | Emigrant | 13.7% | 5.3%(+8.39)#43 | 4.9%(+8.81)#2,393 |
| 44. | Florence | 13.1% | 5.3%(+7.80)#44 | 4.9%(+8.22)#2,582 |
| 45. | Heart Butte | 12.9% | 5.3%(+7.61)#45 | 4.9%(+8.03)#2,646 |
| 46. | South Hills | 12.0% | 5.3%(+6.71)#46 | 4.9%(+7.13)#2,969 |
| 47. | Corwin Springs | 11.9% | 5.3%(+6.65)#47 | 4.9%(+7.07)#3,000 |
| 48. | Rocky Boy S Agency | 11.8% | 5.3%(+6.47)#48 | 4.9%(+6.89)#3,085 |
| 49. | Grass Range | 11.8% | 5.3%(+6.47)#49 | 4.9%(+6.89)#3,089 |
| 50. | Evergreen | 11.5% | 5.3%(+6.20)#50 | 4.9%(+6.62)#3,188 |
| 51. | Roundup | 11.5% | 5.3%(+6.18)#51 | 4.9%(+6.60)#3,191 |
| 52. | Cascade | 11.4% | 5.3%(+6.07)#52 | 4.9%(+6.49)#3,242 |
| 53. | Nashua | 10.9% | 5.3%(+5.65)#53 | 4.9%(+6.07)#3,460 |
| 54. | Absarokee | 10.4% | 5.3%(+5.14)#54 | 4.9%(+5.56)#3,746 |
| 55. | Fort Peck | 10.3% | 5.3%(+5.00)#55 | 4.9%(+5.42)#3,815 |
| 56. | Polson | 10.2% | 5.3%(+4.88)#56 | 4.9%(+5.30)#3,879 |
| 57. | Pinesdale | 10.0% | 5.3%(+4.71)#57 | 4.9%(+5.13)#3,972 |
| 58. | Pryor | 10.0% | 5.3%(+4.71)#58 | 4.9%(+5.13)#3,981 |
| 59. | Colstrip | 10.0% | 5.3%(+4.68)#59 | 4.9%(+5.10)#4,025 |
| 60. | Four Corners | 9.8% | 5.3%(+4.47)#60 | 4.9%(+4.89)#4,130 |
| 61. | Darby | 9.7% | 5.3%(+4.43)#61 | 4.9%(+4.85)#4,159 |
| 62. | Deer Lodge | 9.7% | 5.3%(+4.38)#62 | 4.9%(+4.80)#4,203 |
| 63. | Chester | 9.3% | 5.3%(+4.04)#63 | 4.9%(+4.46)#4,450 |
| 64. | Frenchtown | 8.8% | 5.3%(+3.49)#64 | 4.9%(+3.91)#4,896 |
| 65. | Jette | 8.7% | 5.3%(+3.40)#65 | 4.9%(+3.82)#4,988 |
| 66. | Saco | 8.7% | 5.3%(+3.40)#66 | 4.9%(+3.82)#4,992 |
| 67. | Superior | 8.6% | 5.3%(+3.34)#67 | 4.9%(+3.76)#5,030 |
| 68. | Broadus | 8.6% | 5.3%(+3.33)#68 | 4.9%(+3.75)#5,043 |
| 69. | Harlem | 8.6% | 5.3%(+3.31)#69 | 4.9%(+3.73)#5,057 |
| 70. | Pony | 8.5% | 5.3%(+3.24)#70 | 4.9%(+3.66)#5,106 |
| 71. | Wolf Point | 8.4% | 5.3%(+3.08)#71 | 4.9%(+3.50)#5,244 |
| 72. | Red Lodge | 8.2% | 5.3%(+2.92)#72 | 4.9%(+3.34)#5,438 |
| 73. | East Glacier Park Village | 8.2% | 5.3%(+2.92)#73 | 4.9%(+3.34)#5,450 |
| 74. | Avon | 8.2% | 5.3%(+2.87)#74 | 4.9%(+3.29)#5,515 |
| 75. | Poplar | 8.0% | 5.3%(+2.71)#75 | 4.9%(+3.13)#5,654 |
| 76. | Bozeman | 7.9% | 5.3%(+2.63)#76 | 4.9%(+3.05)#5,742 |
| 77. | Sun Prairie | 7.9% | 5.3%(+2.57)#77 | 4.9%(+2.99)#5,796 |
| 78. | Clinton | 7.8% | 5.3%(+2.51)#78 | 4.9%(+2.93)#5,869 |
| 79. | Sheridan | 7.8% | 5.3%(+2.49)#79 | 4.9%(+2.91)#5,891 |
| 80. | Charlo | 7.7% | 5.3%(+2.40)#80 | 4.9%(+2.82)#5,996 |
| 81. | Dutton | 7.7% | 5.3%(+2.40)#81 | 4.9%(+2.82)#6,001 |
| 82. | Essex | 7.7% | 5.3%(+2.40)#82 | 4.9%(+2.82)#6,022 |
| 83. | Forsyth | 7.6% | 5.3%(+2.28)#83 | 4.9%(+2.70)#6,145 |
| 84. | Turah | 7.5% | 5.3%(+2.18)#84 | 4.9%(+2.60)#6,231 |
| 85. | Anaconda Deer Lodge County | 7.5% | 5.3%(+2.18)#85 | 4.9%(+2.60)#6,232 |
| 86. | Townsend | 7.2% | 5.3%(+1.90)#86 | 4.9%(+2.32)#6,587 |
| 87. | Woods Bay | 7.0% | 5.3%(+1.72)#87 | 4.9%(+2.14)#6,871 |
| 88. | Dixon | 7.0% | 5.3%(+1.68)#88 | 4.9%(+2.10)#6,912 |
| 89. | Stanford | 6.9% | 5.3%(+1.60)#89 | 4.9%(+2.02)#7,032 |
| 90. | Lakeside | 6.8% | 5.3%(+1.52)#90 | 4.9%(+1.94)#7,138 |
| 91. | Billings | 6.7% | 5.3%(+1.38)#91 | 4.9%(+1.80)#7,310 |
| 92. | Medicine Lake | 6.7% | 5.3%(+1.37)#92 | 4.9%(+1.79)#7,362 |
| 93. | Lewistown | 6.6% | 5.3%(+1.27)#93 | 4.9%(+1.69)#7,506 |
| 94. | Sylvanite | 6.5% | 5.3%(+1.16)#94 | 4.9%(+1.58)#7,678 |
| 95. | North Browning | 6.3% | 5.3%(+0.975)#95 | 4.9%(+1.39)#7,942 |
| 96. | Winifred | 6.2% | 5.3%(+0.958)#96 | 4.9%(+1.38)#7,999 |
| 97. | Bigfork | 6.2% | 5.3%(+0.881)#97 | 4.9%(+1.30)#8,114 |
| 98. | Cut Bank | 6.1% | 5.3%(+0.830)#98 | 4.9%(+1.25)#8,186 |
| 99. | Sidney | 6.1% | 5.3%(+0.808)#99 | 4.9%(+1.23)#8,216 |
| 100. | Hot Springs | 6.1% | 5.3%(+0.806)#100 | 4.9%(+1.23)#8,223 |
Common Questions
What are the Top 10 Cities with the Highest Percentage of Population with a Degree in Liberal Arts and History in Montana?
Top 10 Cities with the Highest Percentage of Population with a Degree in Liberal Arts and History in Montana are:
#1
100.0%
#2
60.6%
#3
51.6%
#4
50.0%
#5
50.0%
#6
50.0%
#7
50.0%
#8
38.9%
#9
36.7%
#10
36.7%
What city has the Highest Percentage of Population with a Degree in Liberal Arts and History in Montana?
Silesia has the Highest Percentage of Population with a Degree in Liberal Arts and History in Montana with 100.0%.
What is the Percentage of Population with a Degree in Liberal Arts and History in the State of Montana?
Percentage of Population with a Degree in Liberal Arts and History in Montana is 5.3%.
What is the Percentage of Population with a Degree in Liberal Arts and History in the United States?
Percentage of Population with a Degree in Liberal Arts and History in the United States is 4.9%.