Cities with the Highest Percentage of Population with a Degree in Liberal Arts and History in Indiana
RELATED REPORTS & OPTIONS
Liberal Arts and History
Indiana
Compare Cities
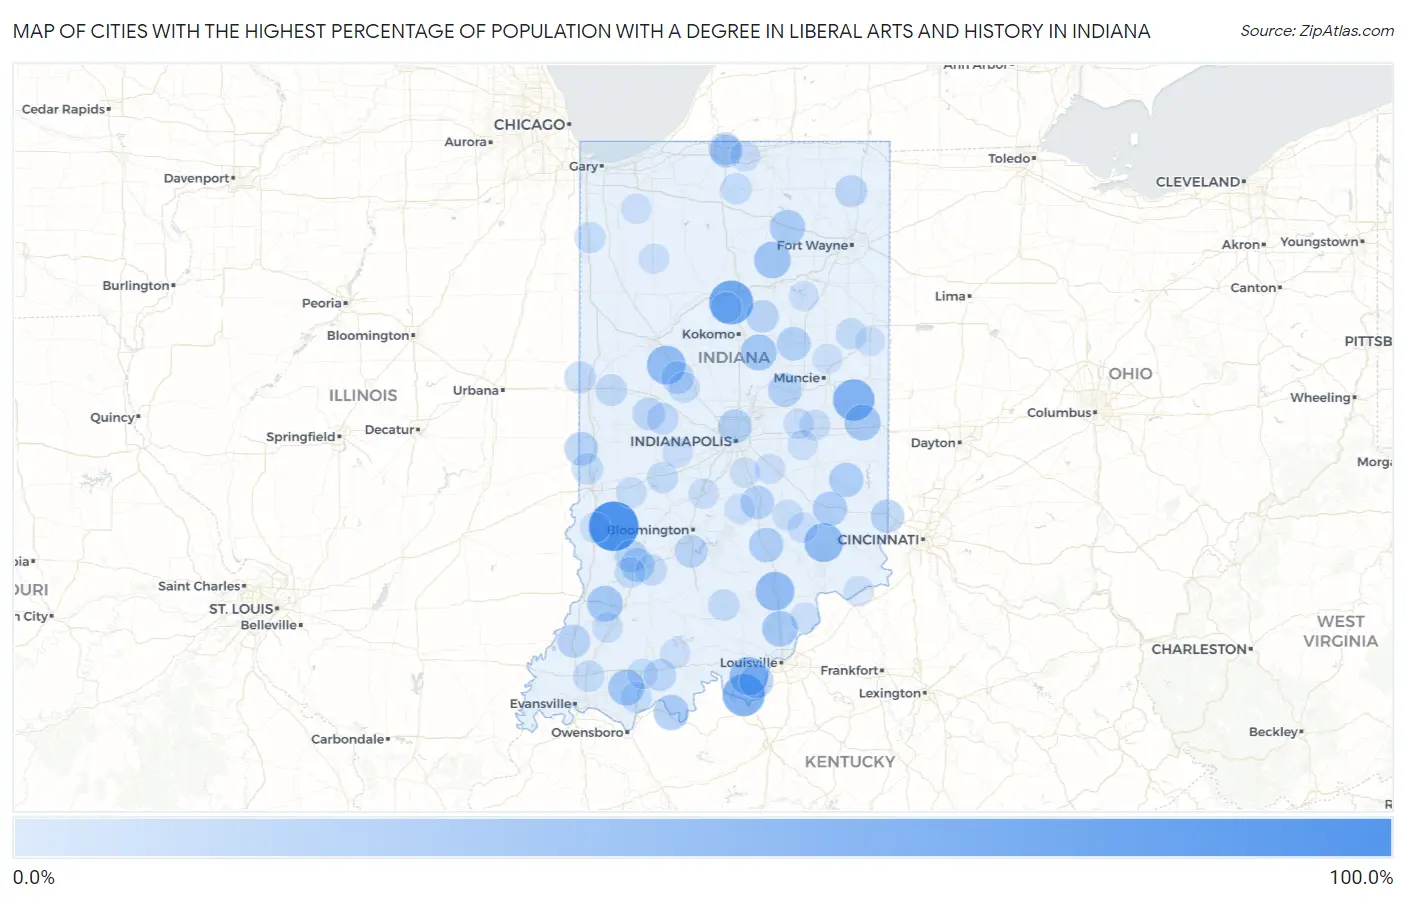
Map of Cities with the Highest Percentage of Population with a Degree in Liberal Arts and History in Indiana
0.0%
100.0%
Cities with the Highest Percentage of Population with a Degree in Liberal Arts and History in Indiana
| City | % Graduates | vs State | vs National | |
| 1. | Ontario | 100.0% | 5.8%(+94.2)#1 | 4.9%(+95.1)#10 |
| 2. | Walesboro | 100.0% | 5.8%(+94.2)#2 | 4.9%(+95.1)#18 |
| 3. | Coalmont | 100.0% | 5.8%(+94.2)#3 | 4.9%(+95.1)#21 |
| 4. | Stendal | 100.0% | 5.8%(+94.2)#4 | 4.9%(+95.1)#47 |
| 5. | Metz | 100.0% | 5.8%(+94.2)#5 | 4.9%(+95.1)#76 |
| 6. | Leopold | 100.0% | 5.8%(+94.2)#6 | 4.9%(+95.1)#84 |
| 7. | Onward | 75.0% | 5.8%(+69.2)#7 | 4.9%(+70.1)#119 |
| 8. | Laconia | 66.7% | 5.8%(+60.8)#8 | 4.9%(+61.8)#148 |
| 9. | Modoc | 63.6% | 5.8%(+57.8)#9 | 4.9%(+58.8)#153 |
| 10. | Oakville | 54.4% | 5.8%(+48.6)#10 | 4.9%(+49.5)#207 |
| 11. | Holton | 53.3% | 5.8%(+47.5)#11 | 4.9%(+48.5)#209 |
| 12. | Mace | 52.2% | 5.8%(+46.3)#12 | 4.9%(+47.3)#213 |
| 13. | Stockwell | 52.0% | 5.8%(+46.2)#13 | 4.9%(+47.1)#214 |
| 14. | Austin | 51.3% | 5.8%(+45.5)#14 | 4.9%(+46.5)#219 |
| 15. | Amity | 50.0% | 5.8%(+44.2)#15 | 4.9%(+45.1)#238 |
| 16. | Miami | 50.0% | 5.8%(+44.2)#16 | 4.9%(+45.1)#240 |
| 17. | Vicksburg | 50.0% | 5.8%(+44.2)#17 | 4.9%(+45.1)#256 |
| 18. | New Middletown | 50.0% | 5.8%(+44.2)#18 | 4.9%(+45.1)#263 |
| 19. | Pleasant Lake | 42.9% | 5.8%(+37.0)#19 | 4.9%(+38.0)#330 |
| 20. | Laketon | 42.9% | 5.8%(+37.0)#20 | 4.9%(+38.0)#333 |
| 21. | Deer Creek | 42.1% | 5.8%(+36.3)#21 | 4.9%(+37.2)#354 |
| 22. | Tennyson | 40.0% | 5.8%(+34.2)#22 | 4.9%(+35.1)#380 |
| 23. | Greens Fork | 39.6% | 5.8%(+33.8)#23 | 4.9%(+34.8)#391 |
| 24. | Windfall City | 39.6% | 5.8%(+33.8)#24 | 4.9%(+34.7)#392 |
| 25. | Gilmer Park | 39.2% | 5.8%(+33.4)#25 | 4.9%(+34.4)#395 |
| 26. | Memphis | 38.5% | 5.8%(+32.7)#26 | 4.9%(+33.7)#405 |
| 27. | Wheatland | 38.5% | 5.8%(+32.6)#27 | 4.9%(+33.6)#406 |
| 28. | Cannelton | 36.8% | 5.8%(+31.0)#28 | 4.9%(+31.9)#441 |
| 29. | Pierceton | 36.7% | 5.8%(+30.9)#29 | 4.9%(+31.8)#443 |
| 30. | Putnamville | 36.1% | 5.8%(+30.2)#30 | 4.9%(+31.2)#457 |
| 31. | Philadelphia | 34.8% | 5.8%(+29.0)#31 | 4.9%(+29.9)#490 |
| 32. | Laurel | 33.3% | 5.8%(+27.5)#32 | 4.9%(+28.5)#519 |
| 33. | New Point | 33.3% | 5.8%(+27.5)#33 | 4.9%(+28.5)#527 |
| 34. | Jonesville | 33.3% | 5.8%(+27.5)#34 | 4.9%(+28.5)#534 |
| 35. | Stanford | 32.4% | 5.8%(+26.5)#35 | 4.9%(+27.5)#586 |
| 36. | Elizabeth | 32.0% | 5.8%(+26.2)#36 | 4.9%(+27.1)#594 |
| 37. | Elizaville | 32.0% | 5.8%(+26.2)#37 | 4.9%(+27.1)#595 |
| 38. | Newberry | 30.8% | 5.8%(+24.9)#38 | 4.9%(+25.9)#633 |
| 39. | Fairmount | 30.4% | 5.8%(+24.6)#39 | 4.9%(+25.5)#645 |
| 40. | North Crows Nest | 30.2% | 5.8%(+24.4)#40 | 4.9%(+25.3)#652 |
| 41. | St Bernice | 30.0% | 5.8%(+24.2)#41 | 4.9%(+25.1)#653 |
| 42. | River Forest | 30.0% | 5.8%(+24.2)#42 | 4.9%(+25.1)#662 |
| 43. | Edinburgh | 29.0% | 5.8%(+23.2)#43 | 4.9%(+24.1)#696 |
| 44. | West Harrison | 28.6% | 5.8%(+22.7)#44 | 4.9%(+23.7)#710 |
| 45. | Hoffman Lake | 27.4% | 5.8%(+21.6)#45 | 4.9%(+22.5)#767 |
| 46. | Harrodsburg | 26.9% | 5.8%(+21.0)#46 | 4.9%(+22.0)#795 |
| 47. | Colfax | 26.7% | 5.8%(+20.8)#47 | 4.9%(+21.8)#803 |
| 48. | Patoka | 26.7% | 5.8%(+20.8)#48 | 4.9%(+21.8)#805 |
| 49. | Roseland | 26.0% | 5.8%(+20.2)#49 | 4.9%(+21.1)#845 |
| 50. | Notre Dame | 26.0% | 5.8%(+20.2)#50 | 4.9%(+21.1)#846 |
| 51. | Amboy | 25.9% | 5.8%(+20.1)#51 | 4.9%(+21.1)#852 |
| 52. | Lyons | 25.0% | 5.8%(+19.2)#52 | 4.9%(+20.1)#888 |
| 53. | New Market | 24.4% | 5.8%(+18.6)#53 | 4.9%(+19.6)#940 |
| 54. | St Meinrad | 24.1% | 5.8%(+18.2)#54 | 4.9%(+19.2)#960 |
| 55. | Corunna | 23.8% | 5.8%(+18.0)#55 | 4.9%(+18.9)#976 |
| 56. | Anoka | 23.1% | 5.8%(+17.3)#56 | 4.9%(+18.2)#1,027 |
| 57. | Chain-O-Lakes | 22.9% | 5.8%(+17.0)#57 | 4.9%(+18.0)#1,040 |
| 58. | Oswego | 22.2% | 5.8%(+16.4)#58 | 4.9%(+17.4)#1,079 |
| 59. | Groverton | 22.2% | 5.8%(+16.4)#59 | 4.9%(+17.4)#1,089 |
| 60. | State Line City | 22.2% | 5.8%(+16.4)#60 | 4.9%(+17.4)#1,091 |
| 61. | Ladoga | 22.1% | 5.8%(+16.3)#61 | 4.9%(+17.3)#1,102 |
| 62. | Veedersburg | 21.4% | 5.8%(+15.6)#62 | 4.9%(+16.6)#1,147 |
| 63. | Campbellsburg | 20.8% | 5.8%(+15.0)#63 | 4.9%(+16.0)#1,201 |
| 64. | New Goshen | 20.8% | 5.8%(+15.0)#64 | 4.9%(+16.0)#1,202 |
| 65. | Elberfeld | 20.6% | 5.8%(+14.8)#65 | 4.9%(+15.7)#1,223 |
| 66. | Cloverdale | 20.3% | 5.8%(+14.5)#66 | 4.9%(+15.4)#1,250 |
| 67. | Chrisney | 20.0% | 5.8%(+14.2)#67 | 4.9%(+15.1)#1,275 |
| 68. | Crane | 20.0% | 5.8%(+14.2)#68 | 4.9%(+15.1)#1,283 |
| 69. | Bremen | 19.7% | 5.8%(+13.8)#69 | 4.9%(+14.8)#1,325 |
| 70. | Ardmore | 19.6% | 5.8%(+13.8)#70 | 4.9%(+14.7)#1,331 |
| 71. | Pennville | 19.2% | 5.8%(+13.4)#71 | 4.9%(+14.4)#1,365 |
| 72. | Lake Village | 19.2% | 5.8%(+13.4)#72 | 4.9%(+14.4)#1,367 |
| 73. | Thorntown | 19.2% | 5.8%(+13.4)#73 | 4.9%(+14.3)#1,374 |
| 74. | Pleasant View | 19.0% | 5.8%(+13.2)#74 | 4.9%(+14.1)#1,399 |
| 75. | Walton | 18.9% | 5.8%(+13.1)#75 | 4.9%(+14.0)#1,405 |
| 76. | Elnora | 18.8% | 5.8%(+12.9)#76 | 4.9%(+13.9)#1,423 |
| 77. | Prairieton | 18.6% | 5.8%(+12.8)#77 | 4.9%(+13.7)#1,439 |
| 78. | Hartsville | 18.2% | 5.8%(+12.4)#78 | 4.9%(+13.3)#1,487 |
| 79. | Greensboro | 18.2% | 5.8%(+12.4)#79 | 4.9%(+13.3)#1,497 |
| 80. | Center Point | 18.0% | 5.8%(+12.2)#80 | 4.9%(+13.2)#1,513 |
| 81. | Dale | 17.4% | 5.8%(+11.6)#81 | 4.9%(+12.5)#1,588 |
| 82. | Petersburg | 17.1% | 5.8%(+11.3)#82 | 4.9%(+12.2)#1,645 |
| 83. | Shelburn | 16.9% | 5.8%(+11.1)#83 | 4.9%(+12.1)#1,667 |
| 84. | Francesville | 16.8% | 5.8%(+11.0)#84 | 4.9%(+11.9)#1,684 |
| 85. | Wilkinson | 16.7% | 5.8%(+10.8)#85 | 4.9%(+11.8)#1,708 |
| 86. | Kouts | 16.5% | 5.8%(+10.7)#86 | 4.9%(+11.7)#1,768 |
| 87. | Osceola | 16.3% | 5.8%(+10.5)#87 | 4.9%(+11.5)#1,791 |
| 88. | Martinsville | 16.3% | 5.8%(+10.5)#88 | 4.9%(+11.4)#1,800 |
| 89. | Coatesville | 16.2% | 5.8%(+10.4)#89 | 4.9%(+11.3)#1,817 |
| 90. | Westport | 16.1% | 5.8%(+10.3)#90 | 4.9%(+11.3)#1,824 |
| 91. | Cordry Sweetwater Lakes | 15.9% | 5.8%(+10.0)#91 | 4.9%(+11.0)#1,880 |
| 92. | Vevay | 15.7% | 5.8%(+9.88)#92 | 4.9%(+10.8)#1,910 |
| 93. | Fairland | 15.6% | 5.8%(+9.80)#93 | 4.9%(+10.8)#1,919 |
| 94. | Whiteland | 15.4% | 5.8%(+9.60)#94 | 4.9%(+10.6)#1,958 |
| 95. | Birdseye | 15.4% | 5.8%(+9.56)#95 | 4.9%(+10.5)#1,975 |
| 96. | Mount Etna | 15.4% | 5.8%(+9.56)#96 | 4.9%(+10.5)#1,984 |
| 97. | Eaton | 15.1% | 5.8%(+9.27)#97 | 4.9%(+10.2)#2,030 |
| 98. | Portland | 15.1% | 5.8%(+9.23)#98 | 4.9%(+10.2)#2,037 |
| 99. | Carthage | 15.0% | 5.8%(+9.18)#99 | 4.9%(+10.1)#2,044 |
| 100. | New Washington | 14.9% | 5.8%(+9.07)#100 | 4.9%(+10.0)#2,068 |
Common Questions
What are the Top 10 Cities with the Highest Percentage of Population with a Degree in Liberal Arts and History in Indiana?
Top 10 Cities with the Highest Percentage of Population with a Degree in Liberal Arts and History in Indiana are:
What city has the Highest Percentage of Population with a Degree in Liberal Arts and History in Indiana?
Coalmont has the Highest Percentage of Population with a Degree in Liberal Arts and History in Indiana with 100.0%.
What is the Percentage of Population with a Degree in Liberal Arts and History in the State of Indiana?
Percentage of Population with a Degree in Liberal Arts and History in Indiana is 5.8%.
What is the Percentage of Population with a Degree in Liberal Arts and History in the United States?
Percentage of Population with a Degree in Liberal Arts and History in the United States is 4.9%.