Cities with the Highest Percentage of Population with a Degree in Liberal Arts and History in Nevada
RELATED REPORTS & OPTIONS
Liberal Arts and History
Nevada
Compare Cities
Map of Cities with the Highest Percentage of Population with a Degree in Liberal Arts and History in Nevada
0.0%
40.0%
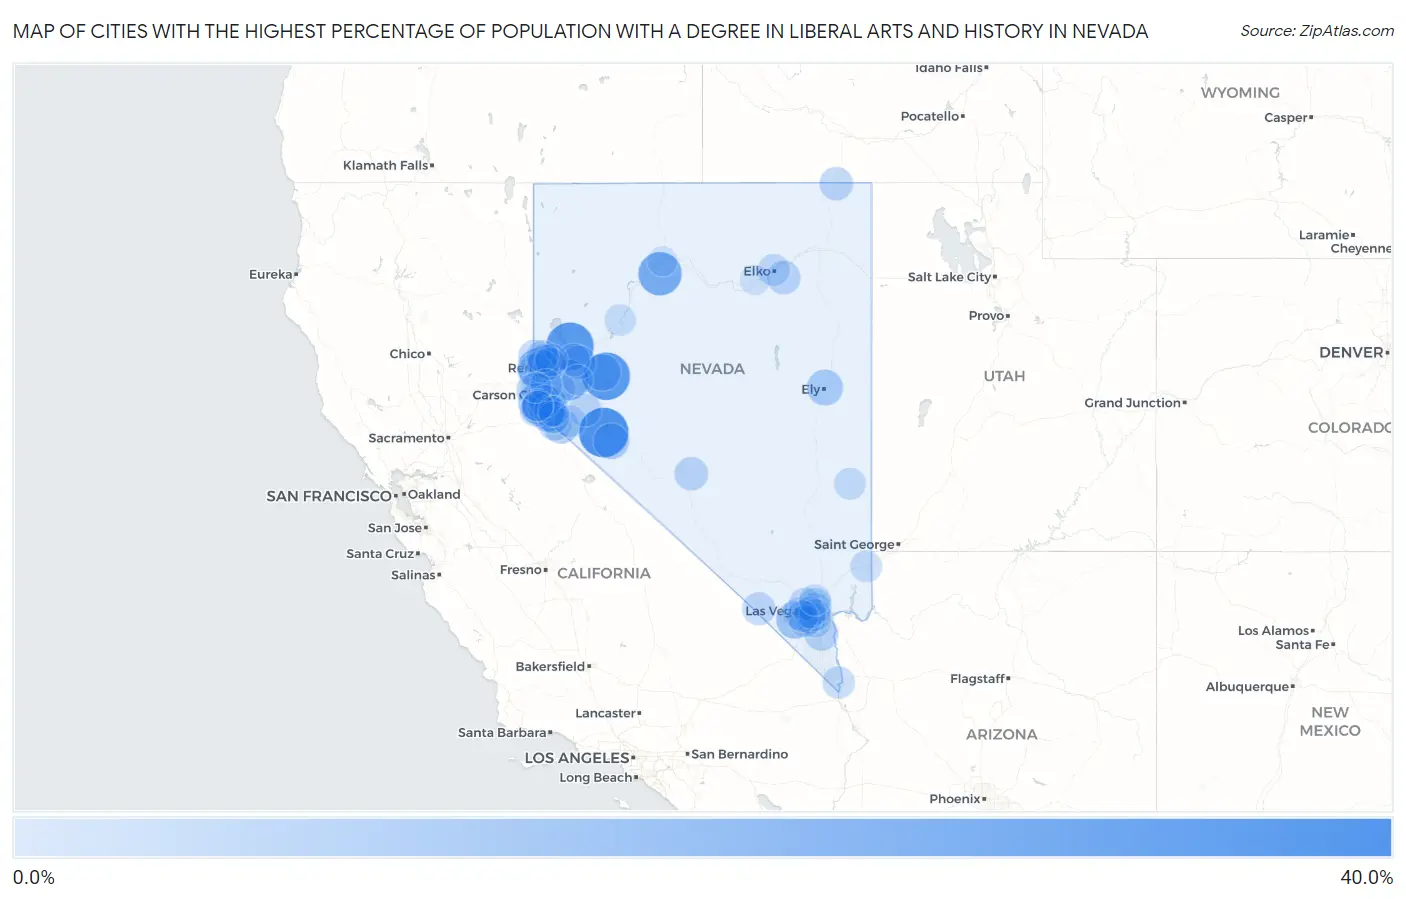
Cities with the Highest Percentage of Population with a Degree in Liberal Arts and History in Nevada
| City | % Graduates | vs State | vs National | |
| 1. | Walker Lake | 35.0% | 3.8%(+31.2)#1 | 4.9%(+30.1)#482 |
| 2. | Fallon Station | 31.2% | 3.8%(+27.4)#2 | 4.9%(+26.4)#615 |
| 3. | Nixon | 31.2% | 3.8%(+27.4)#3 | 4.9%(+26.4)#618 |
| 4. | Grass Valley | 23.7% | 3.8%(+19.8)#4 | 4.9%(+18.8)#981 |
| 5. | Stagecoach | 18.6% | 3.8%(+14.7)#5 | 4.9%(+13.7)#1,446 |
| 6. | Mogul | 17.9% | 3.8%(+14.0)#6 | 4.9%(+13.0)#1,530 |
| 7. | Logan Creek | 14.3% | 3.8%(+10.4)#7 | 4.9%(+9.41)#2,256 |
| 8. | Blue Diamond | 12.5% | 3.8%(+8.65)#8 | 4.9%(+7.63)#2,782 |
| 9. | Fallon | 11.6% | 3.8%(+7.71)#9 | 4.9%(+6.69)#3,161 |
| 10. | Johnson Lane | 10.7% | 3.8%(+6.80)#10 | 4.9%(+5.78)#3,602 |
| 11. | Kingsbury | 10.5% | 3.8%(+6.68)#11 | 4.9%(+5.66)#3,675 |
| 12. | Minden | 10.3% | 3.8%(+6.45)#12 | 4.9%(+5.43)#3,812 |
| 13. | Ely | 10.3% | 3.8%(+6.41)#13 | 4.9%(+5.38)#3,823 |
| 14. | Hawthorne | 10.0% | 3.8%(+6.18)#14 | 4.9%(+5.15)#3,956 |
| 15. | Ruhenstroth | 8.5% | 3.8%(+4.65)#15 | 4.9%(+3.63)#5,145 |
| 16. | Topaz Ranch Estates | 8.4% | 3.8%(+4.57)#16 | 4.9%(+3.55)#5,190 |
| 17. | Sun Valley | 8.4% | 3.8%(+4.56)#17 | 4.9%(+3.53)#5,199 |
| 18. | Crystal Bay | 7.8% | 3.8%(+3.94)#18 | 4.9%(+2.91)#5,883 |
| 19. | Fernley | 7.0% | 3.8%(+3.11)#19 | 4.9%(+2.09)#6,929 |
| 20. | Boulder City | 6.8% | 3.8%(+2.93)#20 | 4.9%(+1.91)#7,187 |
| 21. | Nellis Afb | 6.5% | 3.8%(+2.63)#21 | 4.9%(+1.60)#7,621 |
| 22. | Double Spring | 6.2% | 3.8%(+2.40)#22 | 4.9%(+1.38)#7,988 |
| 23. | Gardnerville Ranchos | 6.2% | 3.8%(+2.32)#23 | 4.9%(+1.30)#8,115 |
| 24. | Golden Valley | 6.0% | 3.8%(+2.19)#24 | 4.9%(+1.17)#8,335 |
| 25. | Spring Creek | 6.0% | 3.8%(+2.15)#25 | 4.9%(+1.12)#8,404 |
| 26. | Dayton | 5.9% | 3.8%(+2.04)#26 | 4.9%(+1.02)#8,572 |
| 27. | Jackpot | 5.8% | 3.8%(+1.92)#27 | 4.9%(+0.897)#8,834 |
| 28. | Tonopah | 5.7% | 3.8%(+1.89)#28 | 4.9%(+0.866)#8,890 |
| 29. | Carson | 5.5% | 3.8%(+1.70)#29 | 4.9%(+0.677)#9,279 |
| 30. | Cold Springs | 5.4% | 3.8%(+1.58)#30 | 4.9%(+0.559)#9,505 |
| 31. | Verdi | 5.3% | 3.8%(+1.45)#31 | 4.9%(+0.422)#9,770 |
| 32. | Round Hill Village | 5.2% | 3.8%(+1.40)#32 | 4.9%(+0.377)#9,896 |
| 33. | Yerington | 5.2% | 3.8%(+1.35)#33 | 4.9%(+0.323)#10,001 |
| 34. | Wadsworth | 5.0% | 3.8%(+1.15)#34 | 4.9%(+0.128)#10,399 |
| 35. | Stateline | 4.9% | 3.8%(+1.05)#35 | 4.9%(+0.030)#10,632 |
| 36. | Pahrump | 4.9% | 3.8%(+1.05)#36 | 4.9%(+0.024)#10,643 |
| 37. | Genoa | 4.5% | 3.8%(+0.639)#37 | 4.9%(-0.385)#11,578 |
| 38. | Reno | 4.4% | 3.8%(+0.587)#38 | 4.9%(-0.437)#11,705 |
| 39. | Indian Hills | 4.2% | 3.8%(+0.397)#39 | 4.9%(-0.627)#12,169 |
| 40. | Henderson | 4.1% | 3.8%(+0.206)#40 | 4.9%(-0.818)#12,603 |
| 41. | Paradise | 4.0% | 3.8%(+0.172)#41 | 4.9%(-0.852)#12,683 |
| 42. | Laughlin | 4.0% | 3.8%(+0.164)#42 | 4.9%(-0.860)#12,699 |
| 43. | Sparks | 4.0% | 3.8%(+0.164)#43 | 4.9%(-0.860)#12,700 |
| 44. | Summerlin South | 4.0% | 3.8%(+0.149)#44 | 4.9%(-0.875)#12,748 |
| 45. | Spanish Springs | 3.9% | 3.8%(+0.076)#45 | 4.9%(-0.948)#12,887 |
| 46. | Lemmon Valley | 3.8% | 3.8%(-0.057)#46 | 4.9%(-1.08)#13,239 |
| 47. | Sunrise Manor | 3.8% | 3.8%(-0.065)#47 | 4.9%(-1.09)#13,260 |
| 48. | Las Vegas | 3.8% | 3.8%(-0.074)#48 | 4.9%(-1.10)#13,276 |
| 49. | Whitney | 3.6% | 3.8%(-0.212)#49 | 4.9%(-1.24)#13,643 |
| 50. | Elko | 3.5% | 3.8%(-0.341)#50 | 4.9%(-1.36)#13,948 |
| 51. | Smith Valley | 3.4% | 3.8%(-0.437)#51 | 4.9%(-1.46)#14,180 |
| 52. | Washoe Valley | 3.4% | 3.8%(-0.491)#52 | 4.9%(-1.52)#14,317 |
| 53. | East Valley | 3.3% | 3.8%(-0.537)#53 | 4.9%(-1.56)#14,439 |
| 54. | Carter Springs | 3.3% | 3.8%(-0.569)#54 | 4.9%(-1.59)#14,512 |
| 55. | Skyland | 3.2% | 3.8%(-0.674)#55 | 4.9%(-1.70)#14,754 |
| 56. | Enterprise | 3.0% | 3.8%(-0.821)#56 | 4.9%(-1.85)#15,124 |
| 57. | Winchester | 3.0% | 3.8%(-0.838)#57 | 4.9%(-1.86)#15,151 |
| 58. | Mesquite | 2.9% | 3.8%(-0.986)#58 | 4.9%(-2.01)#15,466 |
| 59. | Pioche | 2.9% | 3.8%(-0.991)#59 | 4.9%(-2.02)#15,480 |
| 60. | Spring Valley | 2.8% | 3.8%(-1.09)#60 | 4.9%(-2.12)#15,697 |
| 61. | North Las Vegas | 2.4% | 3.8%(-1.43)#61 | 4.9%(-2.45)#16,400 |
| 62. | Lovelock | 2.1% | 3.8%(-1.72)#62 | 4.9%(-2.74)#16,983 |
| 63. | Zephyr Cove | 1.5% | 3.8%(-2.33)#63 | 4.9%(-3.36)#18,041 |
| 64. | Silver Springs | 1.4% | 3.8%(-2.49)#64 | 4.9%(-3.52)#18,266 |
| 65. | Incline Village | 1.3% | 3.8%(-2.54)#65 | 4.9%(-3.56)#18,325 |
| 66. | Fish Springs | 1.1% | 3.8%(-2.78)#66 | 4.9%(-3.81)#18,614 |
| 67. | Carlin | 0.48% | 3.8%(-3.37)#67 | 4.9%(-4.40)#19,059 |
| 68. | Winnemucca | 0.22% | 3.8%(-3.63)#68 | 4.9%(-4.65)#19,140 |
1
2Common Questions
What are the Top 10 Cities with the Highest Percentage of Population with a Degree in Liberal Arts and History in Nevada?
Top 10 Cities with the Highest Percentage of Population with a Degree in Liberal Arts and History in Nevada are:
#1
35.0%
#2
31.2%
#3
31.2%
#4
23.7%
#5
18.6%
#6
17.9%
#7
14.3%
#8
12.5%
#9
11.6%
#10
10.7%
What city has the Highest Percentage of Population with a Degree in Liberal Arts and History in Nevada?
Walker Lake has the Highest Percentage of Population with a Degree in Liberal Arts and History in Nevada with 35.0%.
What is the Percentage of Population with a Degree in Liberal Arts and History in the State of Nevada?
Percentage of Population with a Degree in Liberal Arts and History in Nevada is 3.8%.
What is the Percentage of Population with a Degree in Liberal Arts and History in the United States?
Percentage of Population with a Degree in Liberal Arts and History in the United States is 4.9%.