Strathmore, CA Map & Demographics
Strathmore Map
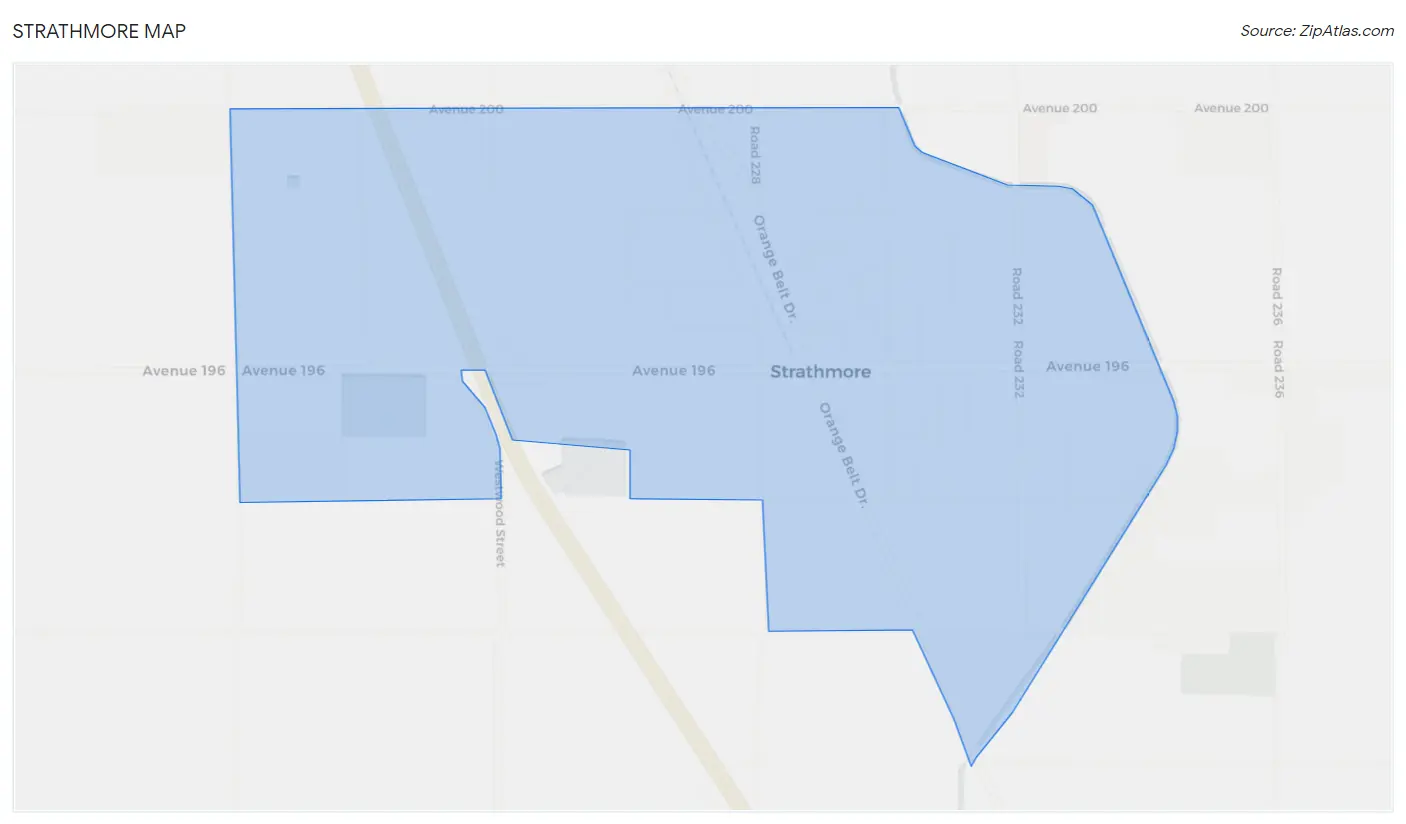
Strathmore Overview
$12,040
PER CAPITA INCOME
$40,851
AVG FAMILY INCOME
$40,106
AVG HOUSEHOLD INCOME
0.44
INEQUALITY / GINI INDEX
2,993
TOTAL POPULATION
1,509
MALE POPULATION
1,484
FEMALE POPULATION
101.68
MALES / 100 FEMALES
98.34
FEMALES / 100 MALES
36.2
MEDIAN AGE
4.2
AVG FAMILY SIZE
3.9
AVG HOUSEHOLD SIZE
631
LABOR FORCE [ PEOPLE ]
30.8%
PERCENT IN LABOR FORCE
15.2%
UNEMPLOYMENT RATE
Strathmore Zip Codes
Strathmore Area Codes
Income in Strathmore
Income Overview in Strathmore
Per Capita Income in Strathmore is $12,040, while median incomes of families and households are $40,851 and $40,106 respectively.
| Characteristic | Number | Measure |
| Per Capita Income | 2,993 | $12,040 |
| Median Family Income | 690 | $40,851 |
| Mean Family Income | 690 | $49,671 |
| Median Household Income | 774 | $40,106 |
| Mean Household Income | 774 | $46,092 |
| Income Deficit | 690 | $0 |
| Wage / Income Gap (%) | 2,993 | 0.00% |
| Wage / Income Gap ($) | 2,993 | 100.00¢ per $1 |
| Gini / Inequality Index | 2,993 | 0.44 |
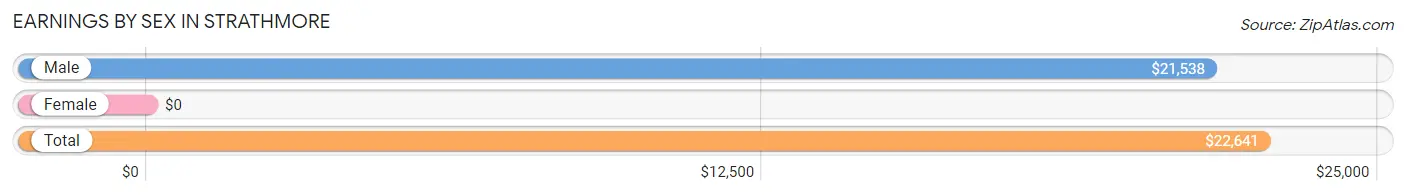
Earnings by Sex in Strathmore
| Sex | Number | Average Earnings |
| Male | 546 (62.1%) | $21,538 |
| Female | 333 (37.9%) | $0 |
| Total | 879 (100.0%) | $22,641 |
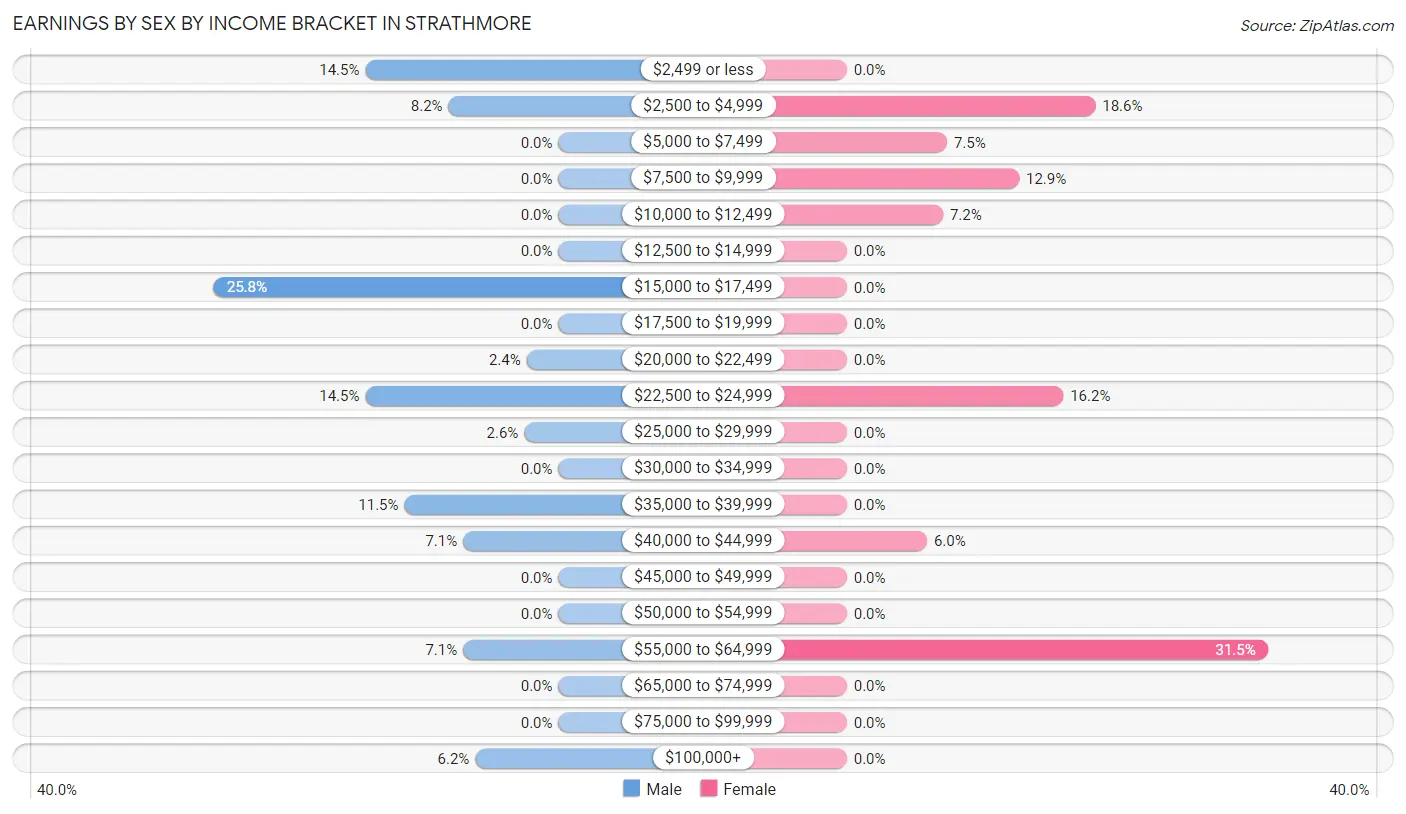
Earnings by Sex by Income Bracket in Strathmore
The most common earnings brackets in Strathmore are $15,000 to $17,499 for men (141 | 25.8%) and $55,000 to $64,999 for women (105 | 31.5%).
| Income | Male | Female |
| $2,499 or less | 79 (14.5%) | 0 (0.0%) |
| $2,500 to $4,999 | 45 (8.2%) | 62 (18.6%) |
| $5,000 to $7,499 | 0 (0.0%) | 25 (7.5%) |
| $7,500 to $9,999 | 0 (0.0%) | 43 (12.9%) |
| $10,000 to $12,499 | 0 (0.0%) | 24 (7.2%) |
| $12,500 to $14,999 | 0 (0.0%) | 0 (0.0%) |
| $15,000 to $17,499 | 141 (25.8%) | 0 (0.0%) |
| $17,500 to $19,999 | 0 (0.0%) | 0 (0.0%) |
| $20,000 to $22,499 | 13 (2.4%) | 0 (0.0%) |
| $22,500 to $24,999 | 79 (14.5%) | 54 (16.2%) |
| $25,000 to $29,999 | 14 (2.6%) | 0 (0.0%) |
| $30,000 to $34,999 | 0 (0.0%) | 0 (0.0%) |
| $35,000 to $39,999 | 63 (11.5%) | 0 (0.0%) |
| $40,000 to $44,999 | 39 (7.1%) | 20 (6.0%) |
| $45,000 to $49,999 | 0 (0.0%) | 0 (0.0%) |
| $50,000 to $54,999 | 0 (0.0%) | 0 (0.0%) |
| $55,000 to $64,999 | 39 (7.1%) | 105 (31.5%) |
| $65,000 to $74,999 | 0 (0.0%) | 0 (0.0%) |
| $75,000 to $99,999 | 0 (0.0%) | 0 (0.0%) |
| $100,000+ | 34 (6.2%) | 0 (0.0%) |
| Total | 546 (100.0%) | 333 (100.0%) |
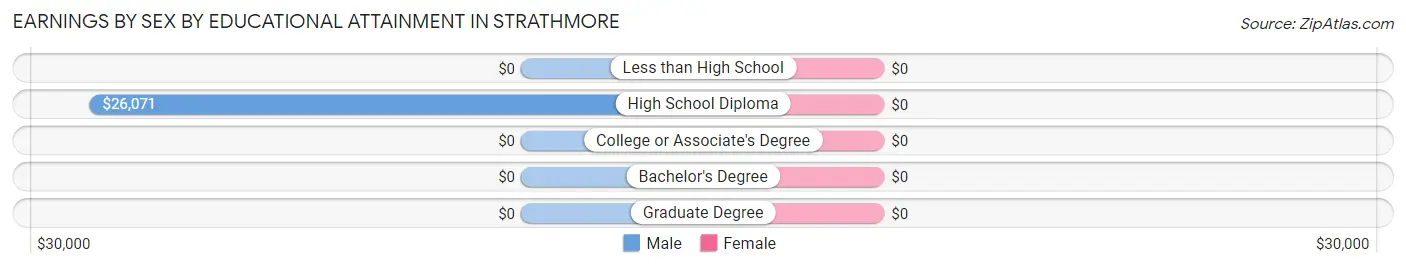
Earnings by Sex by Educational Attainment in Strathmore
| Educational Attainment | Male Income | Female Income |
| Less than High School | - | - |
| High School Diploma | $26,071 | $0 |
| College or Associate's Degree | - | - |
| Bachelor's Degree | - | - |
| Graduate Degree | - | - |
| Total | $23,592 | $0 |
Family Income in Strathmore
Family Income Brackets in Strathmore
According to the Strathmore family income data, there are 289 families falling into the $35,000 to $49,999 income range, which is the most common income bracket and makes up 41.9% of all families.
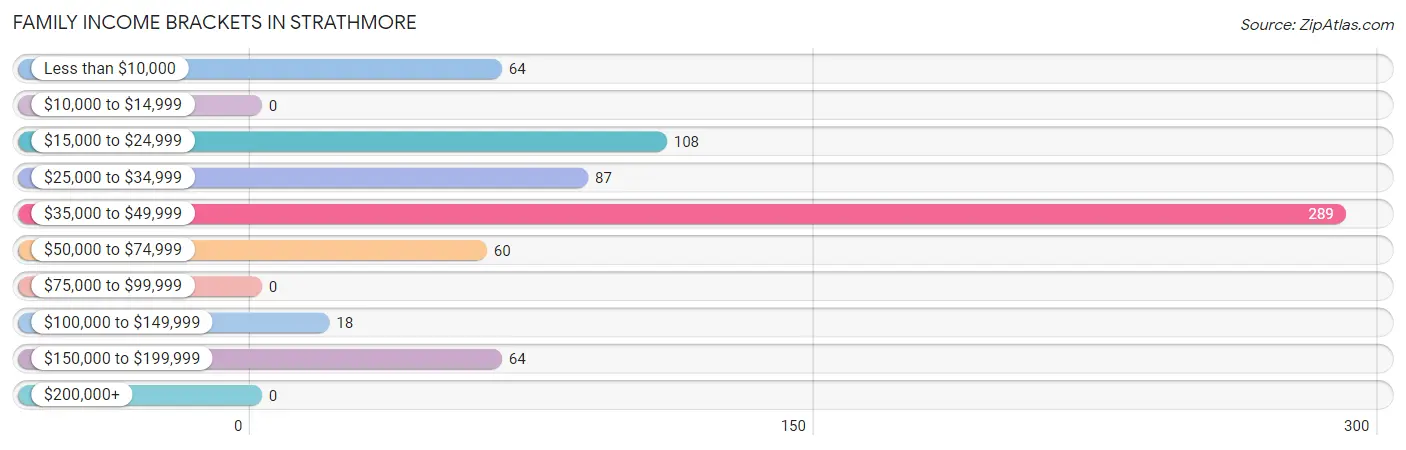
| Income Bracket | # Families | % Families |
| Less than $10,000 | 64 | 9.3% |
| $10,000 to $14,999 | 0 | 0.0% |
| $15,000 to $24,999 | 108 | 15.7% |
| $25,000 to $34,999 | 87 | 12.6% |
| $35,000 to $49,999 | 289 | 41.9% |
| $50,000 to $74,999 | 60 | 8.7% |
| $75,000 to $99,999 | 0 | 0.0% |
| $100,000 to $149,999 | 18 | 2.6% |
| $150,000 to $199,999 | 64 | 9.3% |
| $200,000+ | 0 | 0.0% |
Family Income by Famaliy Size in Strathmore
3-person families (220 | 31.9%) account for the highest median family income in Strathmore with $44,103 per family, while 3-person families (220 | 31.9%) have the highest median income of $14,701 per family member.
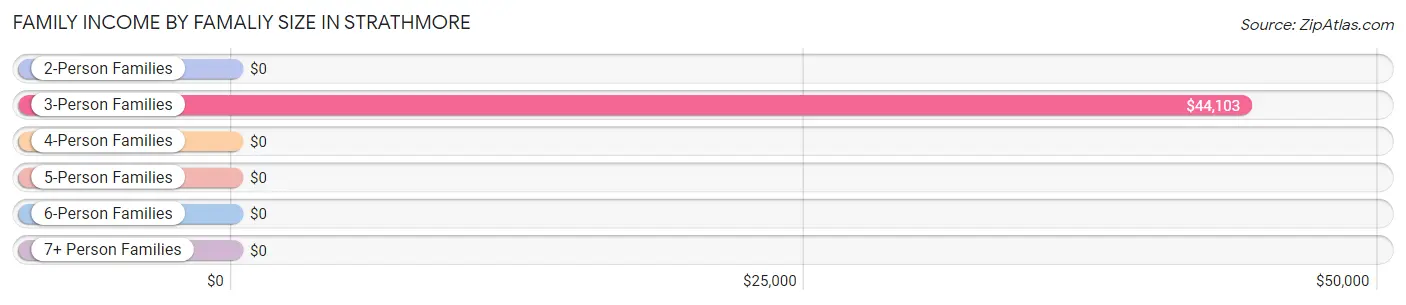
| Income Bracket | # Families | Median Income |
| 2-Person Families | 56 (8.1%) | $0 |
| 3-Person Families | 220 (31.9%) | $44,103 |
| 4-Person Families | 221 (32.0%) | $0 |
| 5-Person Families | 21 (3.0%) | $0 |
| 6-Person Families | 172 (24.9%) | $0 |
| 7+ Person Families | 0 (0.0%) | $0 |
| Total | 690 (100.0%) | $40,851 |
Family Income by Number of Earners in Strathmore
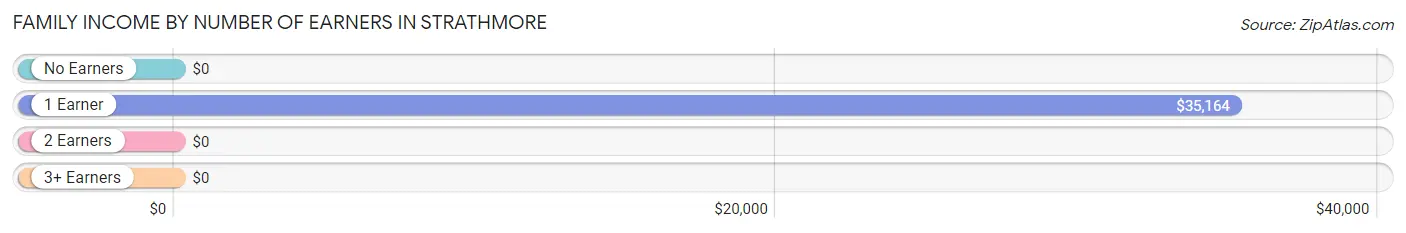
| Number of Earners | # Families | Median Income |
| No Earners | 141 (20.4%) | $0 |
| 1 Earner | 377 (54.6%) | $35,164 |
| 2 Earners | 104 (15.1%) | $0 |
| 3+ Earners | 68 (9.9%) | $0 |
| Total | 690 (100.0%) | $40,851 |
Household Income in Strathmore
Household Income Brackets in Strathmore
With 289 households falling in the category, the $35,000 to $49,999 income range is the most frequent in Strathmore, accounting for 37.3% of all households.
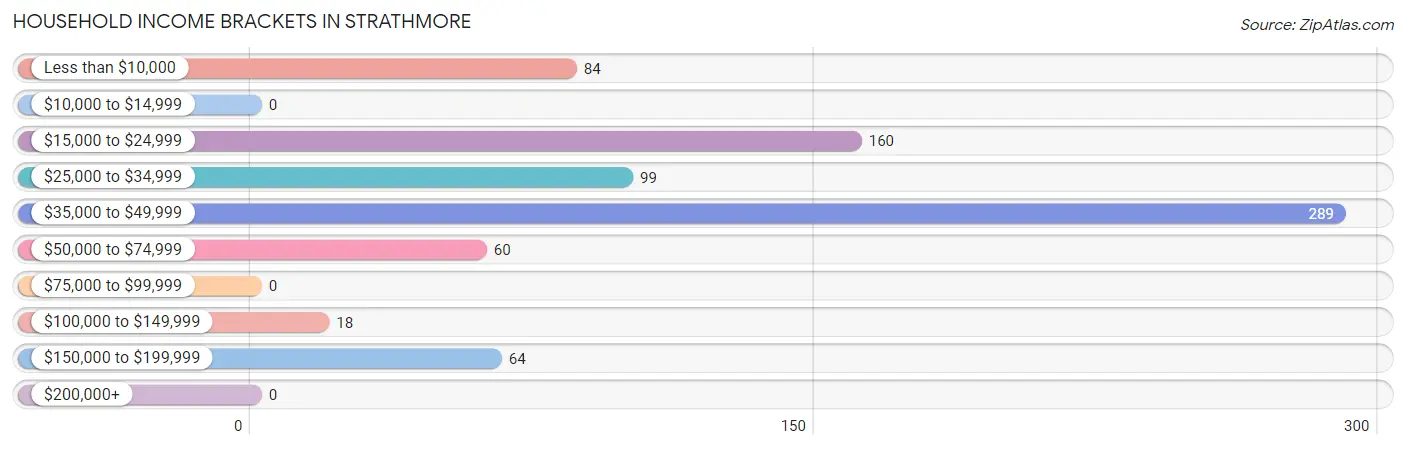
| Income Bracket | # Households | % Households |
| Less than $10,000 | 84 | 10.9% |
| $10,000 to $14,999 | 0 | 0.0% |
| $15,000 to $24,999 | 160 | 20.7% |
| $25,000 to $34,999 | 99 | 12.8% |
| $35,000 to $49,999 | 289 | 37.3% |
| $50,000 to $74,999 | 60 | 7.8% |
| $75,000 to $99,999 | 0 | 0.0% |
| $100,000 to $149,999 | 18 | 2.3% |
| $150,000 to $199,999 | 64 | 8.3% |
| $200,000+ | 0 | 0.0% |
Household Income by Householder Age in Strathmore
The median household income in Strathmore is $40,106, with the highest median household income of $48,574 found in the 65+ years age bracket for the primary householder. A total of 167 households (21.6%) fall into this category.
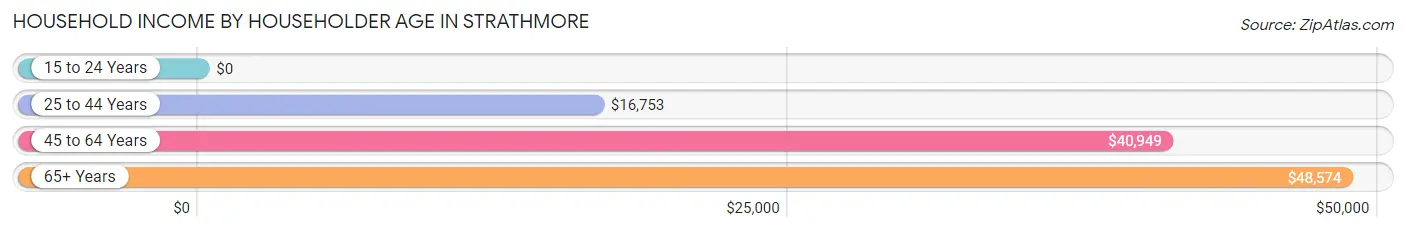
| Income Bracket | # Households | Median Income |
| 15 to 24 Years | 0 (0.0%) | $0 |
| 25 to 44 Years | 226 (29.2%) | $16,753 |
| 45 to 64 Years | 381 (49.2%) | $40,949 |
| 65+ Years | 167 (21.6%) | $48,574 |
| Total | 774 (100.0%) | $40,106 |
Poverty in Strathmore
Income Below Poverty by Sex and Age in Strathmore
With 21.9% poverty level for males and 33.4% for females among the residents of Strathmore, under 5 year old males and under 5 year old females are the most vulnerable to poverty, with 25 males (100.0%) and 132 females (100.0%) in their respective age groups living below the poverty level.
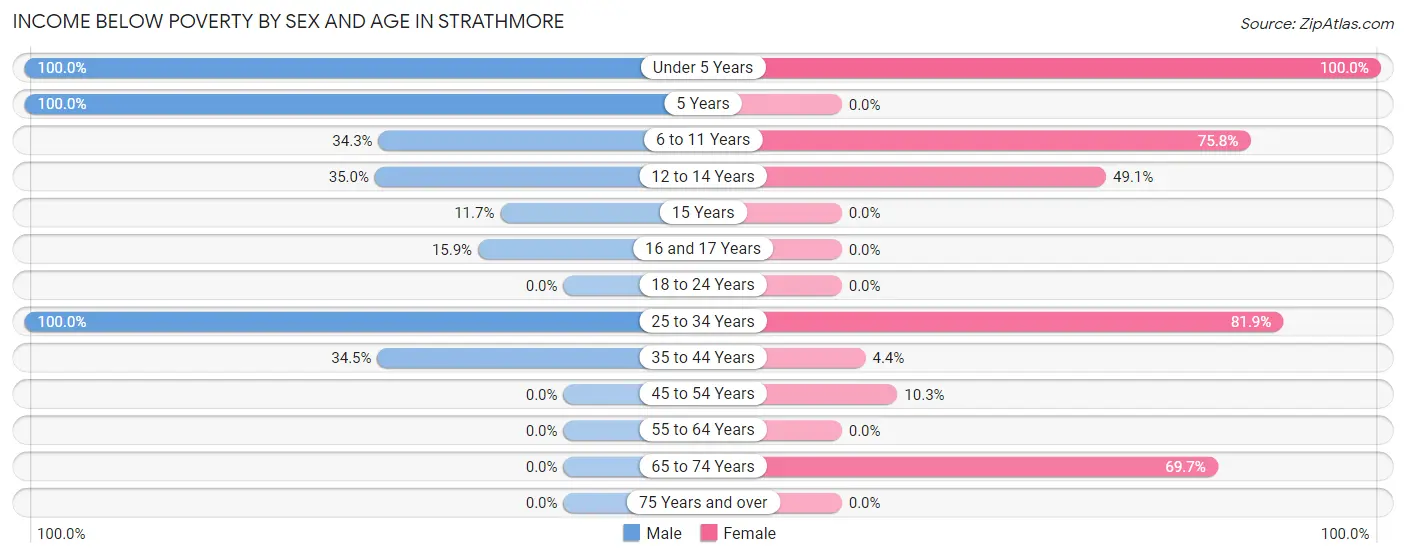
| Age Bracket | Male | Female |
| Under 5 Years | 25 (100.0%) | 132 (100.0%) |
| 5 Years | 24 (100.0%) | 0 (0.0%) |
| 6 to 11 Years | 103 (34.3%) | 97 (75.8%) |
| 12 to 14 Years | 21 (35.0%) | 26 (49.1%) |
| 15 Years | 26 (11.7%) | 0 (0.0%) |
| 16 and 17 Years | 13 (15.9%) | 0 (0.0%) |
| 18 to 24 Years | 0 (0.0%) | 0 (0.0%) |
| 25 to 34 Years | 89 (100.0%) | 163 (81.9%) |
| 35 to 44 Years | 29 (34.5%) | 12 (4.4%) |
| 45 to 54 Years | 0 (0.0%) | 13 (10.3%) |
| 55 to 64 Years | 0 (0.0%) | 0 (0.0%) |
| 65 to 74 Years | 0 (0.0%) | 53 (69.7%) |
| 75 Years and over | 0 (0.0%) | 0 (0.0%) |
| Total | 330 (21.9%) | 496 (33.4%) |
Income Above Poverty by Sex and Age in Strathmore
According to the poverty statistics in Strathmore, males aged 18 to 24 years and females aged 16 and 17 years are the age groups that are most secure financially, with 100.0% of males and 100.0% of females in these age groups living above the poverty line.
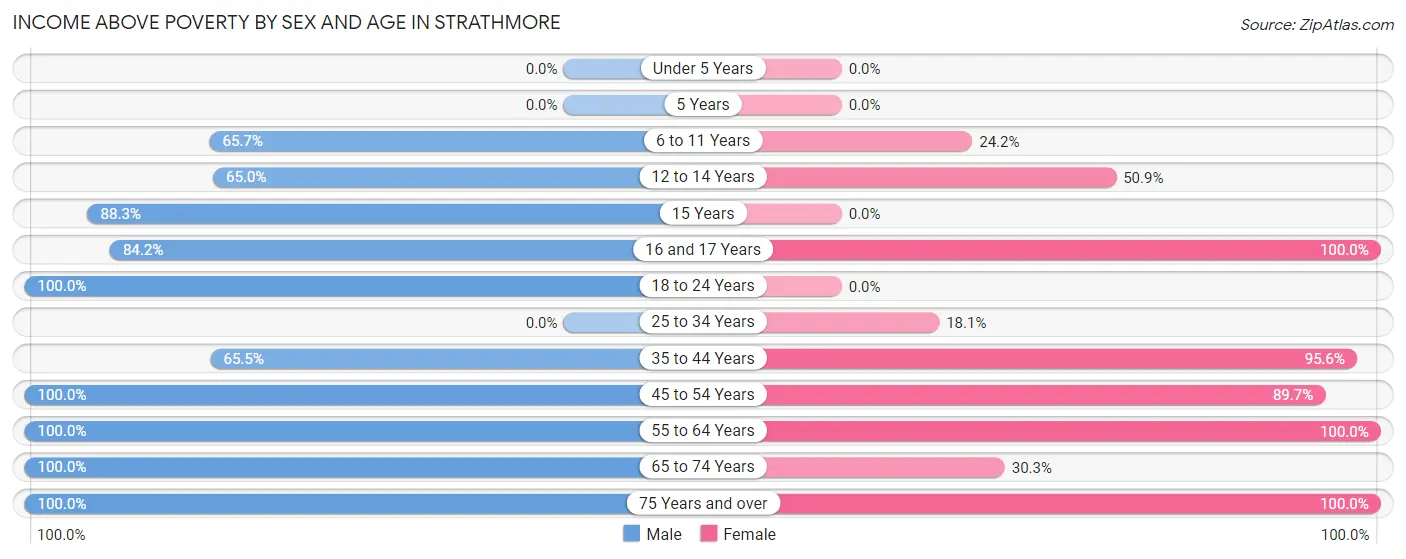
| Age Bracket | Male | Female |
| Under 5 Years | 0 (0.0%) | 0 (0.0%) |
| 5 Years | 0 (0.0%) | 0 (0.0%) |
| 6 to 11 Years | 197 (65.7%) | 31 (24.2%) |
| 12 to 14 Years | 39 (65.0%) | 27 (50.9%) |
| 15 Years | 196 (88.3%) | 0 (0.0%) |
| 16 and 17 Years | 69 (84.2%) | 121 (100.0%) |
| 18 to 24 Years | 29 (100.0%) | 0 (0.0%) |
| 25 to 34 Years | 0 (0.0%) | 36 (18.1%) |
| 35 to 44 Years | 55 (65.5%) | 260 (95.6%) |
| 45 to 54 Years | 125 (100.0%) | 113 (89.7%) |
| 55 to 64 Years | 373 (100.0%) | 327 (100.0%) |
| 65 to 74 Years | 25 (100.0%) | 23 (30.3%) |
| 75 Years and over | 71 (100.0%) | 50 (100.0%) |
| Total | 1,179 (78.1%) | 988 (66.6%) |
Income Below Poverty Among Married-Couple Families in Strathmore
The poverty statistics for married-couple families in Strathmore show that 22.2% or 101 of the total 455 families live below the poverty line. Families with 1 or 2 children have the highest poverty rate of 61.2%, comprising of 101 families. On the other hand, families with no children have the lowest poverty rate of 0.0%, which includes 0 families.
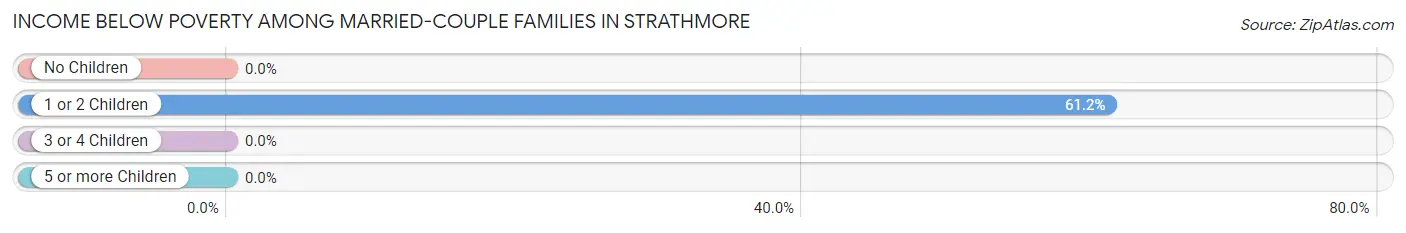
| Children | Above Poverty | Below Poverty |
| No Children | 149 (100.0%) | 0 (0.0%) |
| 1 or 2 Children | 64 (38.8%) | 101 (61.2%) |
| 3 or 4 Children | 141 (100.0%) | 0 (0.0%) |
| 5 or more Children | 0 (0.0%) | 0 (0.0%) |
| Total | 354 (77.8%) | 101 (22.2%) |
Income Below Poverty Among Single-Parent Households in Strathmore
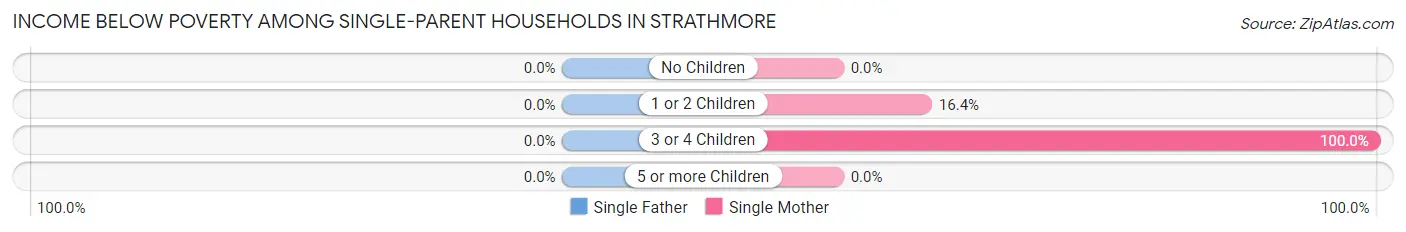
| Children | Single Father | Single Mother |
| No Children | 0 (0.0%) | 0 (0.0%) |
| 1 or 2 Children | 0 (0.0%) | 12 (16.4%) |
| 3 or 4 Children | 0 (0.0%) | 73 (100.0%) |
| 5 or more Children | 0 (0.0%) | 0 (0.0%) |
| Total | 0 (0.0%) | 85 (51.8%) |
Income Below Poverty Among Married-Couple vs Single-Parent Households in Strathmore
The poverty data for Strathmore shows that 101 of the married-couple family households (22.2%) and 85 of the single-parent households (36.2%) are living below the poverty level. Within the married-couple family households, those with 1 or 2 children have the highest poverty rate, with 101 households (61.2%) falling below the poverty line. Among the single-parent households, those with 3 or 4 children have the highest poverty rate, with 73 household (100.0%) living below poverty.
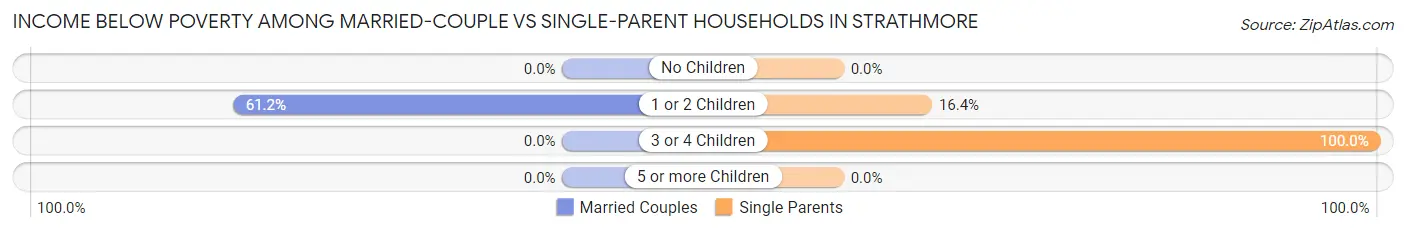
| Children | Married-Couple Families | Single-Parent Households |
| No Children | 0 (0.0%) | 0 (0.0%) |
| 1 or 2 Children | 101 (61.2%) | 12 (16.4%) |
| 3 or 4 Children | 0 (0.0%) | 73 (100.0%) |
| 5 or more Children | 0 (0.0%) | 0 (0.0%) |
| Total | 101 (22.2%) | 85 (36.2%) |
Race in Strathmore
The most populous races in Strathmore are Hispanic or Latino (2,537 | 84.8%), White / Caucasian (2,007 | 67.1%), and Some other Race (843 | 28.2%).
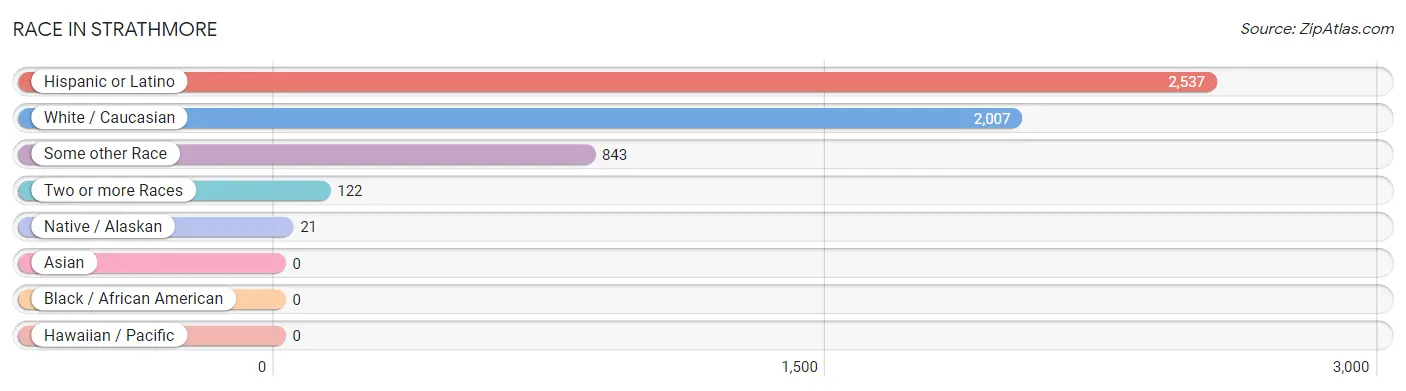
| Race | # Population | % Population |
| Asian | 0 | 0.0% |
| Black / African American | 0 | 0.0% |
| Hawaiian / Pacific | 0 | 0.0% |
| Hispanic or Latino | 2,537 | 84.8% |
| Native / Alaskan | 21 | 0.7% |
| White / Caucasian | 2,007 | 67.1% |
| Two or more Races | 122 | 4.1% |
| Some other Race | 843 | 28.2% |
| Total | 2,993 | 100.0% |
Ancestry in Strathmore
The most populous ancestries reported in Strathmore are Mexican (2,495 | 83.4%), Irish (188 | 6.3%), American (135 | 4.5%), Central American (42 | 1.4%), and Salvadoran (42 | 1.4%), together accounting for 97.0% of all Strathmore residents.
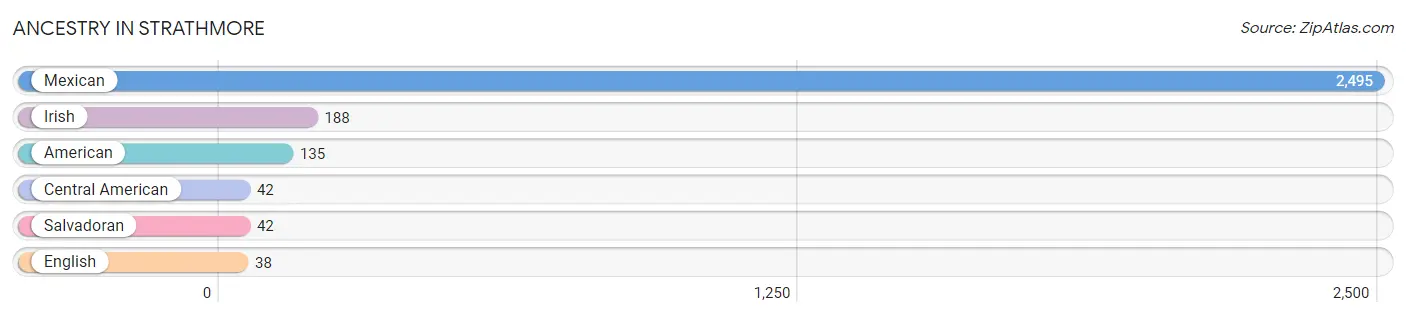
| Ancestry | # Population | % Population |
| American | 135 | 4.5% |
| Central American | 42 | 1.4% |
| English | 38 | 1.3% |
| Irish | 188 | 6.3% |
| Mexican | 2,495 | 83.4% |
| Salvadoran | 42 | 1.4% | View All 6 Rows |
Immigrants in Strathmore
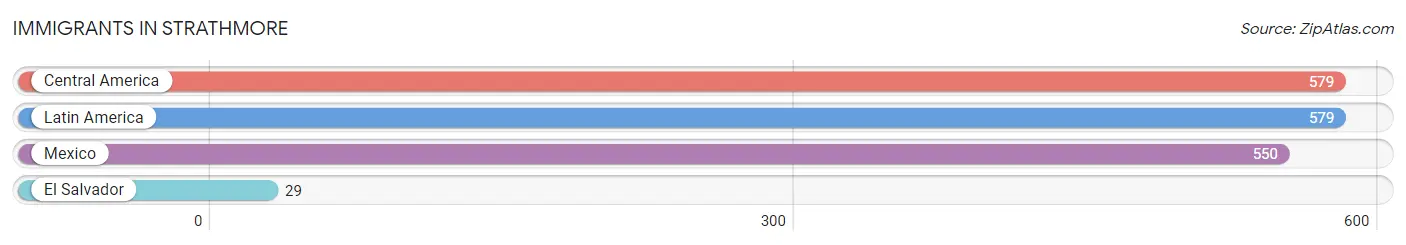
The most numerous immigrant groups reported in Strathmore came from Central America (579 | 19.4%), Latin America (579 | 19.4%), Mexico (550 | 18.4%), and El Salvador (29 | 1.0%), together accounting for 58.1% of all Strathmore residents.
| Immigration Origin | # Population | % Population |
| Central America | 579 | 19.4% |
| El Salvador | 29 | 1.0% |
| Latin America | 579 | 19.4% |
| Mexico | 550 | 18.4% | View All 4 Rows |
Sex and Age in Strathmore
Sex and Age in Strathmore
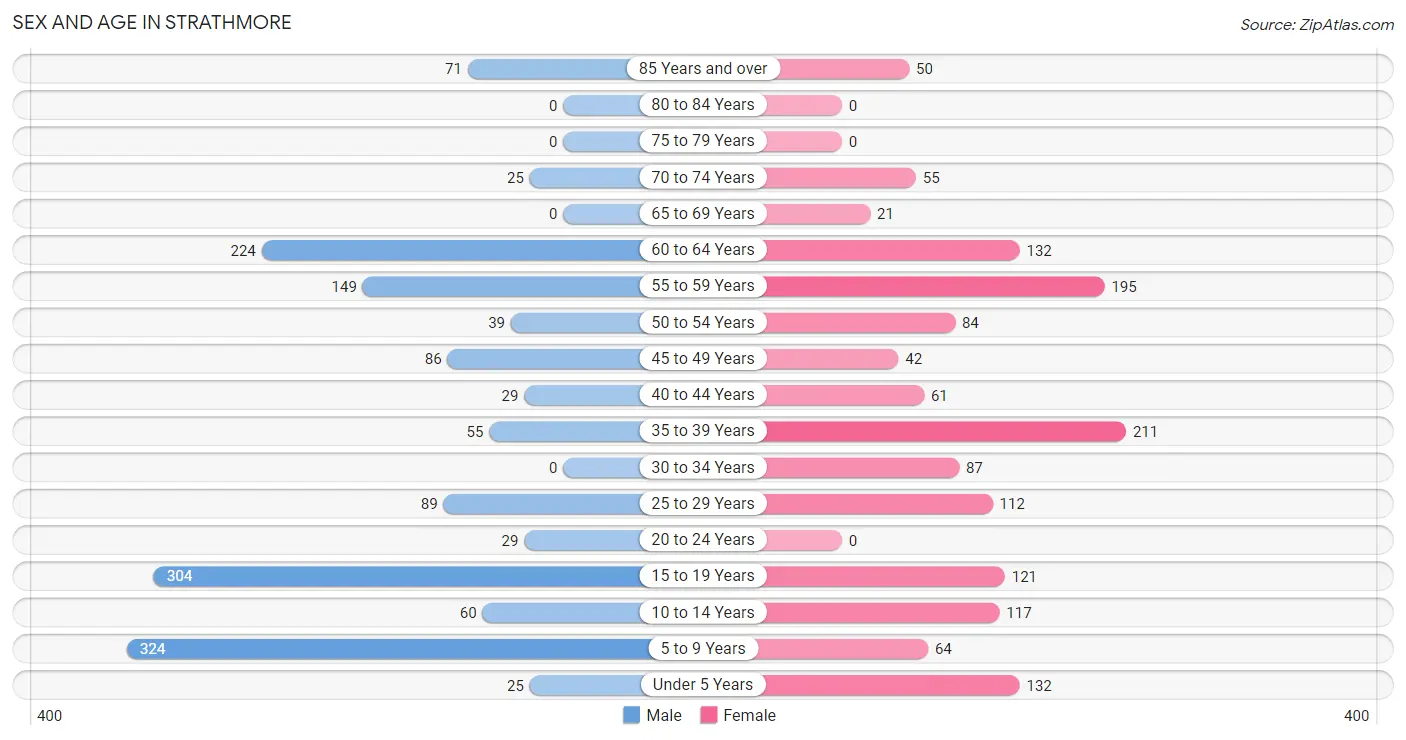
The most populous age groups in Strathmore are 5 to 9 Years (324 | 21.5%) for men and 35 to 39 Years (211 | 14.2%) for women.
| Age Bracket | Male | Female |
| Under 5 Years | 25 (1.7%) | 132 (8.9%) |
| 5 to 9 Years | 324 (21.5%) | 64 (4.3%) |
| 10 to 14 Years | 60 (4.0%) | 117 (7.9%) |
| 15 to 19 Years | 304 (20.2%) | 121 (8.2%) |
| 20 to 24 Years | 29 (1.9%) | 0 (0.0%) |
| 25 to 29 Years | 89 (5.9%) | 112 (7.5%) |
| 30 to 34 Years | 0 (0.0%) | 87 (5.9%) |
| 35 to 39 Years | 55 (3.6%) | 211 (14.2%) |
| 40 to 44 Years | 29 (1.9%) | 61 (4.1%) |
| 45 to 49 Years | 86 (5.7%) | 42 (2.8%) |
| 50 to 54 Years | 39 (2.6%) | 84 (5.7%) |
| 55 to 59 Years | 149 (9.9%) | 195 (13.1%) |
| 60 to 64 Years | 224 (14.8%) | 132 (8.9%) |
| 65 to 69 Years | 0 (0.0%) | 21 (1.4%) |
| 70 to 74 Years | 25 (1.7%) | 55 (3.7%) |
| 75 to 79 Years | 0 (0.0%) | 0 (0.0%) |
| 80 to 84 Years | 0 (0.0%) | 0 (0.0%) |
| 85 Years and over | 71 (4.7%) | 50 (3.4%) |
| Total | 1,509 (100.0%) | 1,484 (100.0%) |
Families and Households in Strathmore
Median Family Size in Strathmore
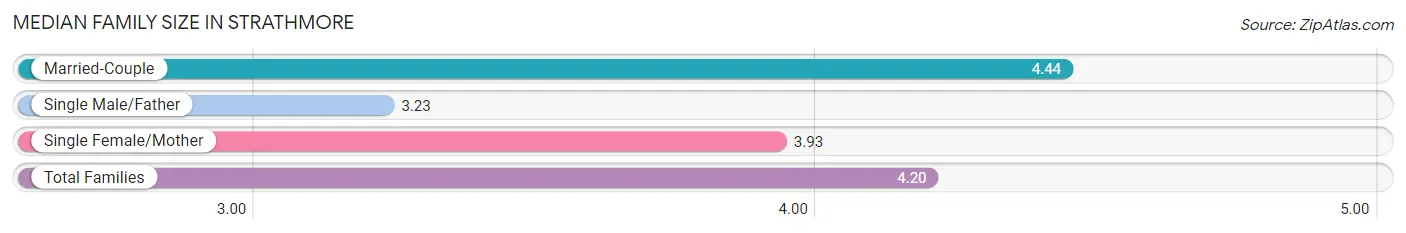
The median family size in Strathmore is 4.20 persons per family, with married-couple families (455 | 65.9%) accounting for the largest median family size of 4.44 persons per family. On the other hand, single male/father families (71 | 10.3%) represent the smallest median family size with 3.23 persons per family.
| Family Type | # Families | Family Size |
| Married-Couple | 455 (65.9%) | 4.44 |
| Single Male/Father | 71 (10.3%) | 3.23 |
| Single Female/Mother | 164 (23.8%) | 3.93 |
| Total Families | 690 (100.0%) | 4.20 |
Median Household Size in Strathmore
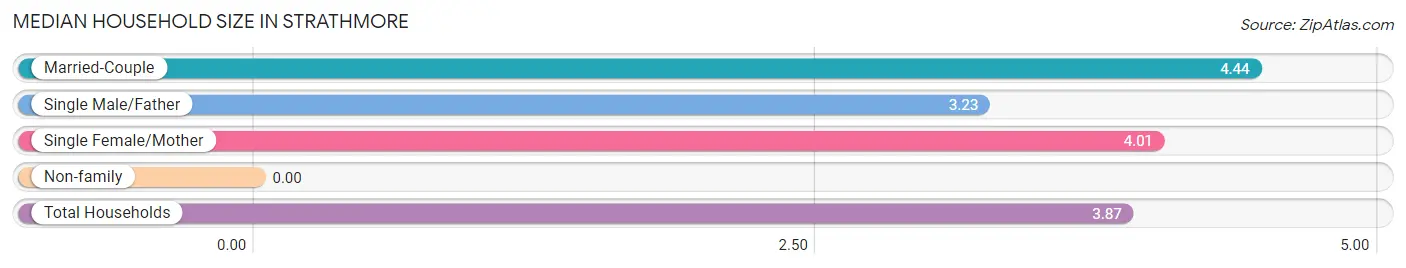
| Household Type | # Households | Household Size |
| Married-Couple | 455 (58.8%) | 4.44 |
| Single Male/Father | 71 (9.2%) | 3.23 |
| Single Female/Mother | 164 (21.2%) | 4.01 |
| Non-family | 84 (10.8%) | - |
| Total Households | 774 (100.0%) | 3.87 |
Household Size by Marriage Status in Strathmore
Out of a total of 774 households in Strathmore, 690 (89.1%) are family households, while 84 (10.8%) are nonfamily households. The most numerous type of family households are 4-person households, comprising 233, and the most common type of nonfamily households are 1-person households, comprising 84.
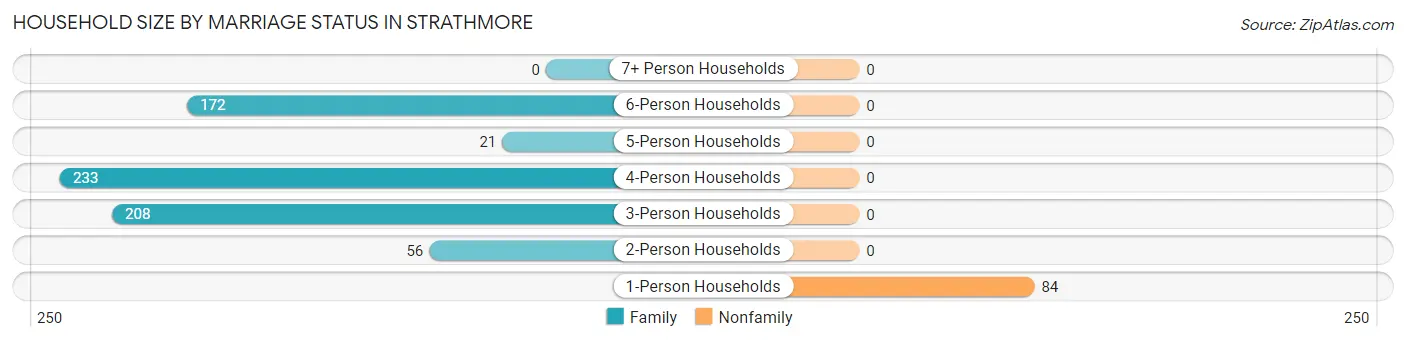
| Household Size | Family Households | Nonfamily Households |
| 1-Person Households | - | 84 (10.8%) |
| 2-Person Households | 56 (7.2%) | 0 (0.0%) |
| 3-Person Households | 208 (26.9%) | 0 (0.0%) |
| 4-Person Households | 233 (30.1%) | 0 (0.0%) |
| 5-Person Households | 21 (2.7%) | 0 (0.0%) |
| 6-Person Households | 172 (22.2%) | 0 (0.0%) |
| 7+ Person Households | 0 (0.0%) | 0 (0.0%) |
| Total | 690 (89.1%) | 84 (10.8%) |
Female Fertility in Strathmore
Fertility by Age in Strathmore
Average fertility rate in Strathmore is 77.0 births per 1,000 women. Women in the age bracket of 20 to 34 years have the highest fertility rate with 246.0 births per 1,000 women. Women in the age bracket of 20 to 34 years acount for 100.0% of all women with births.
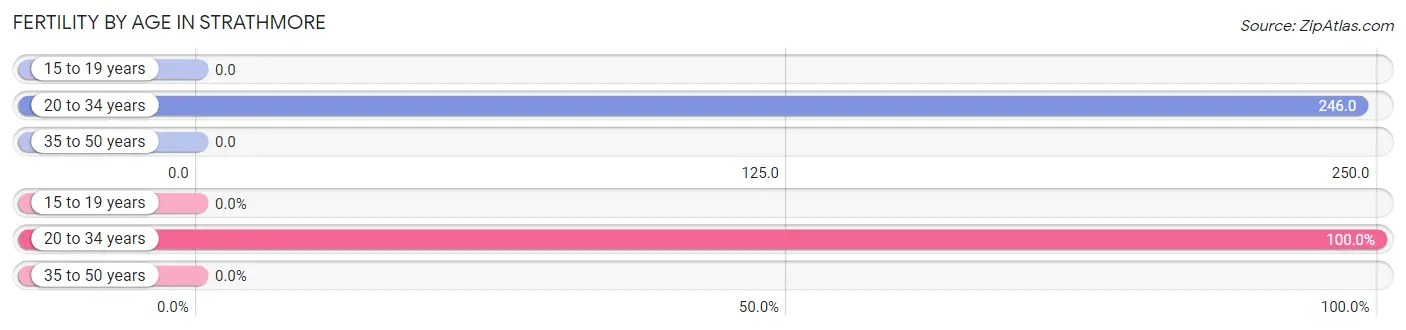
| Age Bracket | Women with Births | Births / 1,000 Women |
| 15 to 19 years | 0 (0.0%) | 0.0 |
| 20 to 34 years | 49 (100.0%) | 246.0 |
| 35 to 50 years | 0 (0.0%) | 0.0 |
| Total | 49 (100.0%) | 77.0 |
Fertility by Age by Marriage Status in Strathmore
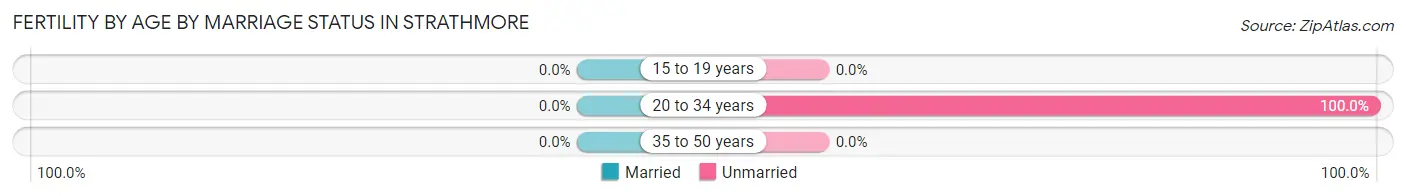
| Age Bracket | Married | Unmarried |
| 15 to 19 years | 0 (0.0%) | 0 (0.0%) |
| 20 to 34 years | 0 (0.0%) | 49 (100.0%) |
| 35 to 50 years | 0 (0.0%) | 0 (0.0%) |
| Total | 0 (0.0%) | 49 (100.0%) |
Fertility by Education in Strathmore
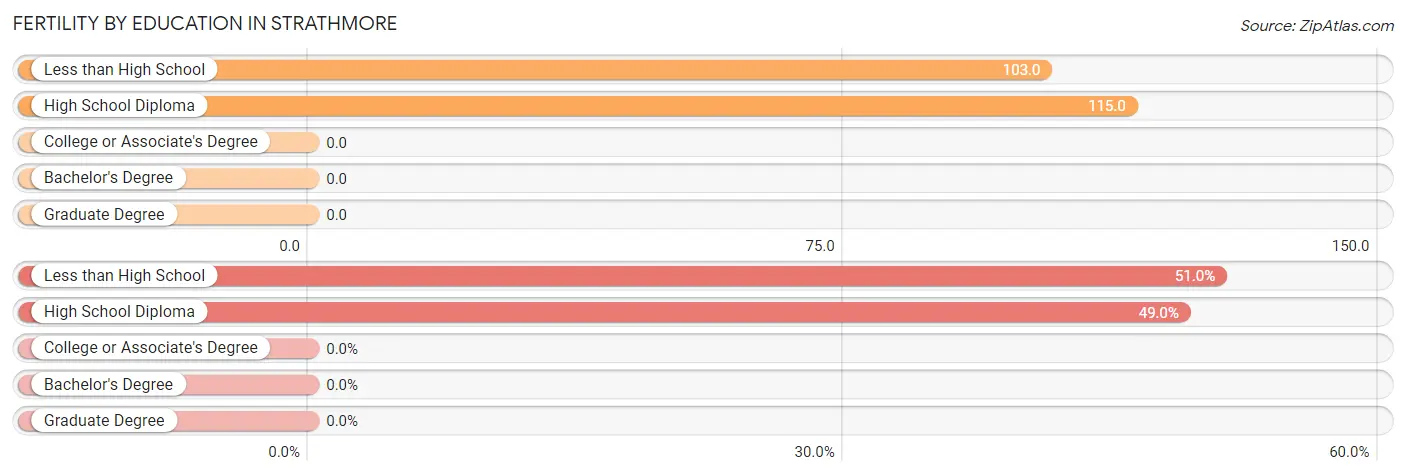
| Educational Attainment | Women with Births | Births / 1,000 Women |
| Less than High School | 25 (51.0%) | 103.0 |
| High School Diploma | 24 (49.0%) | 115.0 |
| College or Associate's Degree | 0 (0.0%) | 0.0 |
| Bachelor's Degree | 0 (0.0%) | 0.0 |
| Graduate Degree | 0 (0.0%) | 0.0 |
| Total | 49 (100.0%) | 77.0 |
Fertility by Education by Marriage Status in Strathmore
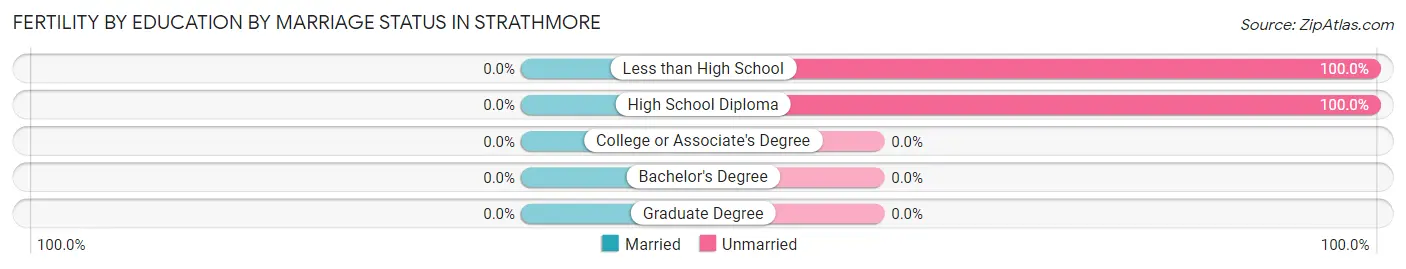
| Educational Attainment | Married | Unmarried |
| Less than High School | 0 (0.0%) | 25 (100.0%) |
| High School Diploma | 0 (0.0%) | 24 (100.0%) |
| College or Associate's Degree | 0 (0.0%) | 0 (0.0%) |
| Bachelor's Degree | 0 (0.0%) | 0 (0.0%) |
| Graduate Degree | 0 (0.0%) | 0 (0.0%) |
| Total | 0 (0.0%) | 49 (100.0%) |
Employment Characteristics in Strathmore
Employment by Class of Employer in Strathmore
Among the 522 employed individuals in Strathmore, private company employees (447 | 85.6%), self-employed (not incorporated) (39 | 7.5%), and local government employees (36 | 6.9%) make up the most common classes of employment.
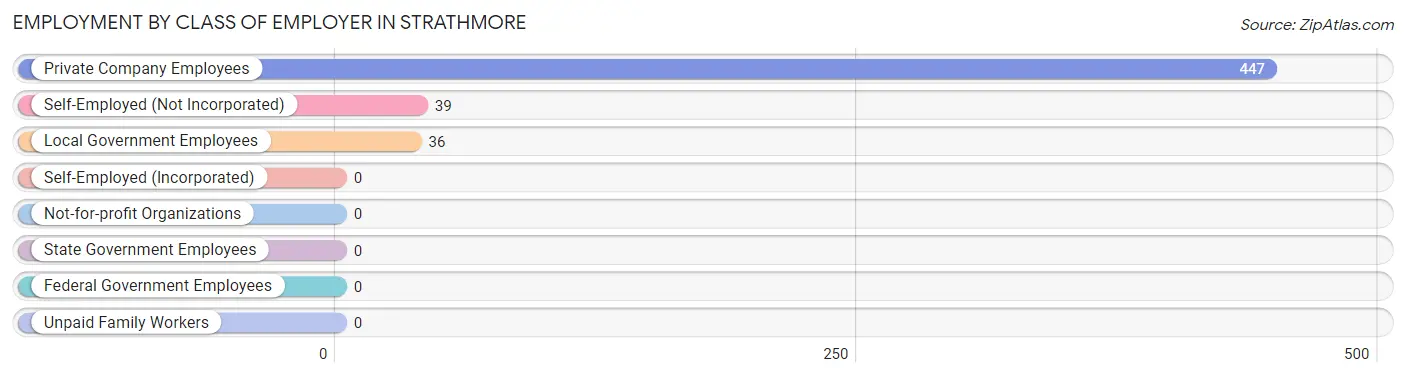
| Employer Class | # Employees | % Employees |
| Private Company Employees | 447 | 85.6% |
| Self-Employed (Incorporated) | 0 | 0.0% |
| Self-Employed (Not Incorporated) | 39 | 7.5% |
| Not-for-profit Organizations | 0 | 0.0% |
| Local Government Employees | 36 | 6.9% |
| State Government Employees | 0 | 0.0% |
| Federal Government Employees | 0 | 0.0% |
| Unpaid Family Workers | 0 | 0.0% |
| Total | 522 | 100.0% |
Employment Status by Age in Strathmore
According to the labor force statistics for Strathmore, out of the total population over 16 years of age (2,049), 30.8% or 631 individuals are in the labor force, with 15.2% or 96 of them unemployed. The age group with the highest labor force participation rate is 45 to 54 years, with 83.3% or 209 individuals in the labor force. Within the labor force, the 60 to 64 years age range has the highest percentage of unemployed individuals, with 100.0% or 38 of them being unemployed.

| Age Bracket | In Labor Force | Unemployed |
| 16 to 19 Years | 0 (0.0%) | 0 (0.0%) |
| 20 to 24 Years | 0 (0.0%) | 0 (0.0%) |
| 25 to 29 Years | 0 (0.0%) | 0 (0.0%) |
| 30 to 34 Years | 63 (72.4%) | 0 (0.0%) |
| 35 to 44 Years | 146 (41.0%) | 58 (39.7%) |
| 45 to 54 Years | 209 (83.3%) | 0 (0.0%) |
| 55 to 59 Years | 151 (43.9%) | 0 (0.0%) |
| 60 to 64 Years | 38 (10.7%) | 38 (100.0%) |
| 65 to 74 Years | 25 (24.8%) | 0 (0.0%) |
| 75 Years and over | 0 (0.0%) | 0 (0.0%) |
| Total | 631 (30.8%) | 96 (15.2%) |
Employment Status by Educational Attainment in Strathmore
According to labor force statistics for Strathmore, 38.1% of individuals (608) out of the total population between 25 and 64 years of age (1,595) are in the labor force, with 15.8% or 96 of them being unemployed. The group with the highest labor force participation rate are those with the educational attainment of bachelor's degree or higher, with 100.0% or 47 individuals in the labor force. Within the labor force, individuals with high school diploma education have the highest percentage of unemployment, with 18.8% or 53 of them being unemployed.
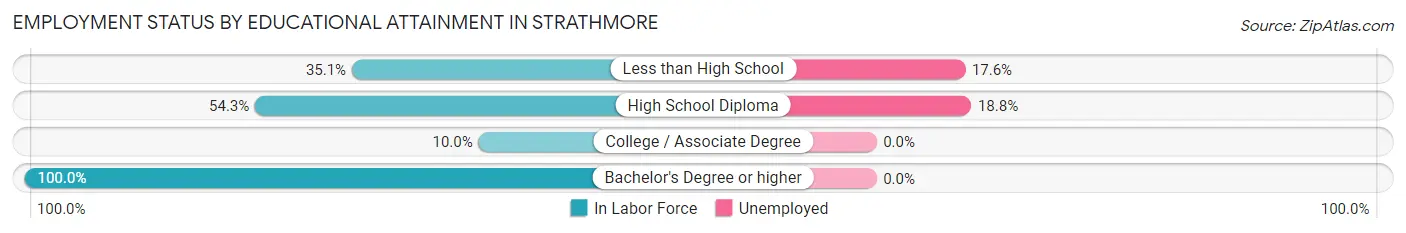
| Educational Attainment | In Labor Force | Unemployed |
| Less than High School | 245 (35.1%) | 123 (17.6%) |
| High School Diploma | 282 (54.3%) | 98 (18.8%) |
| College / Associate Degree | 33 (10.0%) | 0 (0.0%) |
| Bachelor's Degree or higher | 47 (100.0%) | 0 (0.0%) |
| Total | 608 (38.1%) | 252 (15.8%) |
Employment Occupations by Sex in Strathmore
Management, Business, Science and Arts Occupations
The most common Management, Business, Science and Arts occupations in Strathmore are Management (97 | 18.1%), Computers, Engineering & Science (33 | 6.2%), and Computers & Mathematics (33 | 6.2%).
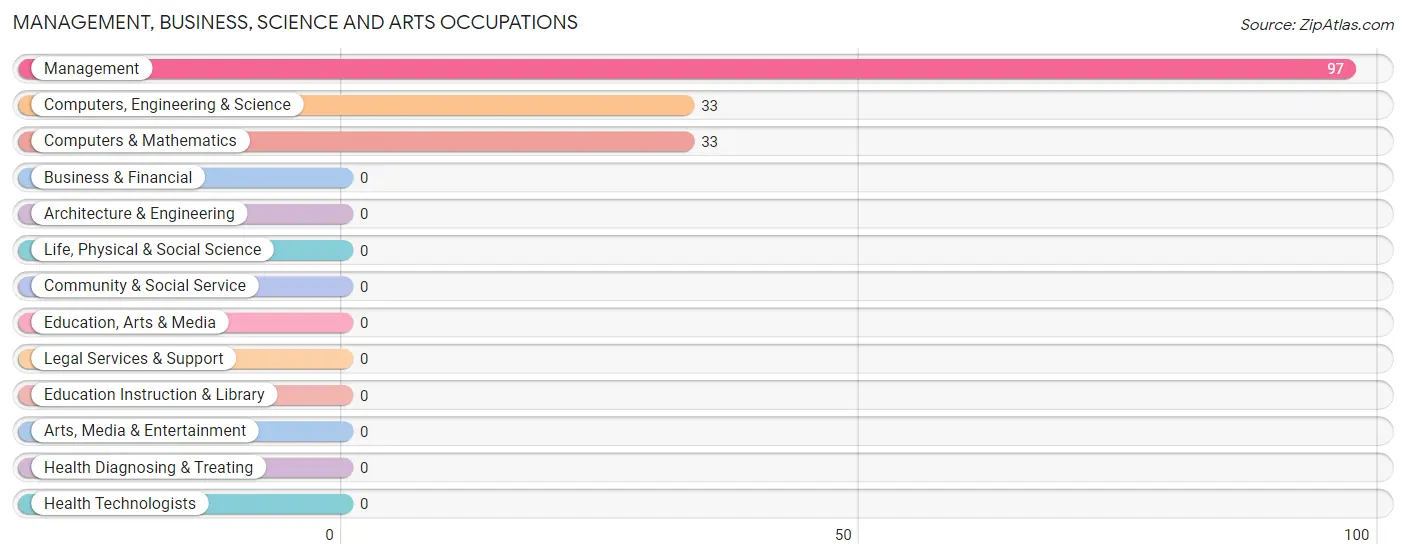
Management, Business, Science and Arts Occupations by Sex
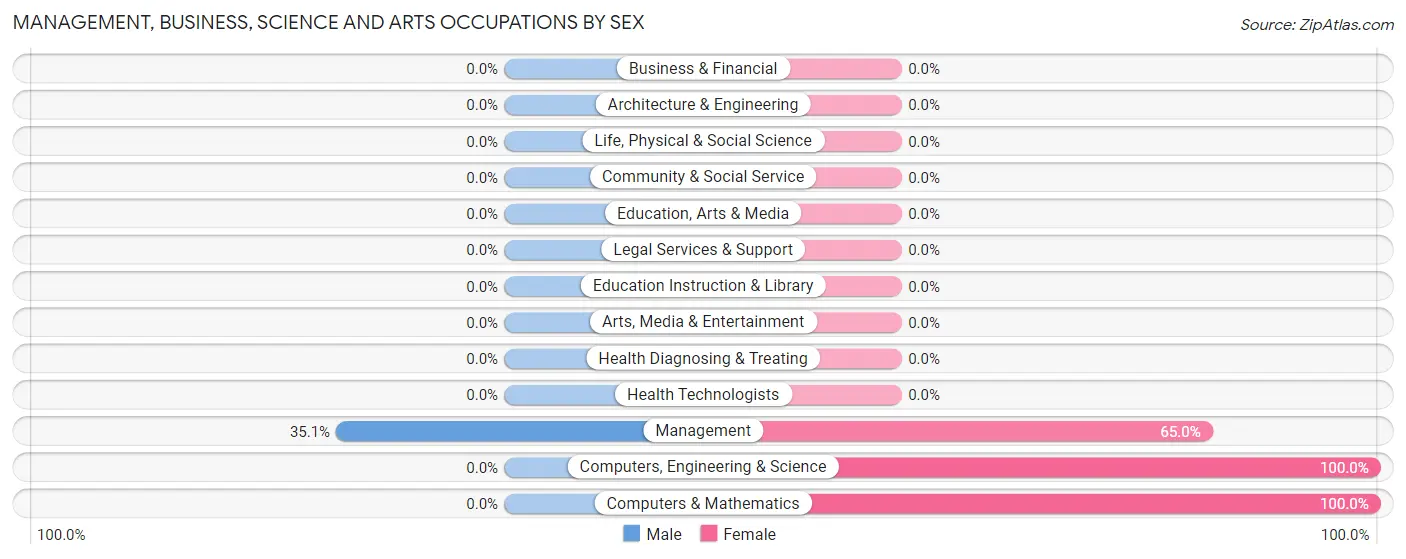
| Occupation | Male | Female |
| Management | 34 (35.0%) | 63 (64.9%) |
| Business & Financial | 0 (0.0%) | 0 (0.0%) |
| Computers, Engineering & Science | 0 (0.0%) | 33 (100.0%) |
| Computers & Mathematics | 0 (0.0%) | 33 (100.0%) |
| Architecture & Engineering | 0 (0.0%) | 0 (0.0%) |
| Life, Physical & Social Science | 0 (0.0%) | 0 (0.0%) |
| Community & Social Service | 0 (0.0%) | 0 (0.0%) |
| Education, Arts & Media | 0 (0.0%) | 0 (0.0%) |
| Legal Services & Support | 0 (0.0%) | 0 (0.0%) |
| Education Instruction & Library | 0 (0.0%) | 0 (0.0%) |
| Arts, Media & Entertainment | 0 (0.0%) | 0 (0.0%) |
| Health Diagnosing & Treating | 0 (0.0%) | 0 (0.0%) |
| Health Technologists | 0 (0.0%) | 0 (0.0%) |
| Total (Category) | 34 (26.2%) | 96 (73.9%) |
| Total (Overall) | 295 (55.0%) | 241 (45.0%) |
Services Occupations
The most common Services occupations in Strathmore are Healthcare Support (65 | 12.1%), and Cleaning & Maintenance (39 | 7.3%).
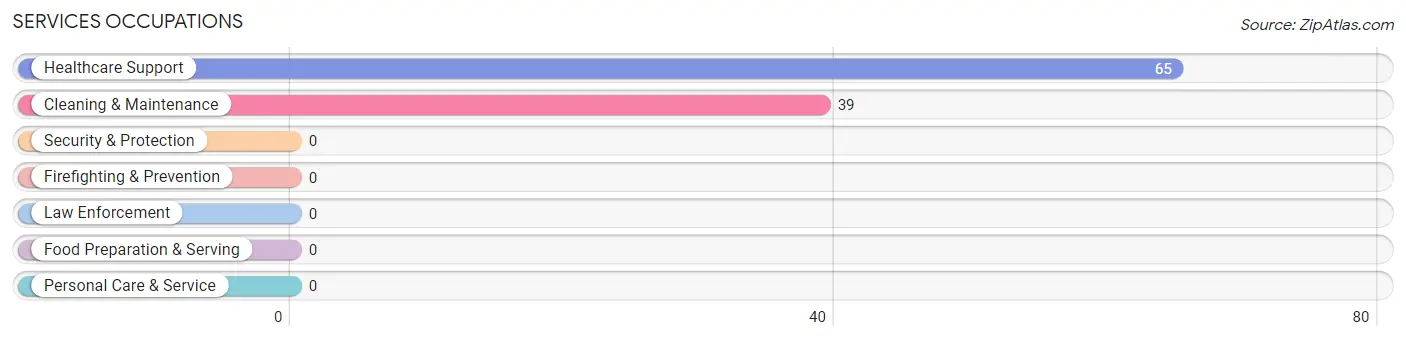
Services Occupations by Sex
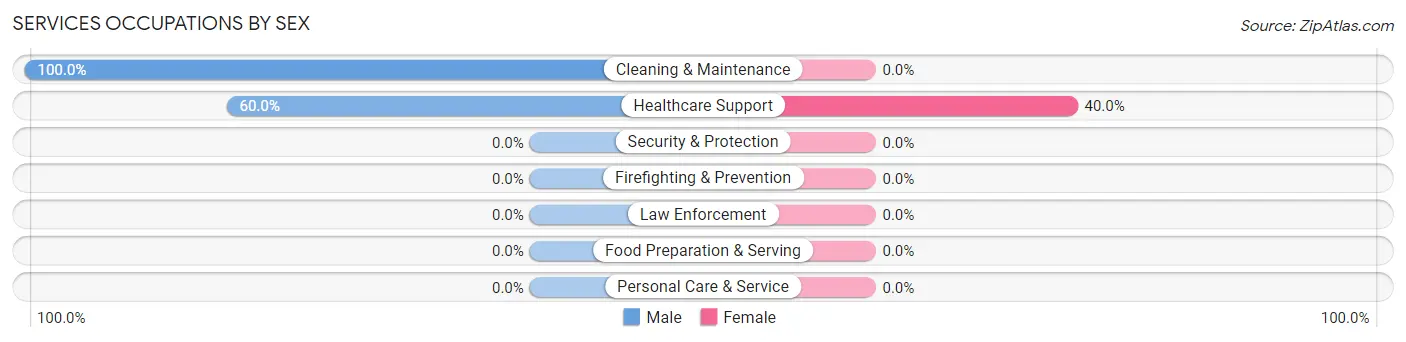
| Occupation | Male | Female |
| Healthcare Support | 39 (60.0%) | 26 (40.0%) |
| Security & Protection | 0 (0.0%) | 0 (0.0%) |
| Firefighting & Prevention | 0 (0.0%) | 0 (0.0%) |
| Law Enforcement | 0 (0.0%) | 0 (0.0%) |
| Food Preparation & Serving | 0 (0.0%) | 0 (0.0%) |
| Cleaning & Maintenance | 39 (100.0%) | 0 (0.0%) |
| Personal Care & Service | 0 (0.0%) | 0 (0.0%) |
| Total (Category) | 78 (75.0%) | 26 (25.0%) |
| Total (Overall) | 295 (55.0%) | 241 (45.0%) |
Sales and Office Occupations
The most common Sales and Office occupations in Strathmore are , and Office & Administration (108 | 20.2%).
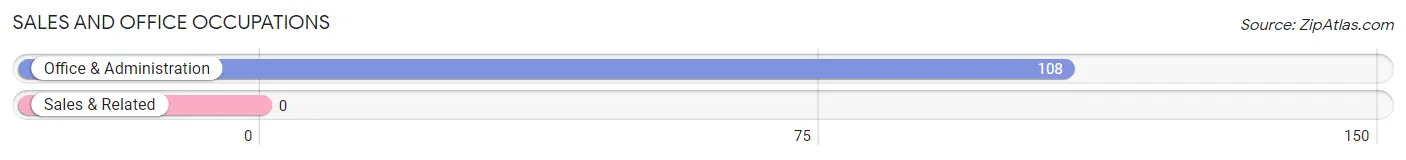
Sales and Office Occupations by Sex
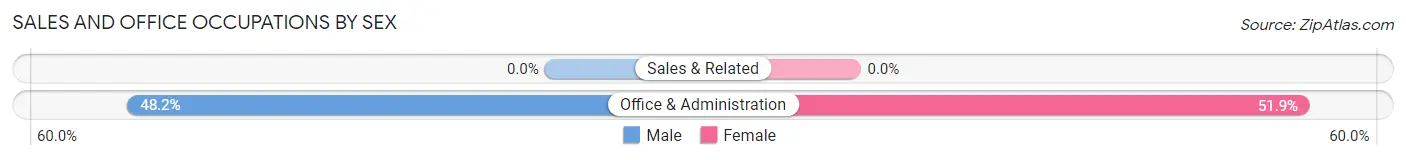
| Occupation | Male | Female |
| Sales & Related | 0 (0.0%) | 0 (0.0%) |
| Office & Administration | 52 (48.1%) | 56 (51.8%) |
| Total (Category) | 52 (48.1%) | 56 (51.8%) |
| Total (Overall) | 295 (55.0%) | 241 (45.0%) |
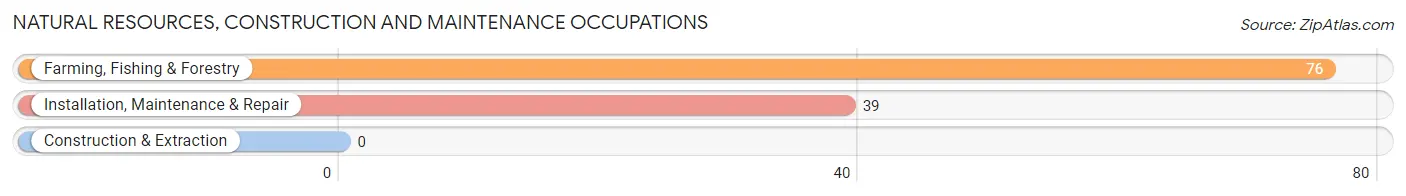
Natural Resources, Construction and Maintenance Occupations
The most common Natural Resources, Construction and Maintenance occupations in Strathmore are Farming, Fishing & Forestry (76 | 14.2%), and Installation, Maintenance & Repair (39 | 7.3%).
Natural Resources, Construction and Maintenance Occupations by Sex
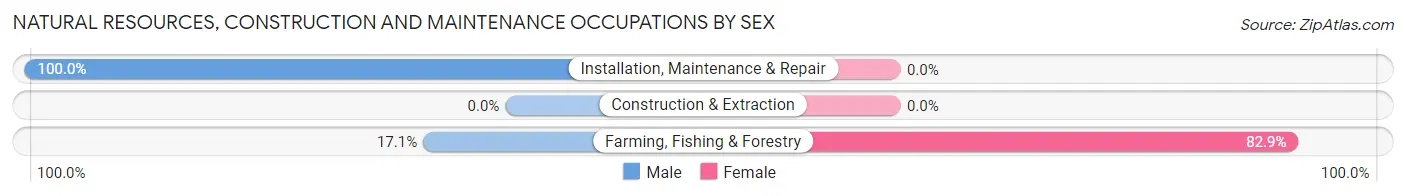
| Occupation | Male | Female |
| Farming, Fishing & Forestry | 13 (17.1%) | 63 (82.9%) |
| Construction & Extraction | 0 (0.0%) | 0 (0.0%) |
| Installation, Maintenance & Repair | 39 (100.0%) | 0 (0.0%) |
| Total (Category) | 52 (45.2%) | 63 (54.8%) |
| Total (Overall) | 295 (55.0%) | 241 (45.0%) |
Production, Transportation and Moving Occupations
The most common Production, Transportation and Moving occupations in Strathmore are , and Production (79 | 14.7%).
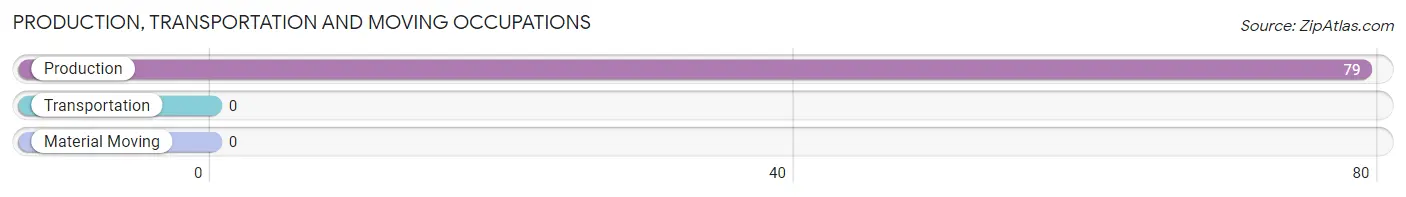
Production, Transportation and Moving Occupations by Sex
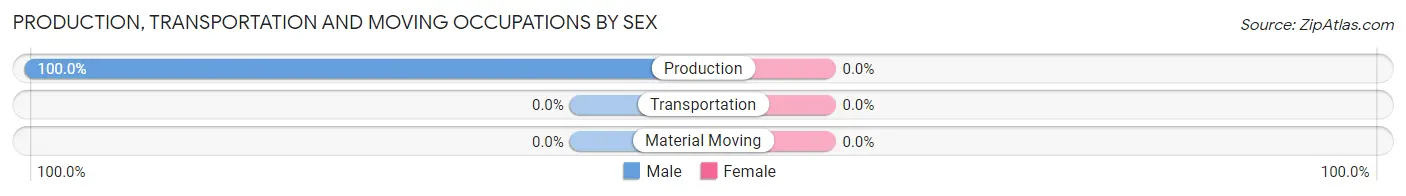
| Occupation | Male | Female |
| Production | 79 (100.0%) | 0 (0.0%) |
| Transportation | 0 (0.0%) | 0 (0.0%) |
| Material Moving | 0 (0.0%) | 0 (0.0%) |
| Total (Category) | 79 (100.0%) | 0 (0.0%) |
| Total (Overall) | 295 (55.0%) | 241 (45.0%) |
Employment Industries by Sex in Strathmore
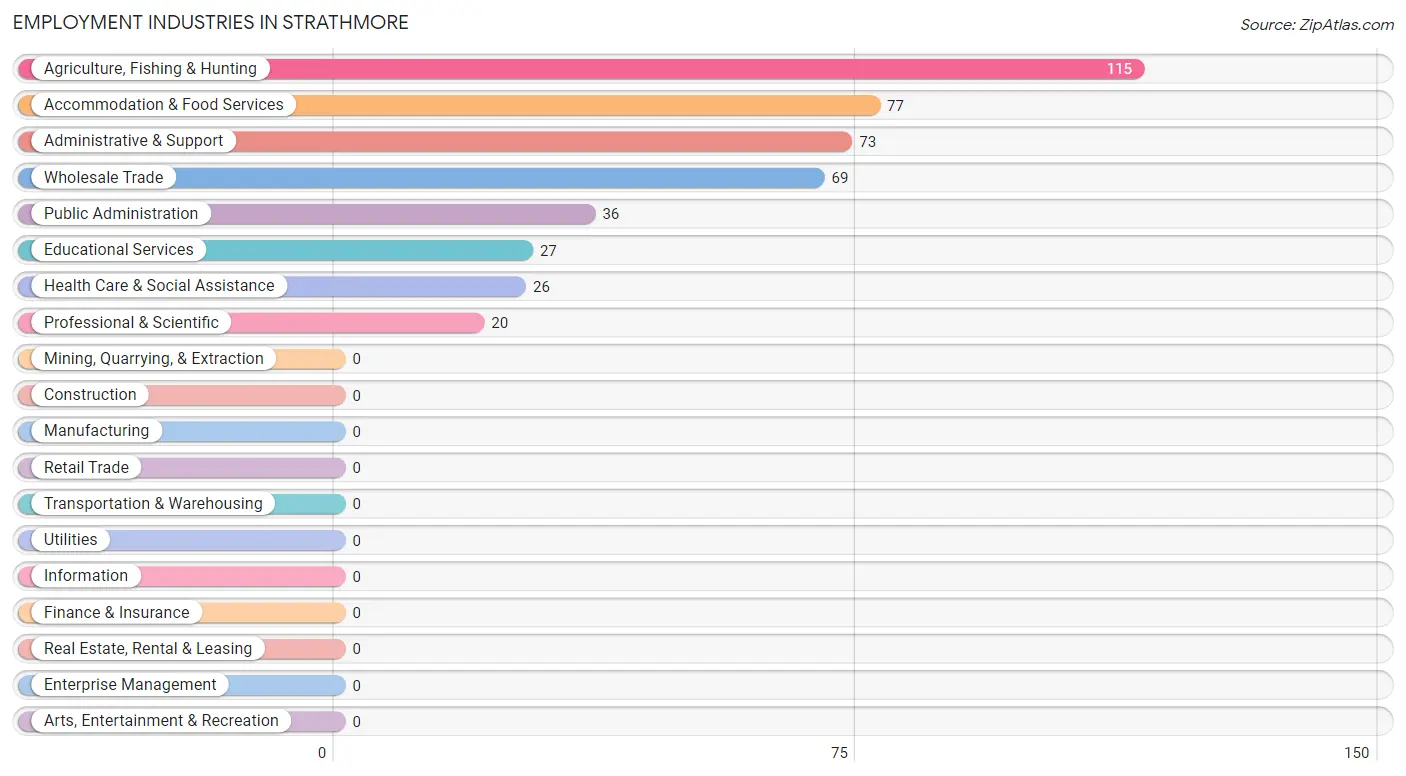
Employment Industries in Strathmore
The major employment industries in Strathmore include Agriculture, Fishing & Hunting (115 | 21.5%), Accommodation & Food Services (77 | 14.4%), Administrative & Support (73 | 13.6%), Wholesale Trade (69 | 12.9%), and Public Administration (36 | 6.7%).
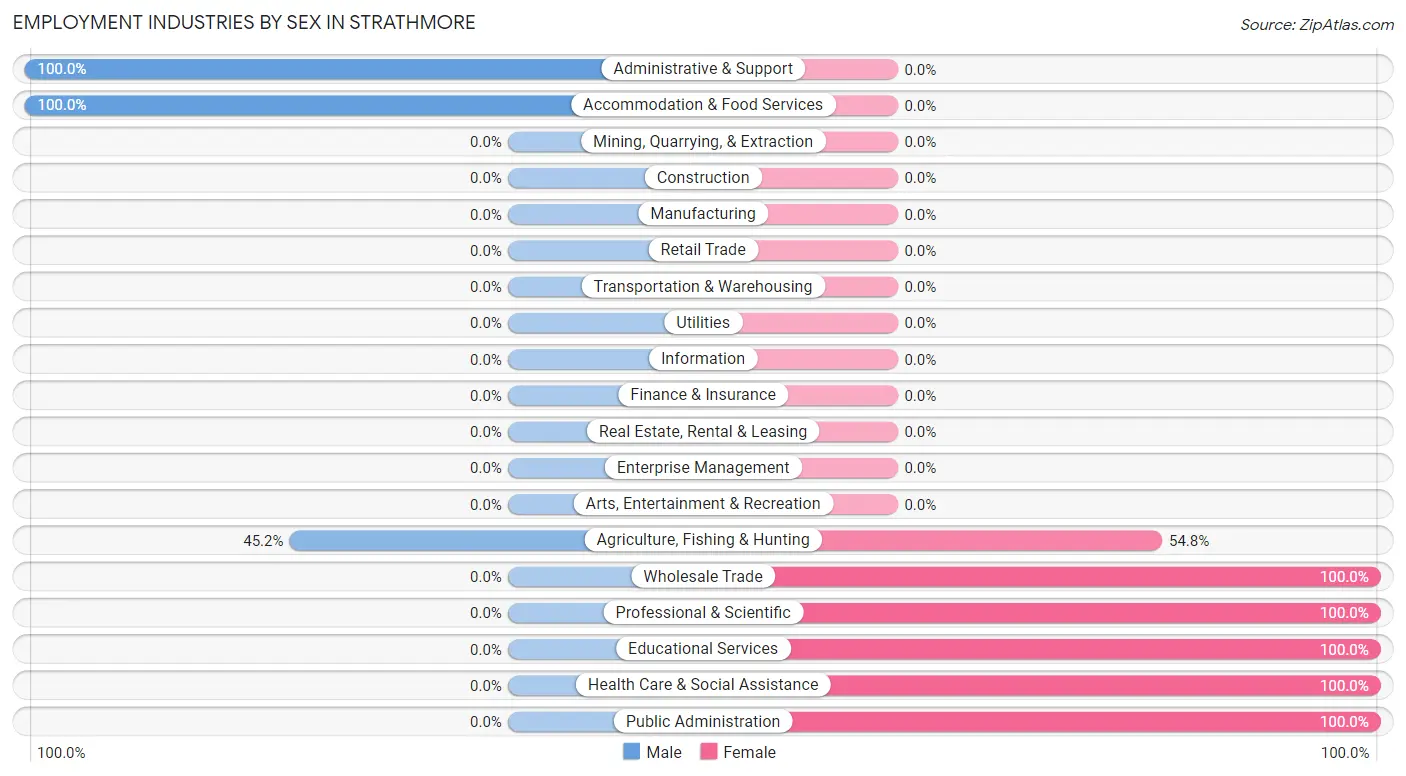
Employment Industries by Sex in Strathmore
The Strathmore industries that see more men than women are Administrative & Support (100.0%), Accommodation & Food Services (100.0%), and Agriculture, Fishing & Hunting (45.2%), whereas the industries that tend to have a higher number of women are Wholesale Trade (100.0%), Professional & Scientific (100.0%), and Educational Services (100.0%).
| Industry | Male | Female |
| Agriculture, Fishing & Hunting | 52 (45.2%) | 63 (54.8%) |
| Mining, Quarrying, & Extraction | 0 (0.0%) | 0 (0.0%) |
| Construction | 0 (0.0%) | 0 (0.0%) |
| Manufacturing | 0 (0.0%) | 0 (0.0%) |
| Wholesale Trade | 0 (0.0%) | 69 (100.0%) |
| Retail Trade | 0 (0.0%) | 0 (0.0%) |
| Transportation & Warehousing | 0 (0.0%) | 0 (0.0%) |
| Utilities | 0 (0.0%) | 0 (0.0%) |
| Information | 0 (0.0%) | 0 (0.0%) |
| Finance & Insurance | 0 (0.0%) | 0 (0.0%) |
| Real Estate, Rental & Leasing | 0 (0.0%) | 0 (0.0%) |
| Professional & Scientific | 0 (0.0%) | 20 (100.0%) |
| Enterprise Management | 0 (0.0%) | 0 (0.0%) |
| Administrative & Support | 73 (100.0%) | 0 (0.0%) |
| Educational Services | 0 (0.0%) | 27 (100.0%) |
| Health Care & Social Assistance | 0 (0.0%) | 26 (100.0%) |
| Arts, Entertainment & Recreation | 0 (0.0%) | 0 (0.0%) |
| Accommodation & Food Services | 77 (100.0%) | 0 (0.0%) |
| Public Administration | 0 (0.0%) | 36 (100.0%) |
| Total | 295 (55.0%) | 241 (45.0%) |
Education in Strathmore
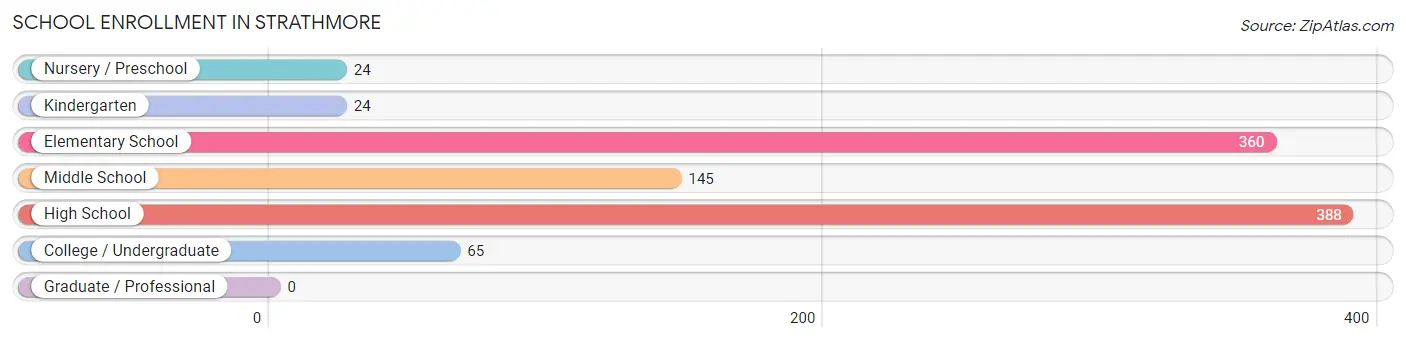
School Enrollment in Strathmore
The most common levels of schooling among the 1,006 students in Strathmore are high school (388 | 38.6%), elementary school (360 | 35.8%), and middle school (145 | 14.4%).
| School Level | # Students | % Students |
| Nursery / Preschool | 24 | 2.4% |
| Kindergarten | 24 | 2.4% |
| Elementary School | 360 | 35.8% |
| Middle School | 145 | 14.4% |
| High School | 388 | 38.6% |
| College / Undergraduate | 65 | 6.5% |
| Graduate / Professional | 0 | 0.0% |
| Total | 1,006 | 100.0% |
School Enrollment by Age by Funding Source in Strathmore
Out of a total of 1,006 students who are enrolled in schools in Strathmore, 36 (3.6%) attend a private institution, while the remaining 970 (96.4%) are enrolled in public schools. The age group of 25 to 34 year olds has the highest likelihood of being enrolled in private schools, with 36 (100.0% in the age bracket) enrolled. Conversely, the age group of 3 to 4 year olds has the lowest likelihood of being enrolled in a private school, with 24 (100.0% in the age bracket) attending a public institution.
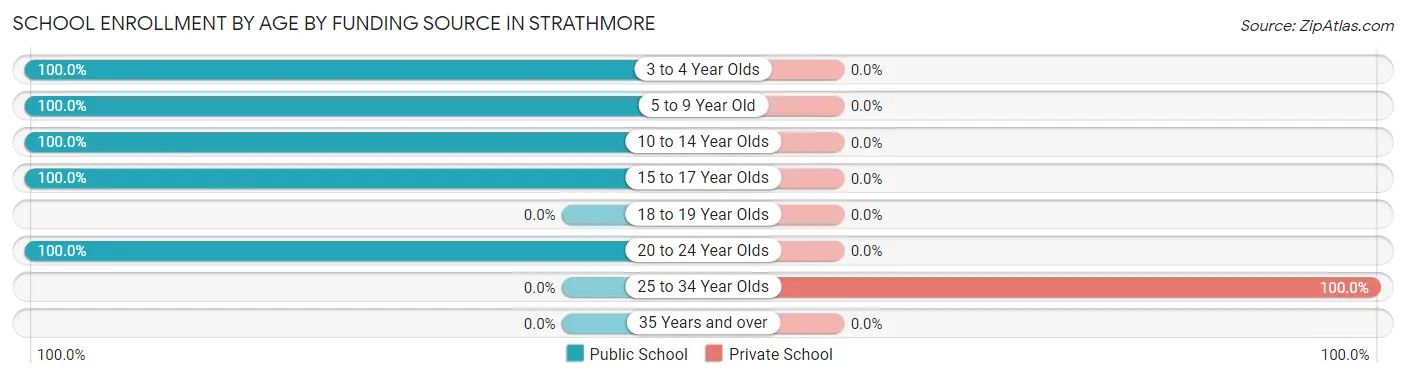
| Age Bracket | Public School | Private School |
| 3 to 4 Year Olds | 24 (100.0%) | 0 (0.0%) |
| 5 to 9 Year Old | 352 (100.0%) | 0 (0.0%) |
| 10 to 14 Year Olds | 177 (100.0%) | 0 (0.0%) |
| 15 to 17 Year Olds | 388 (100.0%) | 0 (0.0%) |
| 18 to 19 Year Olds | 0 (0.0%) | 0 (0.0%) |
| 20 to 24 Year Olds | 29 (100.0%) | 0 (0.0%) |
| 25 to 34 Year Olds | 0 (0.0%) | 36 (100.0%) |
| 35 Years and over | 0 (0.0%) | 0 (0.0%) |
| Total | 970 (96.4%) | 36 (3.6%) |
Educational Attainment by Field of Study in Strathmore
Arts & humanities (27 | 57.5%), and liberal arts & history (20 | 42.5%) are the most common fields of study among 47 individuals in Strathmore who have obtained a bachelor's degree or higher.
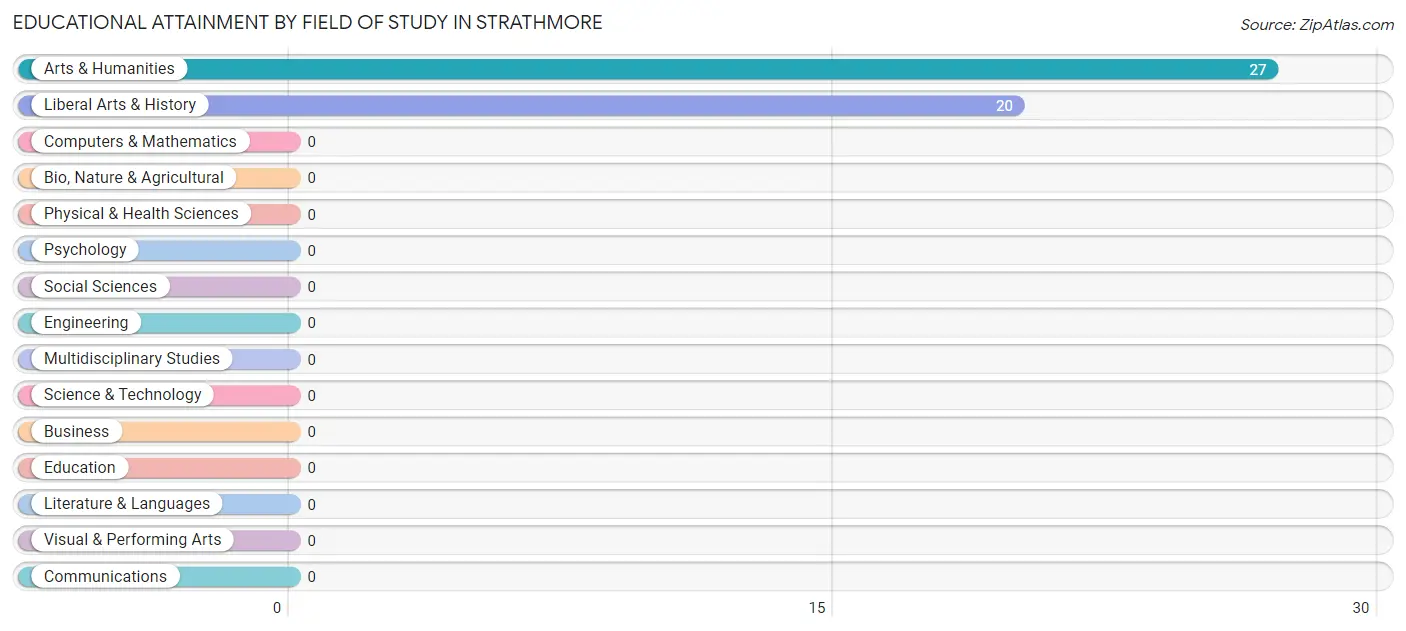
| Field of Study | # Graduates | % Graduates |
| Computers & Mathematics | 0 | 0.0% |
| Bio, Nature & Agricultural | 0 | 0.0% |
| Physical & Health Sciences | 0 | 0.0% |
| Psychology | 0 | 0.0% |
| Social Sciences | 0 | 0.0% |
| Engineering | 0 | 0.0% |
| Multidisciplinary Studies | 0 | 0.0% |
| Science & Technology | 0 | 0.0% |
| Business | 0 | 0.0% |
| Education | 0 | 0.0% |
| Literature & Languages | 0 | 0.0% |
| Liberal Arts & History | 20 | 42.5% |
| Visual & Performing Arts | 0 | 0.0% |
| Communications | 0 | 0.0% |
| Arts & Humanities | 27 | 57.5% |
| Total | 47 | 100.0% |
Transportation & Commute in Strathmore
Vehicle Availability by Sex in Strathmore
The most prevalent vehicle ownership categories in Strathmore are males with 2 vehicles (151, accounting for 53.7%) and females with 2 vehicles (125, making up 62.7%).
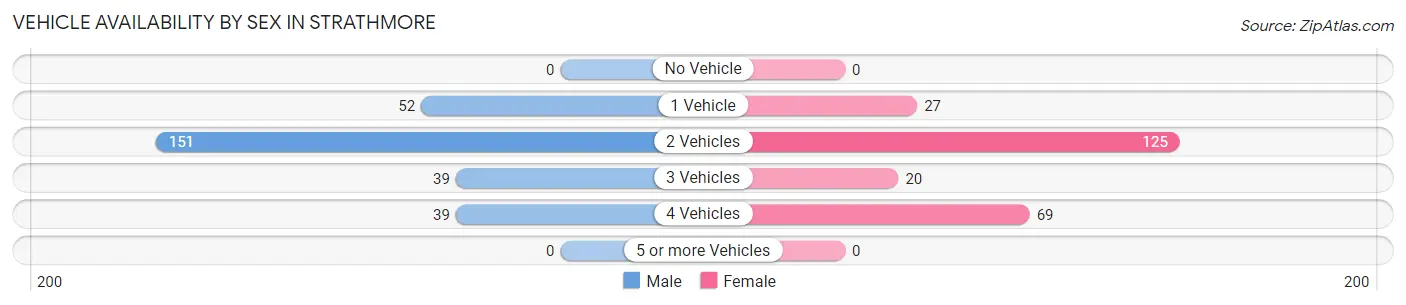
| Vehicles Available | Male | Female |
| No Vehicle | 0 (0.0%) | 0 (0.0%) |
| 1 Vehicle | 52 (18.5%) | 27 (11.2%) |
| 2 Vehicles | 151 (53.7%) | 125 (51.9%) |
| 3 Vehicles | 39 (13.9%) | 20 (8.3%) |
| 4 Vehicles | 39 (13.9%) | 69 (28.6%) |
| 5 or more Vehicles | 0 (0.0%) | 0 (0.0%) |
| Total | 281 (100.0%) | 241 (100.0%) |
Commute Time in Strathmore
The most frequently occuring commute durations in Strathmore are 15 to 19 minutes (103 commuters, 19.7%), 20 to 24 minutes (79 commuters, 15.1%), and 25 to 29 minutes (75 commuters, 14.4%).
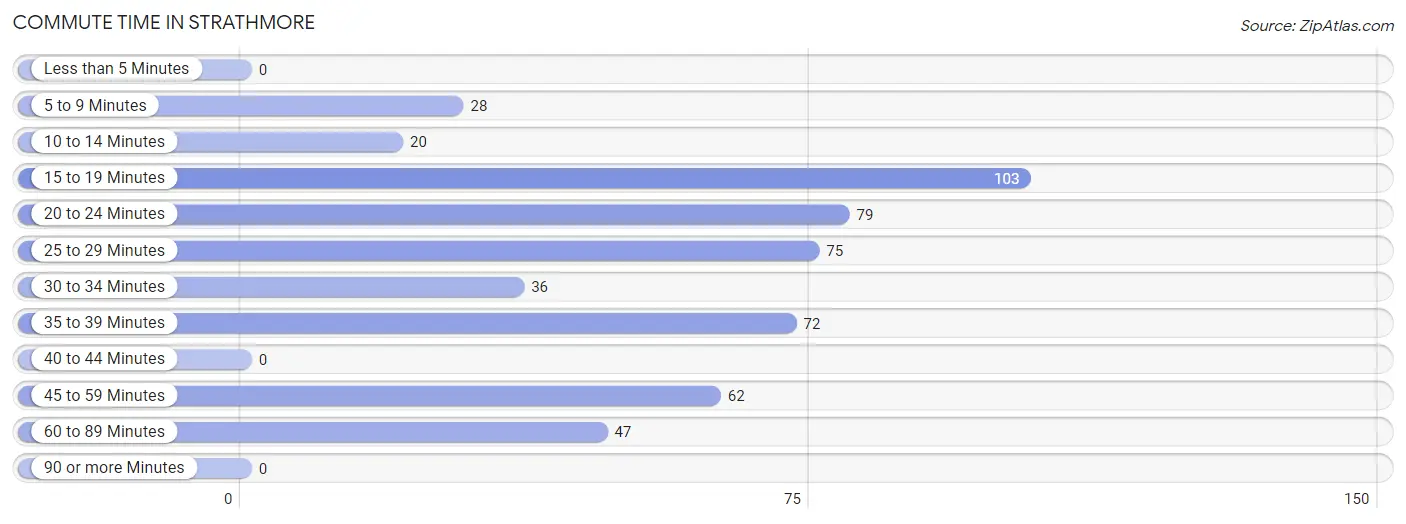
| Commute Time | # Commuters | % Commuters |
| Less than 5 Minutes | 0 | 0.0% |
| 5 to 9 Minutes | 28 | 5.4% |
| 10 to 14 Minutes | 20 | 3.8% |
| 15 to 19 Minutes | 103 | 19.7% |
| 20 to 24 Minutes | 79 | 15.1% |
| 25 to 29 Minutes | 75 | 14.4% |
| 30 to 34 Minutes | 36 | 6.9% |
| 35 to 39 Minutes | 72 | 13.8% |
| 40 to 44 Minutes | 0 | 0.0% |
| 45 to 59 Minutes | 62 | 11.9% |
| 60 to 89 Minutes | 47 | 9.0% |
| 90 or more Minutes | 0 | 0.0% |
Commute Time by Sex in Strathmore
The most common commute times in Strathmore are 20 to 24 minutes (79 commuters, 28.1%) for males and 45 to 59 minutes (62 commuters, 25.7%) for females.
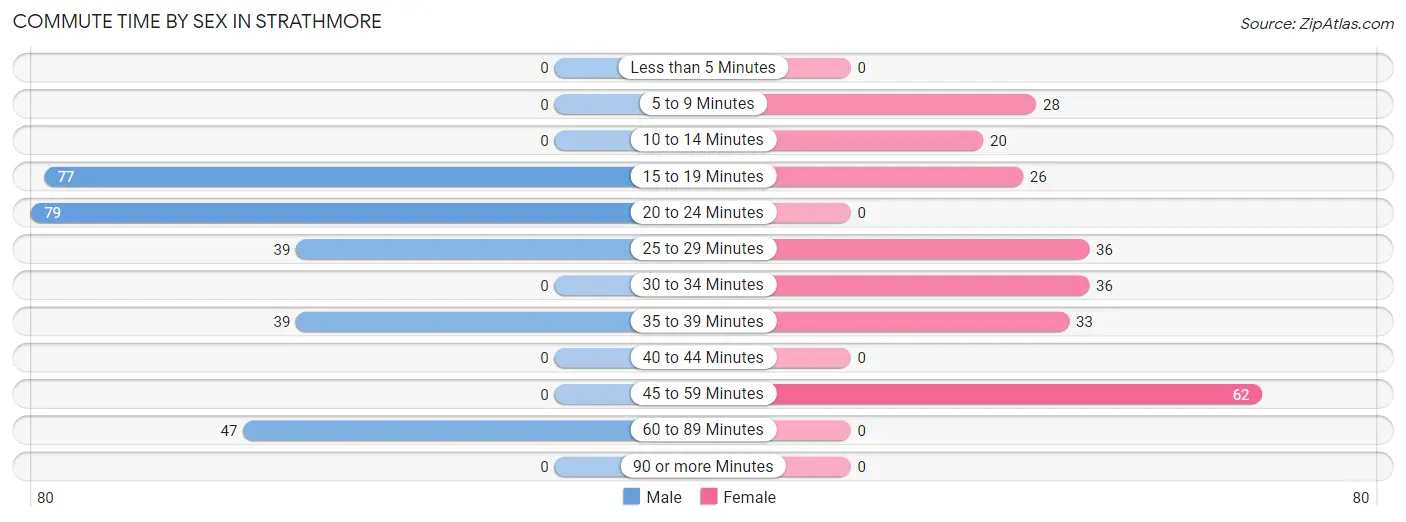
| Commute Time | Male | Female |
| Less than 5 Minutes | 0 (0.0%) | 0 (0.0%) |
| 5 to 9 Minutes | 0 (0.0%) | 28 (11.6%) |
| 10 to 14 Minutes | 0 (0.0%) | 20 (8.3%) |
| 15 to 19 Minutes | 77 (27.4%) | 26 (10.8%) |
| 20 to 24 Minutes | 79 (28.1%) | 0 (0.0%) |
| 25 to 29 Minutes | 39 (13.9%) | 36 (14.9%) |
| 30 to 34 Minutes | 0 (0.0%) | 36 (14.9%) |
| 35 to 39 Minutes | 39 (13.9%) | 33 (13.7%) |
| 40 to 44 Minutes | 0 (0.0%) | 0 (0.0%) |
| 45 to 59 Minutes | 0 (0.0%) | 62 (25.7%) |
| 60 to 89 Minutes | 47 (16.7%) | 0 (0.0%) |
| 90 or more Minutes | 0 (0.0%) | 0 (0.0%) |
Time of Departure to Work by Sex in Strathmore
The most frequent times of departure to work in Strathmore are 7:00 AM to 7:29 AM (131, 46.6%) for males and 6:00 AM to 6:29 AM (60, 24.9%) for females.
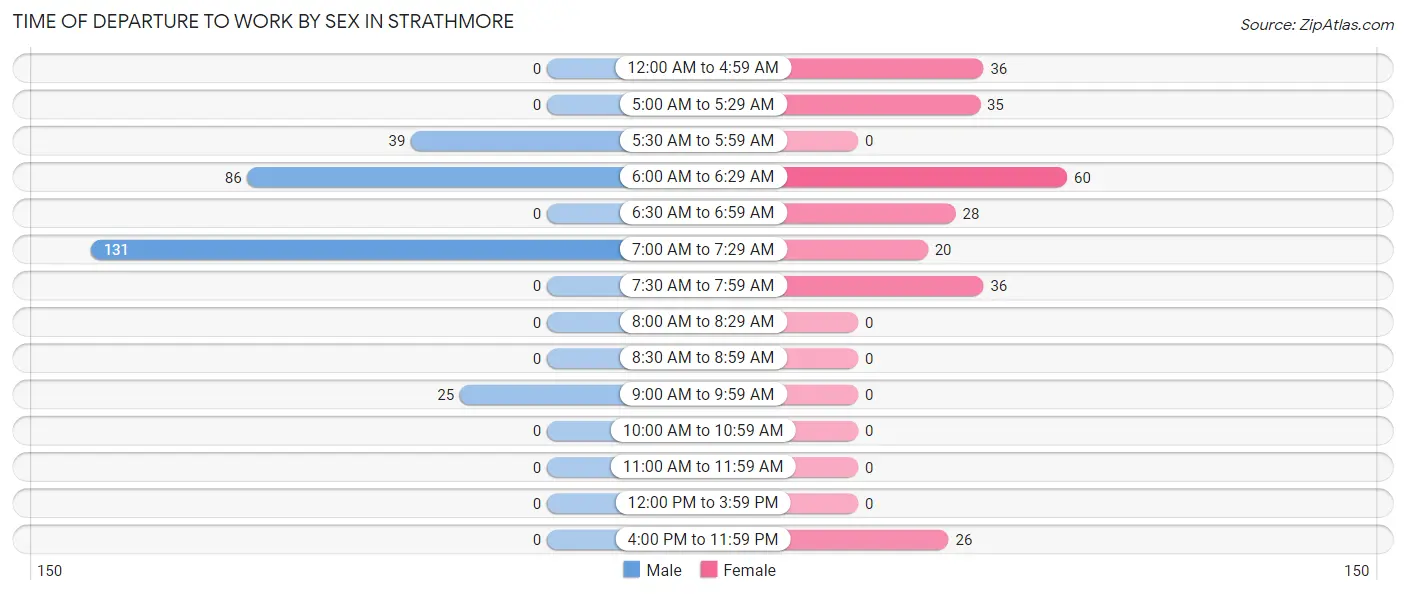
| Time of Departure | Male | Female |
| 12:00 AM to 4:59 AM | 0 (0.0%) | 36 (14.9%) |
| 5:00 AM to 5:29 AM | 0 (0.0%) | 35 (14.5%) |
| 5:30 AM to 5:59 AM | 39 (13.9%) | 0 (0.0%) |
| 6:00 AM to 6:29 AM | 86 (30.6%) | 60 (24.9%) |
| 6:30 AM to 6:59 AM | 0 (0.0%) | 28 (11.6%) |
| 7:00 AM to 7:29 AM | 131 (46.6%) | 20 (8.3%) |
| 7:30 AM to 7:59 AM | 0 (0.0%) | 36 (14.9%) |
| 8:00 AM to 8:29 AM | 0 (0.0%) | 0 (0.0%) |
| 8:30 AM to 8:59 AM | 0 (0.0%) | 0 (0.0%) |
| 9:00 AM to 9:59 AM | 25 (8.9%) | 0 (0.0%) |
| 10:00 AM to 10:59 AM | 0 (0.0%) | 0 (0.0%) |
| 11:00 AM to 11:59 AM | 0 (0.0%) | 0 (0.0%) |
| 12:00 PM to 3:59 PM | 0 (0.0%) | 0 (0.0%) |
| 4:00 PM to 11:59 PM | 0 (0.0%) | 26 (10.8%) |
| Total | 281 (100.0%) | 241 (100.0%) |
Housing Occupancy in Strathmore
Occupancy by Ownership in Strathmore
Of the total 774 dwellings in Strathmore, owner-occupied units account for 570 (73.6%), while renter-occupied units make up 204 (26.4%).
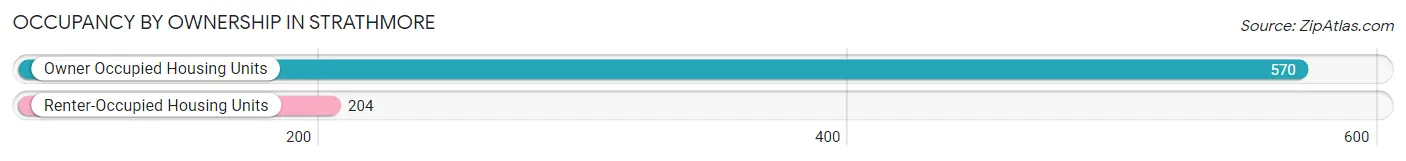
| Occupancy | # Housing Units | % Housing Units |
| Owner Occupied Housing Units | 570 | 73.6% |
| Renter-Occupied Housing Units | 204 | 26.4% |
| Total Occupied Housing Units | 774 | 100.0% |
Occupancy by Household Size in Strathmore
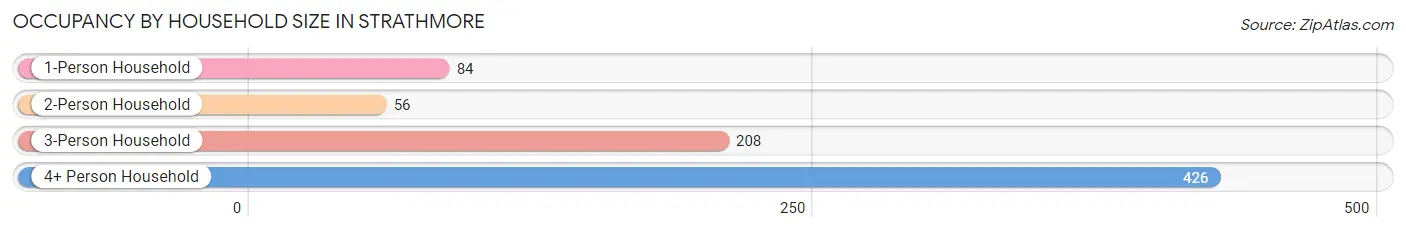
| Household Size | # Housing Units | % Housing Units |
| 1-Person Household | 84 | 10.8% |
| 2-Person Household | 56 | 7.2% |
| 3-Person Household | 208 | 26.9% |
| 4+ Person Household | 426 | 55.0% |
| Total Housing Units | 774 | 100.0% |
Occupancy by Ownership by Household Size in Strathmore
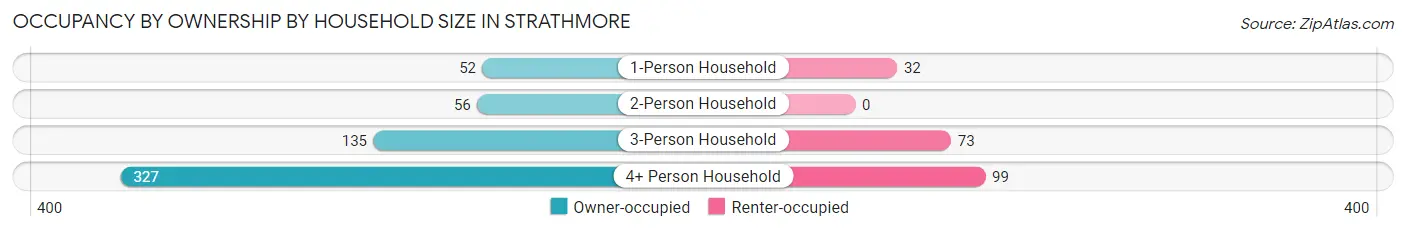
| Household Size | Owner-occupied | Renter-occupied |
| 1-Person Household | 52 (61.9%) | 32 (38.1%) |
| 2-Person Household | 56 (100.0%) | 0 (0.0%) |
| 3-Person Household | 135 (64.9%) | 73 (35.1%) |
| 4+ Person Household | 327 (76.8%) | 99 (23.2%) |
| Total Housing Units | 570 (73.6%) | 204 (26.4%) |
Occupancy by Educational Attainment in Strathmore
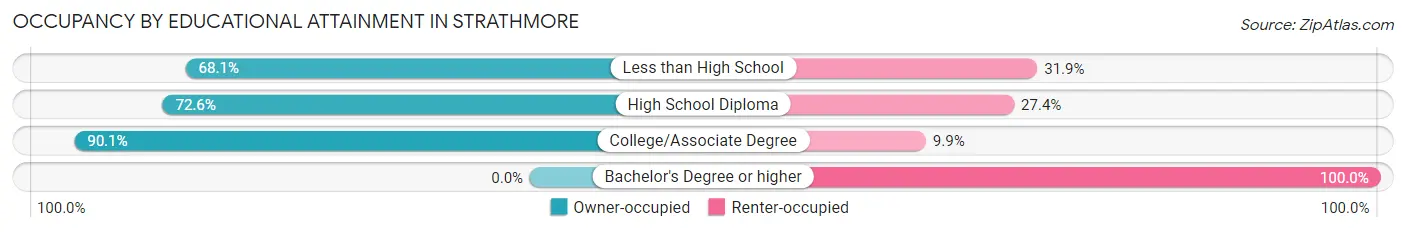
| Household Size | Owner-occupied | Renter-occupied |
| Less than High School | 147 (68.1%) | 69 (31.9%) |
| High School Diploma | 231 (72.6%) | 87 (27.4%) |
| College/Associate Degree | 192 (90.1%) | 21 (9.9%) |
| Bachelor's Degree or higher | 0 (0.0%) | 27 (100.0%) |
Occupancy by Age of Householder in Strathmore
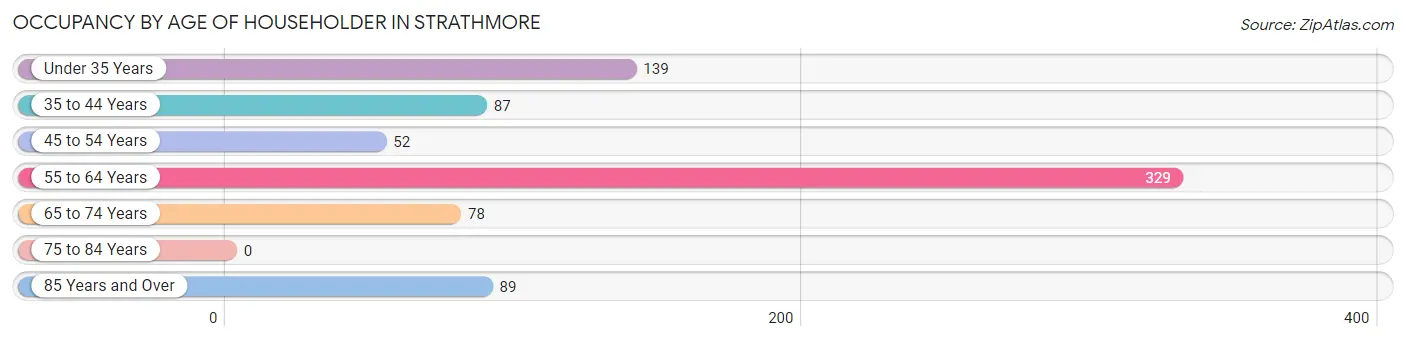
| Age Bracket | # Households | % Households |
| Under 35 Years | 139 | 18.0% |
| 35 to 44 Years | 87 | 11.2% |
| 45 to 54 Years | 52 | 6.7% |
| 55 to 64 Years | 329 | 42.5% |
| 65 to 74 Years | 78 | 10.1% |
| 75 to 84 Years | 0 | 0.0% |
| 85 Years and Over | 89 | 11.5% |
| Total | 774 | 100.0% |
Housing Finances in Strathmore
Median Income by Occupancy in Strathmore
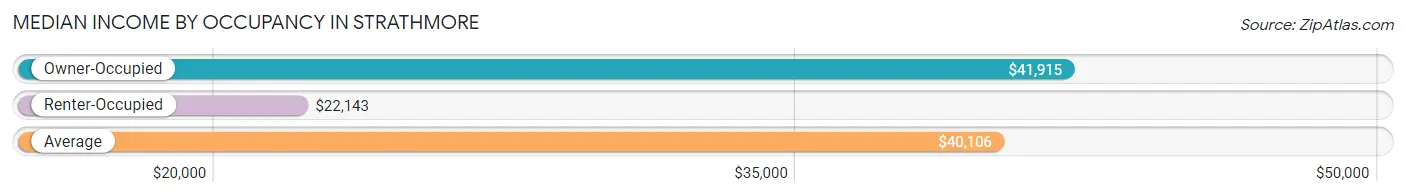
| Occupancy Type | # Households | Median Income |
| Owner-Occupied | 570 (73.6%) | $41,915 |
| Renter-Occupied | 204 (26.4%) | $22,143 |
| Average | 774 (100.0%) | $40,106 |
Occupancy by Householder Income Bracket in Strathmore
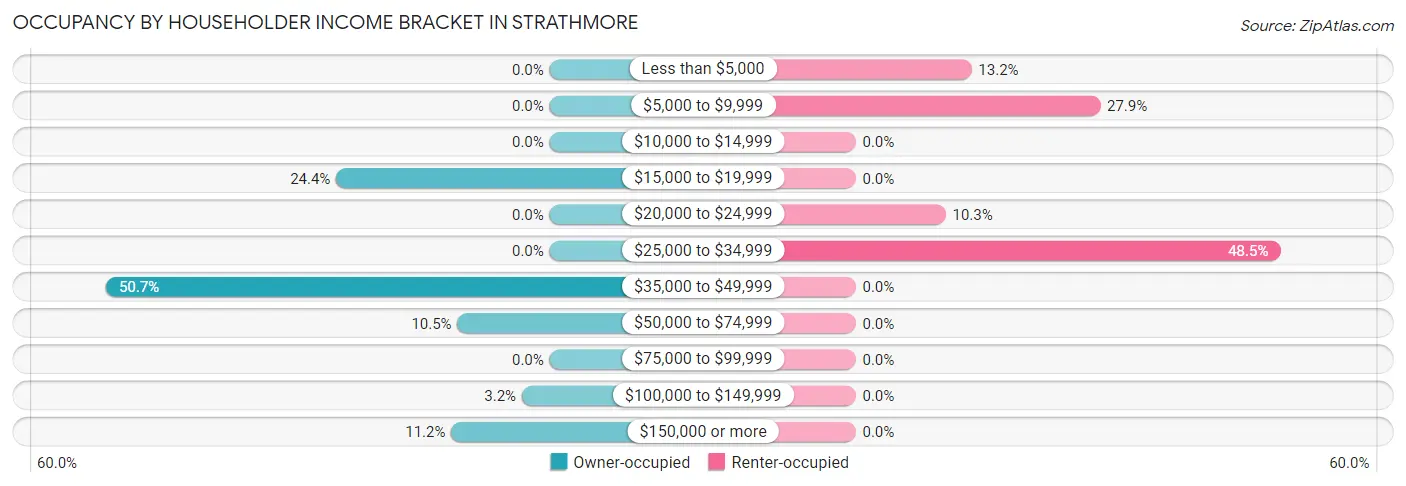
| Income Bracket | Owner-occupied | Renter-occupied |
| Less than $5,000 | 0 (0.0%) | 27 (13.2%) |
| $5,000 to $9,999 | 0 (0.0%) | 57 (27.9%) |
| $10,000 to $14,999 | 0 (0.0%) | 0 (0.0%) |
| $15,000 to $19,999 | 139 (24.4%) | 0 (0.0%) |
| $20,000 to $24,999 | 0 (0.0%) | 21 (10.3%) |
| $25,000 to $34,999 | 0 (0.0%) | 99 (48.5%) |
| $35,000 to $49,999 | 289 (50.7%) | 0 (0.0%) |
| $50,000 to $74,999 | 60 (10.5%) | 0 (0.0%) |
| $75,000 to $99,999 | 0 (0.0%) | 0 (0.0%) |
| $100,000 to $149,999 | 18 (3.2%) | 0 (0.0%) |
| $150,000 or more | 64 (11.2%) | 0 (0.0%) |
| Total | 570 (100.0%) | 204 (100.0%) |
Monthly Housing Cost Tiers in Strathmore
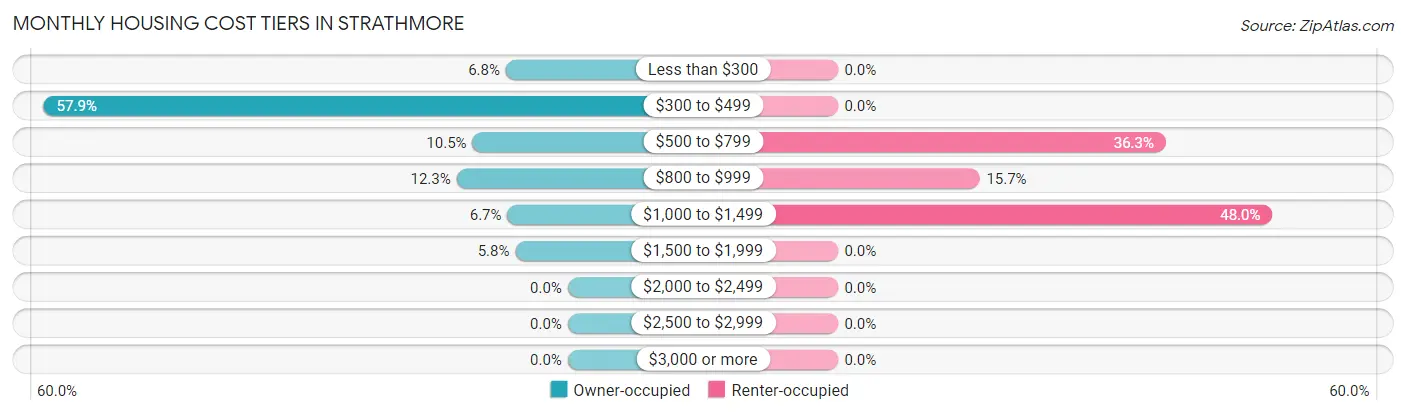
| Monthly Cost | Owner-occupied | Renter-occupied |
| Less than $300 | 39 (6.8%) | 0 (0.0%) |
| $300 to $499 | 330 (57.9%) | 0 (0.0%) |
| $500 to $799 | 60 (10.5%) | 74 (36.3%) |
| $800 to $999 | 70 (12.3%) | 32 (15.7%) |
| $1,000 to $1,499 | 38 (6.7%) | 98 (48.0%) |
| $1,500 to $1,999 | 33 (5.8%) | 0 (0.0%) |
| $2,000 to $2,499 | 0 (0.0%) | 0 (0.0%) |
| $2,500 to $2,999 | 0 (0.0%) | 0 (0.0%) |
| $3,000 or more | 0 (0.0%) | 0 (0.0%) |
| Total | 570 (100.0%) | 204 (100.0%) |
Physical Housing Characteristics in Strathmore
Housing Structures in Strathmore
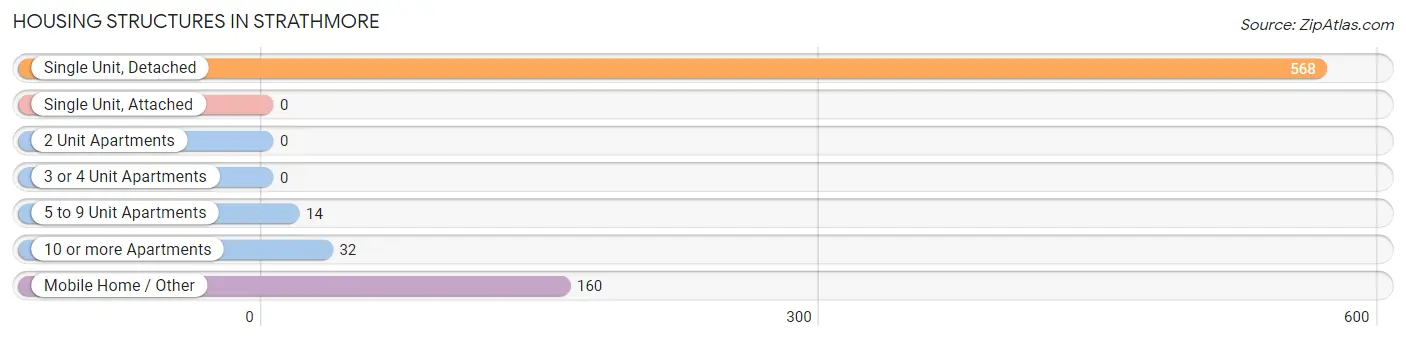
| Structure Type | # Housing Units | % Housing Units |
| Single Unit, Detached | 568 | 73.4% |
| Single Unit, Attached | 0 | 0.0% |
| 2 Unit Apartments | 0 | 0.0% |
| 3 or 4 Unit Apartments | 0 | 0.0% |
| 5 to 9 Unit Apartments | 14 | 1.8% |
| 10 or more Apartments | 32 | 4.1% |
| Mobile Home / Other | 160 | 20.7% |
| Total | 774 | 100.0% |
Housing Structures by Occupancy in Strathmore
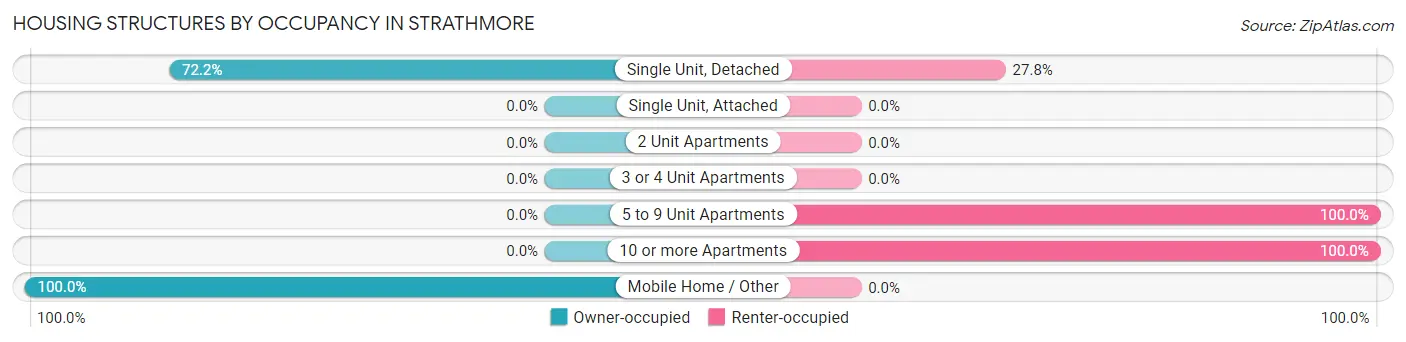
| Structure Type | Owner-occupied | Renter-occupied |
| Single Unit, Detached | 410 (72.2%) | 158 (27.8%) |
| Single Unit, Attached | 0 (0.0%) | 0 (0.0%) |
| 2 Unit Apartments | 0 (0.0%) | 0 (0.0%) |
| 3 or 4 Unit Apartments | 0 (0.0%) | 0 (0.0%) |
| 5 to 9 Unit Apartments | 0 (0.0%) | 14 (100.0%) |
| 10 or more Apartments | 0 (0.0%) | 32 (100.0%) |
| Mobile Home / Other | 160 (100.0%) | 0 (0.0%) |
| Total | 570 (73.6%) | 204 (26.4%) |
Housing Structures by Number of Rooms in Strathmore
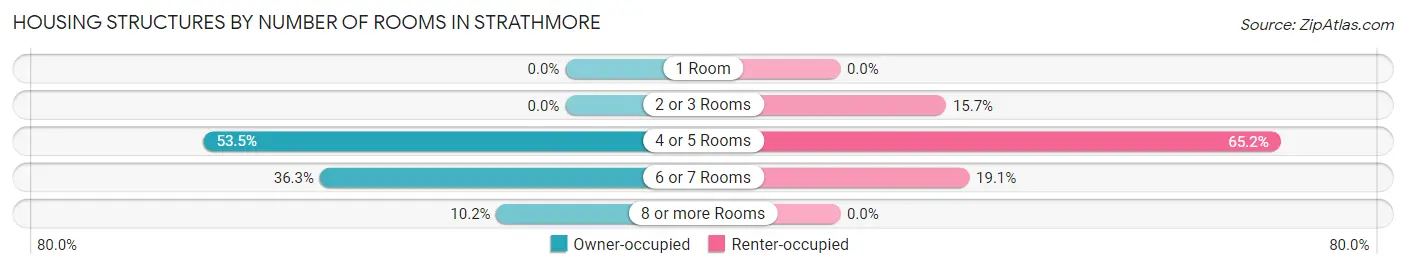
| Number of Rooms | Owner-occupied | Renter-occupied |
| 1 Room | 0 (0.0%) | 0 (0.0%) |
| 2 or 3 Rooms | 0 (0.0%) | 32 (15.7%) |
| 4 or 5 Rooms | 305 (53.5%) | 133 (65.2%) |
| 6 or 7 Rooms | 207 (36.3%) | 39 (19.1%) |
| 8 or more Rooms | 58 (10.2%) | 0 (0.0%) |
| Total | 570 (100.0%) | 204 (100.0%) |
Housing Structure by Heating Type in Strathmore
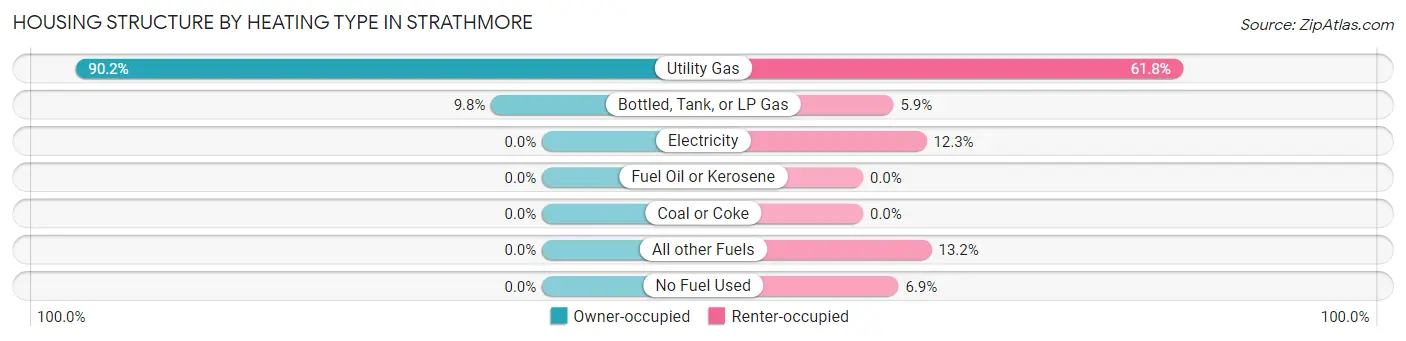
| Heating Type | Owner-occupied | Renter-occupied |
| Utility Gas | 514 (90.2%) | 126 (61.8%) |
| Bottled, Tank, or LP Gas | 56 (9.8%) | 12 (5.9%) |
| Electricity | 0 (0.0%) | 25 (12.2%) |
| Fuel Oil or Kerosene | 0 (0.0%) | 0 (0.0%) |
| Coal or Coke | 0 (0.0%) | 0 (0.0%) |
| All other Fuels | 0 (0.0%) | 27 (13.2%) |
| No Fuel Used | 0 (0.0%) | 14 (6.9%) |
| Total | 570 (100.0%) | 204 (100.0%) |
Household Vehicle Usage in Strathmore
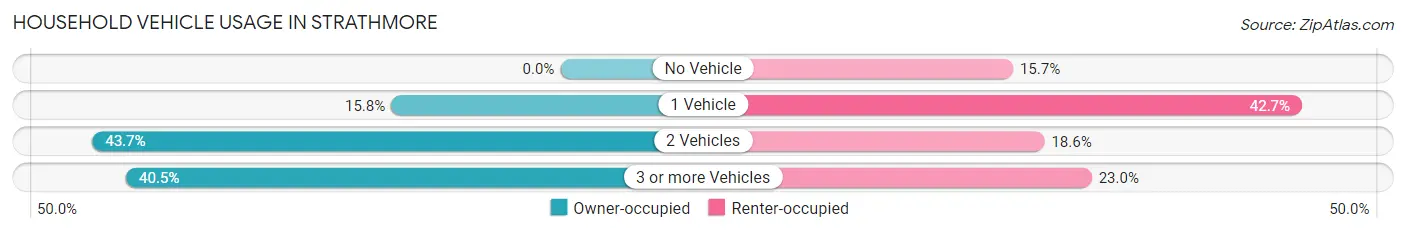
| Vehicles per Household | Owner-occupied | Renter-occupied |
| No Vehicle | 0 (0.0%) | 32 (15.7%) |
| 1 Vehicle | 90 (15.8%) | 87 (42.6%) |
| 2 Vehicles | 249 (43.7%) | 38 (18.6%) |
| 3 or more Vehicles | 231 (40.5%) | 47 (23.0%) |
| Total | 570 (100.0%) | 204 (100.0%) |
Real Estate & Mortgages in Strathmore
Real Estate and Mortgage Overview in Strathmore
| Characteristic | Without Mortgage | With Mortgage |
| Housing Units | 447 | 123 |
| Median Property Value | - | - |
| Median Household Income | $42,420 | $33 |
| Monthly Housing Costs | $393 | $0 |
| Real Estate Taxes | $1,048 | $0 |
Property Value by Mortgage Status in Strathmore
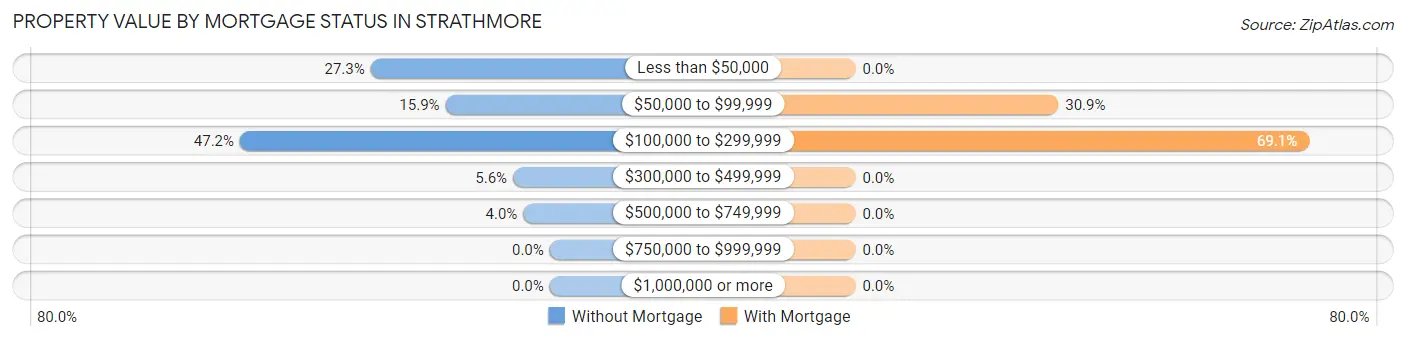
| Property Value | Without Mortgage | With Mortgage |
| Less than $50,000 | 122 (27.3%) | 0 (0.0%) |
| $50,000 to $99,999 | 71 (15.9%) | 38 (30.9%) |
| $100,000 to $299,999 | 211 (47.2%) | 85 (69.1%) |
| $300,000 to $499,999 | 25 (5.6%) | 0 (0.0%) |
| $500,000 to $749,999 | 18 (4.0%) | 0 (0.0%) |
| $750,000 to $999,999 | 0 (0.0%) | 0 (0.0%) |
| $1,000,000 or more | 0 (0.0%) | 0 (0.0%) |
| Total | 447 (100.0%) | 123 (100.0%) |
Household Income by Mortgage Status in Strathmore
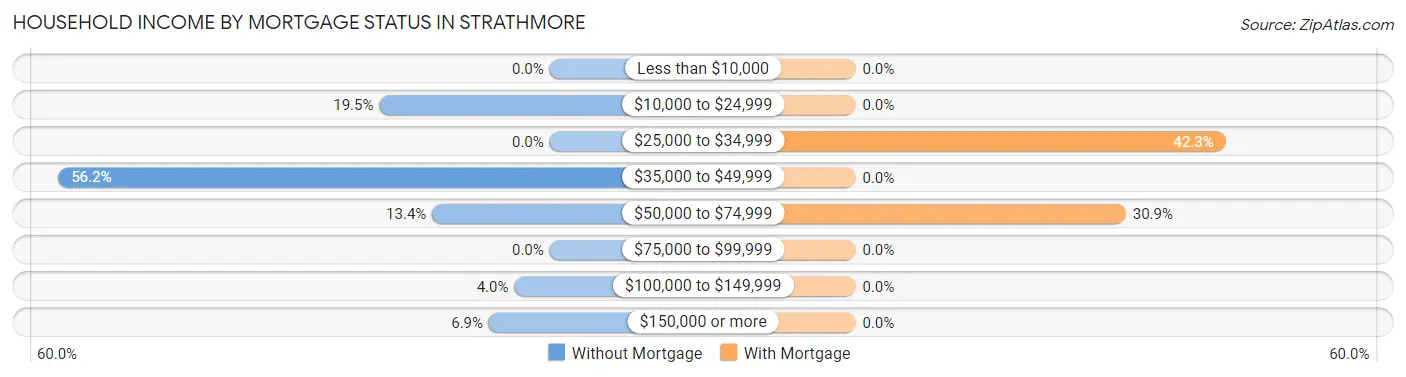
| Household Income | Without Mortgage | With Mortgage |
| Less than $10,000 | 0 (0.0%) | 0 (0.0%) |
| $10,000 to $24,999 | 87 (19.5%) | 0 (0.0%) |
| $25,000 to $34,999 | 0 (0.0%) | 52 (42.3%) |
| $35,000 to $49,999 | 251 (56.1%) | 0 (0.0%) |
| $50,000 to $74,999 | 60 (13.4%) | 38 (30.9%) |
| $75,000 to $99,999 | 0 (0.0%) | 0 (0.0%) |
| $100,000 to $149,999 | 18 (4.0%) | 0 (0.0%) |
| $150,000 or more | 31 (6.9%) | 0 (0.0%) |
| Total | 447 (100.0%) | 123 (100.0%) |
Property Value to Household Income Ratio in Strathmore
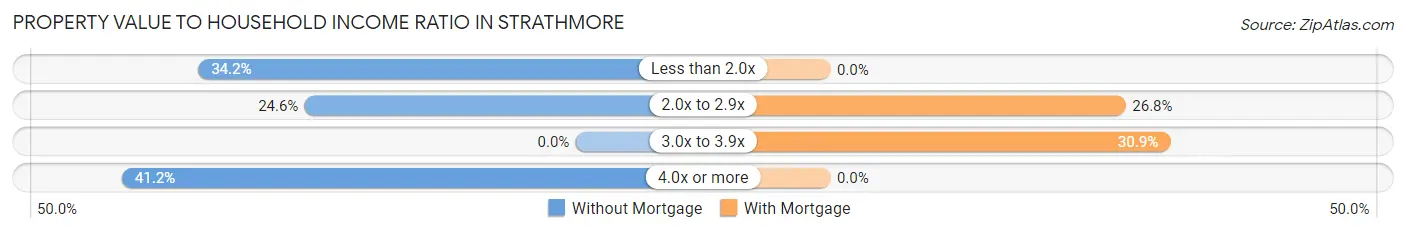
| Value-to-Income Ratio | Without Mortgage | With Mortgage |
| Less than 2.0x | 153 (34.2%) | 0 (0.0%) |
| 2.0x to 2.9x | 110 (24.6%) | 33 (26.8%) |
| 3.0x to 3.9x | 0 (0.0%) | 38 (30.9%) |
| 4.0x or more | 184 (41.2%) | 0 (0.0%) |
| Total | 447 (100.0%) | 123 (100.0%) |
Real Estate Taxes by Mortgage Status in Strathmore
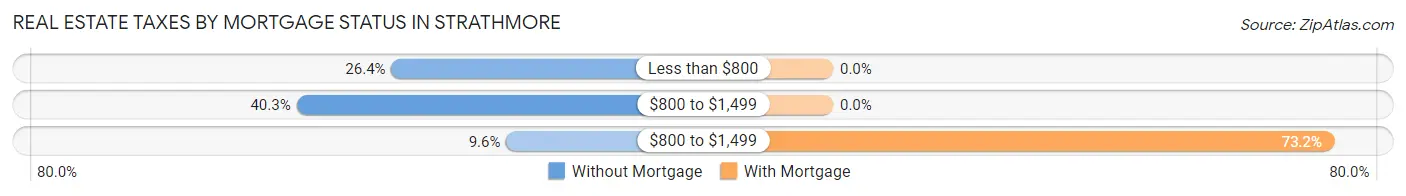
| Property Taxes | Without Mortgage | With Mortgage |
| Less than $800 | 118 (26.4%) | 0 (0.0%) |
| $800 to $1,499 | 180 (40.3%) | 0 (0.0%) |
| $800 to $1,499 | 43 (9.6%) | 90 (73.2%) |
| Total | 447 (100.0%) | 123 (100.0%) |
Health & Disability in Strathmore
Health Insurance Coverage by Age in Strathmore
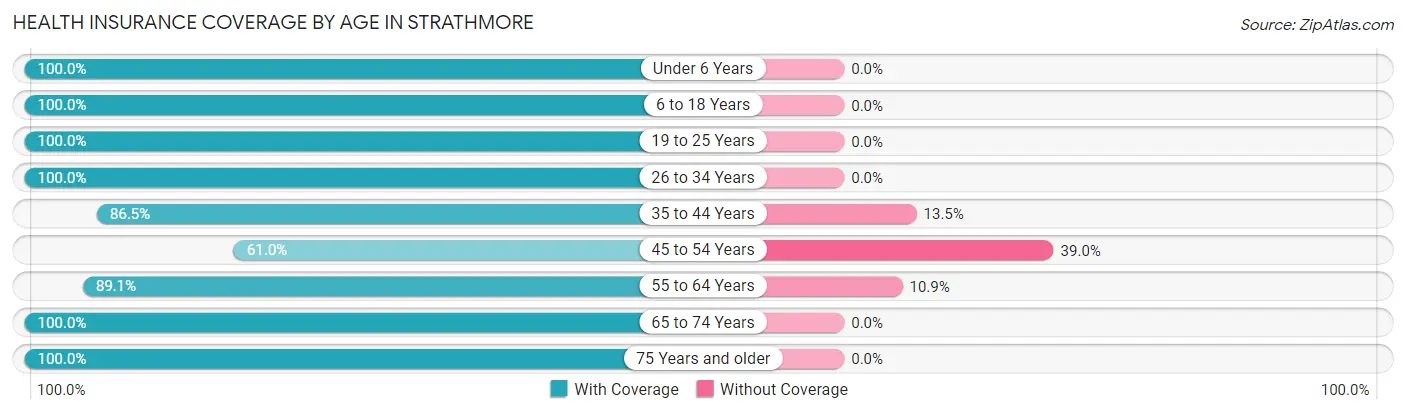
| Age Bracket | With Coverage | Without Coverage |
| Under 6 Years | 181 (100.0%) | 0 (0.0%) |
| 6 to 18 Years | 966 (100.0%) | 0 (0.0%) |
| 19 to 25 Years | 143 (100.0%) | 0 (0.0%) |
| 26 to 34 Years | 174 (100.0%) | 0 (0.0%) |
| 35 to 44 Years | 308 (86.5%) | 48 (13.5%) |
| 45 to 54 Years | 153 (61.0%) | 98 (39.0%) |
| 55 to 64 Years | 624 (89.1%) | 76 (10.9%) |
| 65 to 74 Years | 101 (100.0%) | 0 (0.0%) |
| 75 Years and older | 121 (100.0%) | 0 (0.0%) |
| Total | 2,771 (92.6%) | 222 (7.4%) |
Health Insurance Coverage by Citizenship Status in Strathmore
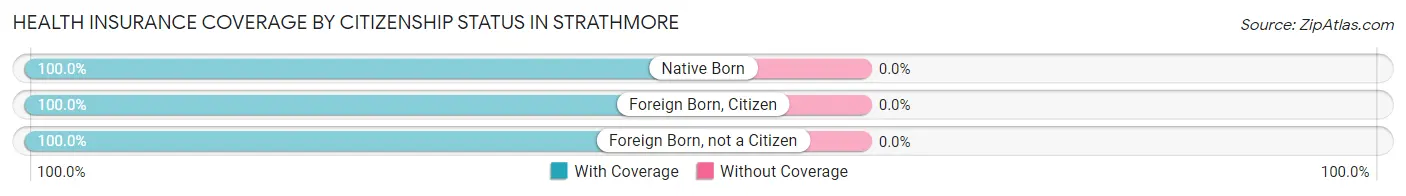
| Citizenship Status | With Coverage | Without Coverage |
| Native Born | 181 (100.0%) | 0 (0.0%) |
| Foreign Born, Citizen | 966 (100.0%) | 0 (0.0%) |
| Foreign Born, not a Citizen | 143 (100.0%) | 0 (0.0%) |
Health Insurance Coverage by Household Income in Strathmore
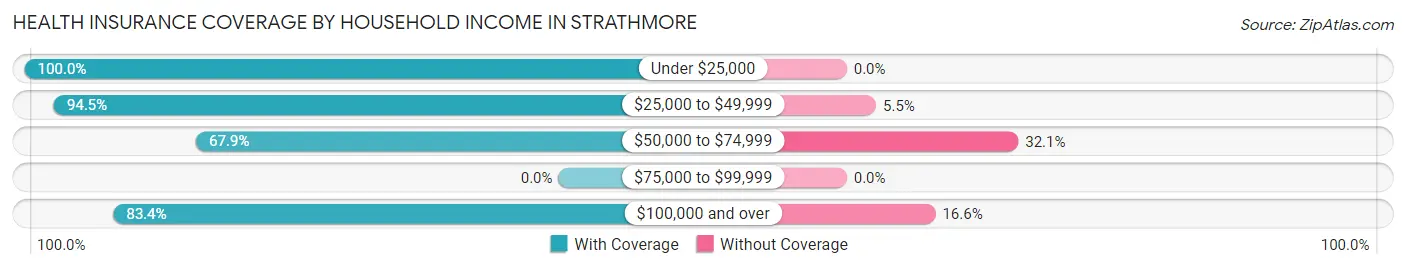
| Household Income | With Coverage | Without Coverage |
| Under $25,000 | 777 (100.0%) | 0 (0.0%) |
| $25,000 to $49,999 | 1,533 (94.5%) | 89 (5.5%) |
| $50,000 to $74,999 | 150 (67.9%) | 71 (32.1%) |
| $75,000 to $99,999 | 0 (0.0%) | 0 (0.0%) |
| $100,000 and over | 311 (83.4%) | 62 (16.6%) |
Public vs Private Health Insurance Coverage by Age in Strathmore
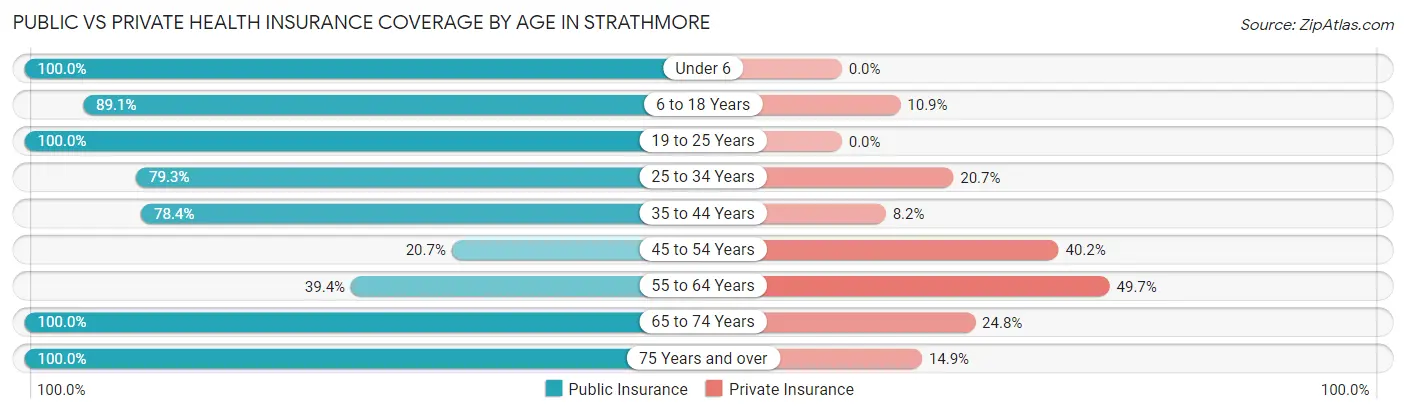
| Age Bracket | Public Insurance | Private Insurance |
| Under 6 | 181 (100.0%) | 0 (0.0%) |
| 6 to 18 Years | 861 (89.1%) | 105 (10.9%) |
| 19 to 25 Years | 143 (100.0%) | 0 (0.0%) |
| 25 to 34 Years | 138 (79.3%) | 36 (20.7%) |
| 35 to 44 Years | 279 (78.4%) | 29 (8.2%) |
| 45 to 54 Years | 52 (20.7%) | 101 (40.2%) |
| 55 to 64 Years | 276 (39.4%) | 348 (49.7%) |
| 65 to 74 Years | 101 (100.0%) | 25 (24.7%) |
| 75 Years and over | 121 (100.0%) | 18 (14.9%) |
| Total | 2,152 (71.9%) | 662 (22.1%) |
Disability Status by Sex by Age in Strathmore
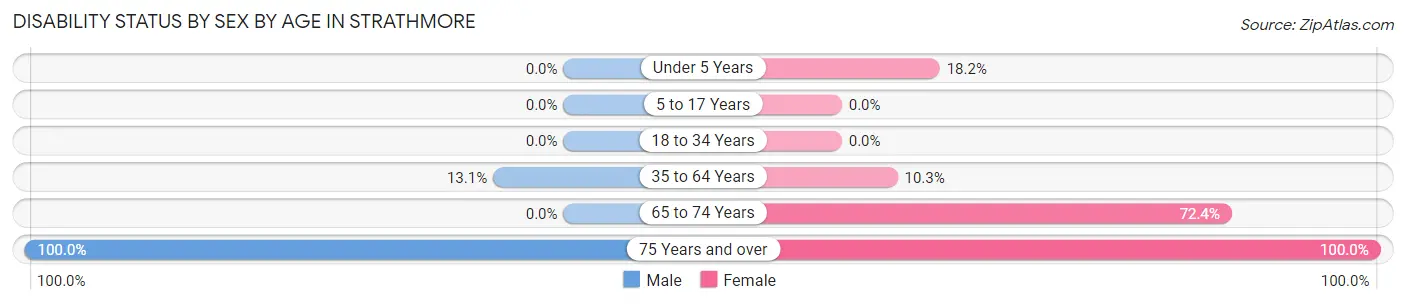
| Age Bracket | Male | Female |
| Under 5 Years | 0 (0.0%) | 24 (18.2%) |
| 5 to 17 Years | 0 (0.0%) | 0 (0.0%) |
| 18 to 34 Years | 0 (0.0%) | 0 (0.0%) |
| 35 to 64 Years | 76 (13.1%) | 75 (10.3%) |
| 65 to 74 Years | 0 (0.0%) | 55 (72.4%) |
| 75 Years and over | 71 (100.0%) | 50 (100.0%) |
Disability Class by Sex by Age in Strathmore
Disability Class: Hearing Difficulty
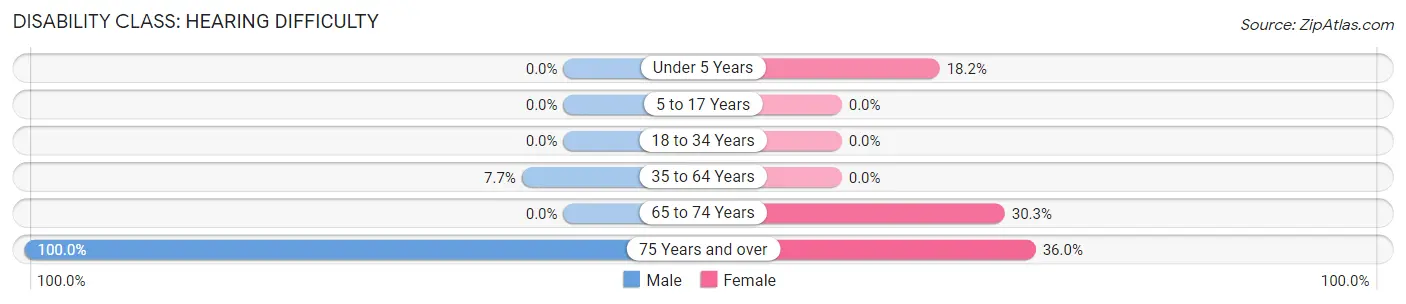
| Age Bracket | Male | Female |
| Under 5 Years | 0 (0.0%) | 24 (18.2%) |
| 5 to 17 Years | 0 (0.0%) | 0 (0.0%) |
| 18 to 34 Years | 0 (0.0%) | 0 (0.0%) |
| 35 to 64 Years | 45 (7.7%) | 0 (0.0%) |
| 65 to 74 Years | 0 (0.0%) | 23 (30.3%) |
| 75 Years and over | 71 (100.0%) | 18 (36.0%) |
Disability Class: Vision Difficulty
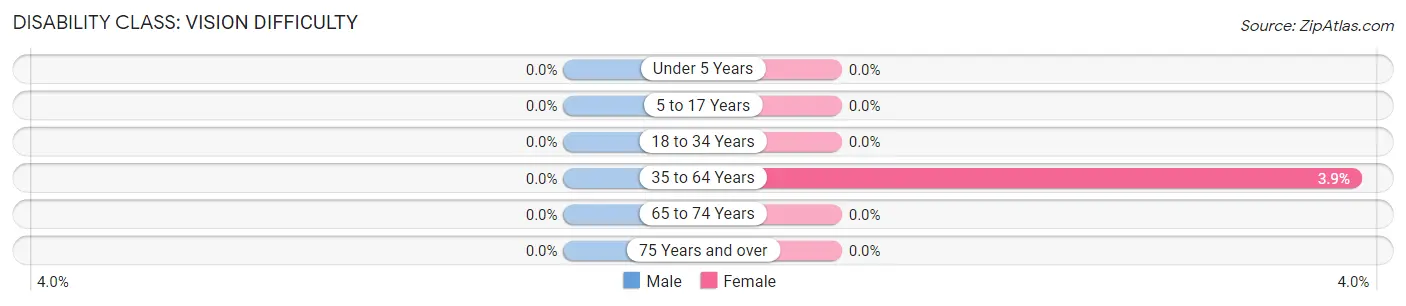
| Age Bracket | Male | Female |
| Under 5 Years | 0 (0.0%) | 0 (0.0%) |
| 5 to 17 Years | 0 (0.0%) | 0 (0.0%) |
| 18 to 34 Years | 0 (0.0%) | 0 (0.0%) |
| 35 to 64 Years | 0 (0.0%) | 28 (3.9%) |
| 65 to 74 Years | 0 (0.0%) | 0 (0.0%) |
| 75 Years and over | 0 (0.0%) | 0 (0.0%) |
Disability Class: Cognitive Difficulty
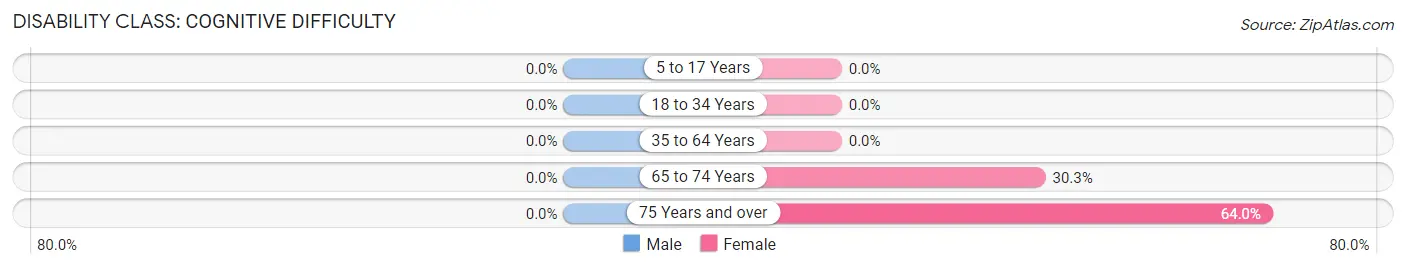
| Age Bracket | Male | Female |
| 5 to 17 Years | 0 (0.0%) | 0 (0.0%) |
| 18 to 34 Years | 0 (0.0%) | 0 (0.0%) |
| 35 to 64 Years | 0 (0.0%) | 0 (0.0%) |
| 65 to 74 Years | 0 (0.0%) | 23 (30.3%) |
| 75 Years and over | 0 (0.0%) | 32 (64.0%) |
Disability Class: Ambulatory Difficulty
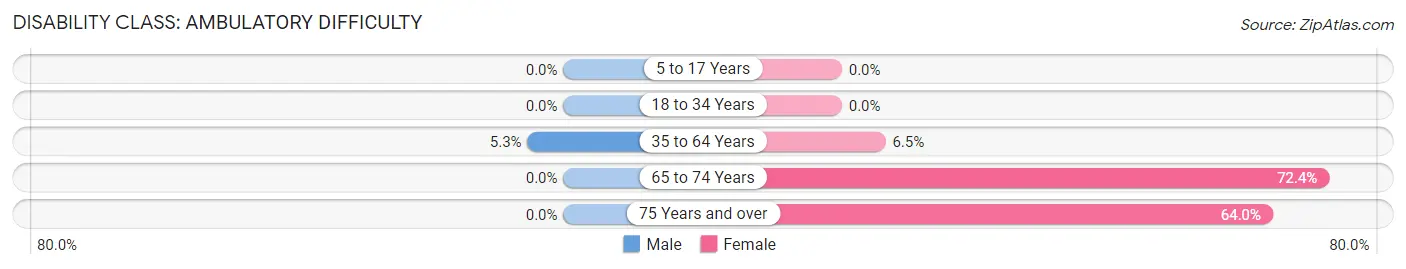
| Age Bracket | Male | Female |
| 5 to 17 Years | 0 (0.0%) | 0 (0.0%) |
| 18 to 34 Years | 0 (0.0%) | 0 (0.0%) |
| 35 to 64 Years | 31 (5.3%) | 47 (6.5%) |
| 65 to 74 Years | 0 (0.0%) | 55 (72.4%) |
| 75 Years and over | 0 (0.0%) | 32 (64.0%) |
Disability Class: Self-Care Difficulty
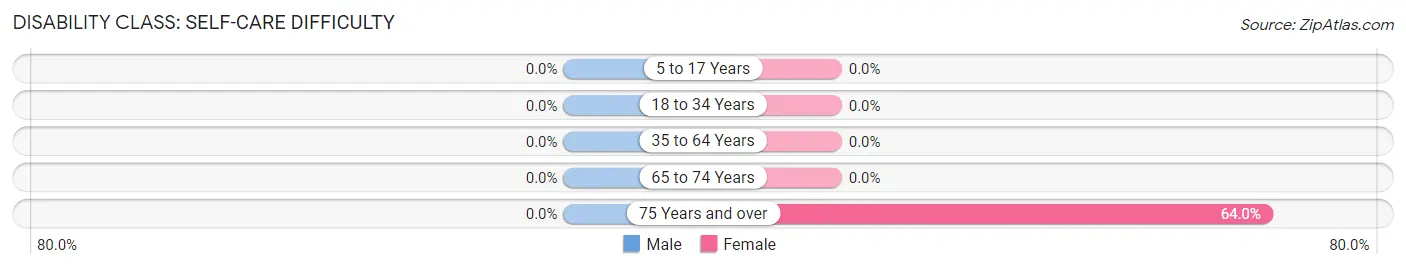
| Age Bracket | Male | Female |
| 5 to 17 Years | 0 (0.0%) | 0 (0.0%) |
| 18 to 34 Years | 0 (0.0%) | 0 (0.0%) |
| 35 to 64 Years | 0 (0.0%) | 0 (0.0%) |
| 65 to 74 Years | 0 (0.0%) | 0 (0.0%) |
| 75 Years and over | 0 (0.0%) | 32 (64.0%) |
Technology Access in Strathmore
Computing Device Access in Strathmore
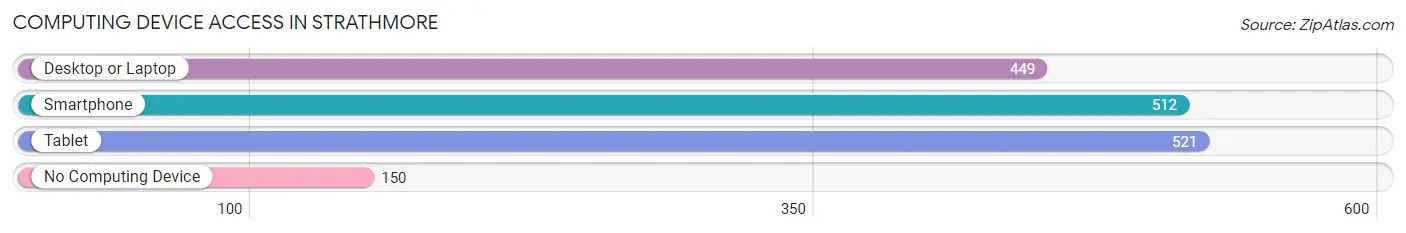
| Device Type | # Households | % Households |
| Desktop or Laptop | 449 | 58.0% |
| Smartphone | 512 | 66.1% |
| Tablet | 521 | 67.3% |
| No Computing Device | 150 | 19.4% |
| Total | 774 | 100.0% |
Internet Access in Strathmore
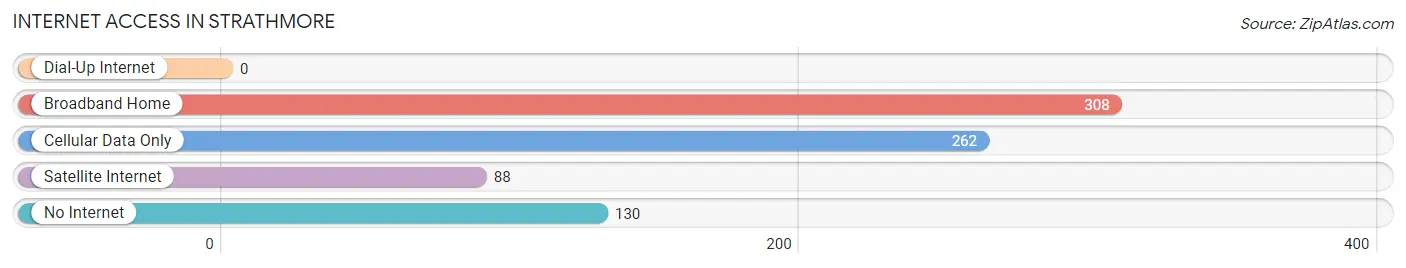
| Internet Type | # Households | % Households |
| Dial-Up Internet | 0 | 0.0% |
| Broadband Home | 308 | 39.8% |
| Cellular Data Only | 262 | 33.9% |
| Satellite Internet | 88 | 11.4% |
| No Internet | 130 | 16.8% |
| Total | 774 | 100.0% |
Strathmore Summary
Strathmore is a small town located in Tulare County, California, United States. It is situated in the San Joaquin Valley, approximately 8 miles east of Porterville and about 40 miles south of Fresno. The population of Strathmore was 2,945 at the 2010 census, up from 2,717 at the 2000 census.
History
Strathmore was founded in the late 1800s by a group of Scottish settlers who named the town after their homeland. The town was originally a farming community, and the main crops grown were wheat, barley, and oats. In the early 1900s, the town began to grow and expand, and by the 1920s, it had become a thriving agricultural center.
In the 1950s, Strathmore began to experience a population boom, as many people moved to the area to take advantage of the fertile soil and the mild climate. The town was incorporated in 1959, and the population continued to grow throughout the 1960s and 1970s.
Geography
Strathmore is located at 36°14′N 119°17′W (36.23, -119.28). According to the United States Census Bureau, the town has a total area of 1.2 square miles (3.2 km2), all of it land.
Economy
Strathmore’s economy is largely based on agriculture. The town is home to a variety of farms, including dairy, poultry, and vegetable farms. The town also has a number of small businesses, including restaurants, grocery stores, and retail stores.
Demographics
As of the 2010 census, there were 2,945 people, 1,072 households, and 745 families residing in the town. The population density was 2,457.3 people per square mile (948.2/km2). There were 1,164 housing units at an average density of 971.7 per square mile (374.7/km2). The racial makeup of the town was 68.2% White, 0.7% African American, 1.2% Native American, 0.7% Asian, 0.1% Pacific Islander, 25.7% from other races, and 3.4% from two or more races. Hispanic or Latino of any race were 44.2% of the population.
There were 1,072 households, out of which 37.2% had children under the age of 18 living with them, 48.2% were married couples living together, 15.2% had a female householder with no husband present, and 29.7% were non-families. 24.2% of all households were made up of individuals, and 11.2% had someone living alone who was 65 years of age or older. The average household size was 2.75 and the average family size was 3.27.
In the town, the population was spread out, with 30.2% under the age of 18, 9.2% from 18 to 24, 25.3% from 25 to 44, 21.2% from 45 to 64, and 14.1% who were 65 years of age or older. The median age was 34 years. For every 100 females, there were 97.2 males. For every 100 females age 18 and over, there were 94.2 males.
The median income for a household in the town was $30,938, and the median income for a family was $35,000. Males had a median income of $30,000 versus $20,000 for females. The per capita income for the town was $13,845. About 17.2% of families and 20.2% of the population were below the poverty line, including 28.2% of those under age 18 and 11.2% of those age 65 or over.
Common Questions
What is Per Capita Income in Strathmore?
Per Capita income in Strathmore is $12,040.
What is the Median Family Income in Strathmore?
Median Family Income in Strathmore is $40,851.
What is the Median Household income in Strathmore?
Median Household Income in Strathmore is $40,106.
What is Inequality or Gini Index in Strathmore?
Inequality or Gini Index in Strathmore is 0.44.
What is the Total Population of Strathmore?
Total Population of Strathmore is 2,993.
What is the Total Male Population of Strathmore?
Total Male Population of Strathmore is 1,509.
What is the Total Female Population of Strathmore?
Total Female Population of Strathmore is 1,484.
What is the Ratio of Males per 100 Females in Strathmore?
There are 101.68 Males per 100 Females in Strathmore.
What is the Ratio of Females per 100 Males in Strathmore?
There are 98.34 Females per 100 Males in Strathmore.
What is the Median Population Age in Strathmore?
Median Population Age in Strathmore is 36.2 Years.
What is the Average Family Size in Strathmore
Average Family Size in Strathmore is 4.2 People.
What is the Average Household Size in Strathmore
Average Household Size in Strathmore is 3.9 People.
How Large is the Labor Force in Strathmore?
There are 631 People in the Labor Forcein in Strathmore.
What is the Percentage of People in the Labor Force in Strathmore?
30.8% of People are in the Labor Force in Strathmore.
What is the Unemployment Rate in Strathmore?
Unemployment Rate in Strathmore is 15.2%.