Cities with the Highest Percentage of Population with a Degree in Liberal Arts and History in West Virginia
RELATED REPORTS & OPTIONS
Liberal Arts and History
West Virginia
Compare Cities
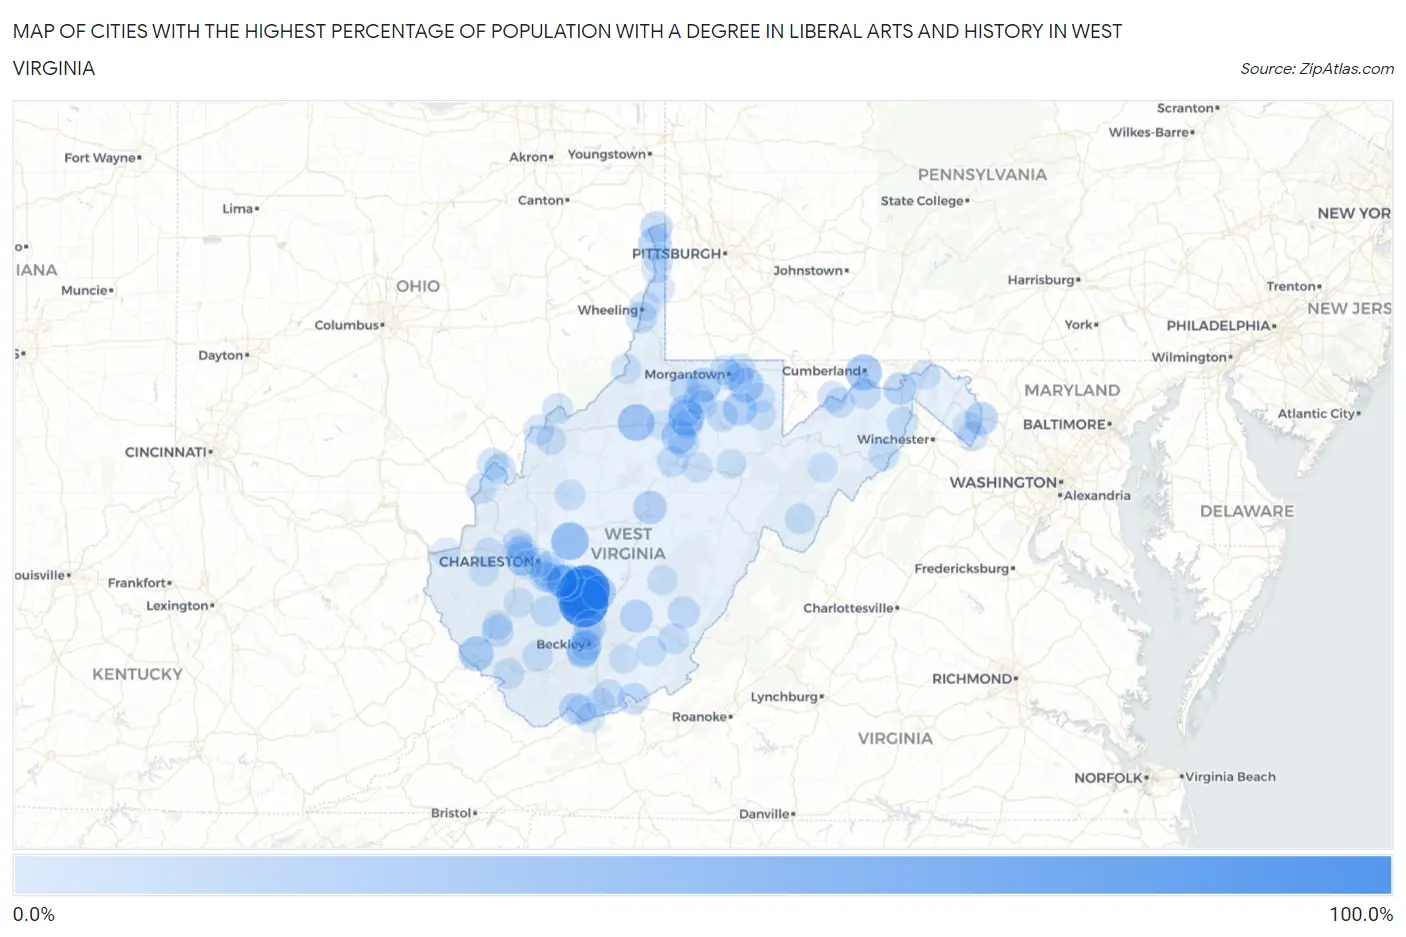
Map of Cities with the Highest Percentage of Population with a Degree in Liberal Arts and History in West Virginia
0.0%
100.0%
Cities with the Highest Percentage of Population with a Degree in Liberal Arts and History in West Virginia
| City | % Graduates | vs State | vs National | |
| 1. | Falls View | 100.0% | 4.5%(+95.5)#1 | 4.9%(+95.1)#16 |
| 2. | Greenville | 100.0% | 4.5%(+95.5)#2 | 4.9%(+95.1)#30 |
| 3. | Glen Ferris | 100.0% | 4.5%(+95.5)#3 | 4.9%(+95.1)#49 |
| 4. | Beards Fork | 100.0% | 4.5%(+95.5)#4 | 4.9%(+95.1)#66 |
| 5. | Clendenin | 40.5% | 4.5%(+36.0)#5 | 4.9%(+35.6)#372 |
| 6. | West Union | 37.2% | 4.5%(+32.7)#6 | 4.9%(+32.3)#425 |
| 7. | Pratt | 34.0% | 4.5%(+29.5)#7 | 4.9%(+29.2)#507 |
| 8. | Ridgeley | 34.0% | 4.5%(+29.4)#8 | 4.9%(+29.1)#510 |
| 9. | Hepzibah | 33.8% | 4.5%(+29.3)#9 | 4.9%(+28.9)#514 |
| 10. | Malden | 29.2% | 4.5%(+24.7)#10 | 4.9%(+24.4)#687 |
| 11. | Institute | 28.5% | 4.5%(+23.9)#11 | 4.9%(+23.6)#724 |
| 12. | Masontown | 27.5% | 4.5%(+23.0)#12 | 4.9%(+22.7)#761 |
| 13. | Delbarton | 26.5% | 4.5%(+22.0)#13 | 4.9%(+21.7)#815 |
| 14. | Grant Town | 26.1% | 4.5%(+21.6)#14 | 4.9%(+21.2)#836 |
| 15. | West Milford | 25.7% | 4.5%(+21.2)#15 | 4.9%(+20.8)#861 |
| 16. | Ansted | 24.4% | 4.5%(+19.9)#16 | 4.9%(+19.6)#941 |
| 17. | Jefferson | 23.8% | 4.5%(+19.3)#17 | 4.9%(+18.9)#972 |
| 18. | Crab Orchard | 23.3% | 4.5%(+18.8)#18 | 4.9%(+18.4)#1,014 |
| 19. | Newburg | 22.7% | 4.5%(+18.2)#19 | 4.9%(+17.9)#1,049 |
| 20. | East Bank | 22.6% | 4.5%(+18.1)#20 | 4.9%(+17.7)#1,056 |
| 21. | New Cumberland | 21.1% | 4.5%(+16.5)#21 | 4.9%(+16.2)#1,182 |
| 22. | Flatwoods | 20.5% | 4.5%(+16.0)#22 | 4.9%(+15.6)#1,226 |
| 23. | Harpers Ferry | 20.4% | 4.5%(+15.9)#23 | 4.9%(+15.5)#1,244 |
| 24. | Rainelle | 18.5% | 4.5%(+14.0)#24 | 4.9%(+13.6)#1,452 |
| 25. | Lumberport | 17.5% | 4.5%(+13.0)#25 | 4.9%(+12.6)#1,573 |
| 26. | Paw Paw | 16.7% | 4.5%(+12.2)#26 | 4.9%(+11.8)#1,706 |
| 27. | Newell | 15.7% | 4.5%(+11.2)#27 | 4.9%(+10.8)#1,912 |
| 28. | Mount Hope | 15.5% | 4.5%(+11.0)#28 | 4.9%(+10.6)#1,946 |
| 29. | West Logan | 14.8% | 4.5%(+10.3)#29 | 4.9%(+9.94)#2,083 |
| 30. | Bramwell | 14.3% | 4.5%(+9.77)#30 | 4.9%(+9.41)#2,237 |
| 31. | Sophia | 14.2% | 4.5%(+9.65)#31 | 4.9%(+9.29)#2,268 |
| 32. | Falling Spring | 13.3% | 4.5%(+8.82)#32 | 4.9%(+8.46)#2,526 |
| 33. | Peterstown | 13.2% | 4.5%(+8.70)#33 | 4.9%(+8.34)#2,553 |
| 34. | Nitro | 11.7% | 4.5%(+7.23)#34 | 4.9%(+6.87)#3,095 |
| 35. | Benwood | 11.7% | 4.5%(+7.19)#35 | 4.9%(+6.83)#3,107 |
| 36. | Glasgow | 11.5% | 4.5%(+7.03)#36 | 4.9%(+6.67)#3,168 |
| 37. | Rand | 11.3% | 4.5%(+6.78)#37 | 4.9%(+6.42)#3,271 |
| 38. | Capon Bridge | 11.1% | 4.5%(+6.60)#38 | 4.9%(+6.24)#3,352 |
| 39. | Weston | 11.0% | 4.5%(+6.50)#39 | 4.9%(+6.14)#3,418 |
| 40. | Grafton | 11.0% | 4.5%(+6.50)#40 | 4.9%(+6.14)#3,419 |
| 41. | Mason | 10.9% | 4.5%(+6.43)#41 | 4.9%(+6.07)#3,455 |
| 42. | Lost Creek | 10.9% | 4.5%(+6.43)#42 | 4.9%(+6.07)#3,458 |
| 43. | New Haven | 10.6% | 4.5%(+6.13)#43 | 4.9%(+5.77)#3,605 |
| 44. | Monongah | 10.5% | 4.5%(+6.01)#44 | 4.9%(+5.65)#3,685 |
| 45. | Athens | 10.4% | 4.5%(+5.87)#45 | 4.9%(+5.51)#3,767 |
| 46. | Sylvester | 10.3% | 4.5%(+5.74)#46 | 4.9%(+5.38)#3,842 |
| 47. | Mabscott | 10.2% | 4.5%(+5.73)#47 | 4.9%(+5.37)#3,847 |
| 48. | Mannington | 10.1% | 4.5%(+5.61)#48 | 4.9%(+5.25)#3,906 |
| 49. | Wardensville | 10.0% | 4.5%(+5.49)#49 | 4.9%(+5.13)#3,996 |
| 50. | Fort Ashby | 9.7% | 4.5%(+5.20)#50 | 4.9%(+4.84)#4,167 |
| 51. | Lewisburg | 9.7% | 4.5%(+5.16)#51 | 4.9%(+4.81)#4,181 |
| 52. | Clarksburg | 9.2% | 4.5%(+4.73)#52 | 4.9%(+4.37)#4,517 |
| 53. | Marmet | 9.1% | 4.5%(+4.62)#53 | 4.9%(+4.26)#4,604 |
| 54. | Gilbert Creek | 9.0% | 4.5%(+4.46)#54 | 4.9%(+4.10)#4,751 |
| 55. | Williamstown | 8.7% | 4.5%(+4.23)#55 | 4.9%(+3.87)#4,928 |
| 56. | Oceana | 8.5% | 4.5%(+4.02)#56 | 4.9%(+3.66)#5,103 |
| 57. | Blennerhassett | 8.3% | 4.5%(+3.80)#57 | 4.9%(+3.44)#5,352 |
| 58. | Alderson | 7.9% | 4.5%(+3.41)#58 | 4.9%(+3.05)#5,745 |
| 59. | Franklin | 7.9% | 4.5%(+3.36)#59 | 4.9%(+3.00)#5,792 |
| 60. | Point Pleasant | 7.4% | 4.5%(+2.90)#60 | 4.9%(+2.54)#6,307 |
| 61. | Piedmont | 7.4% | 4.5%(+2.89)#61 | 4.9%(+2.54)#6,317 |
| 62. | Cheat Lake | 7.4% | 4.5%(+2.85)#62 | 4.9%(+2.49)#6,381 |
| 63. | Bluewell | 7.3% | 4.5%(+2.84)#63 | 4.9%(+2.48)#6,399 |
| 64. | Keyser | 7.3% | 4.5%(+2.77)#64 | 4.9%(+2.41)#6,477 |
| 65. | Spencer | 7.2% | 4.5%(+2.73)#65 | 4.9%(+2.37)#6,522 |
| 66. | Wheeling | 6.8% | 4.5%(+2.28)#66 | 4.9%(+1.92)#7,162 |
| 67. | Prosperity | 6.8% | 4.5%(+2.28)#67 | 4.9%(+1.92)#7,164 |
| 68. | Cross Lanes | 6.6% | 4.5%(+2.10)#68 | 4.9%(+1.74)#7,438 |
| 69. | Buckhannon | 6.4% | 4.5%(+1.84)#69 | 4.9%(+1.48)#7,811 |
| 70. | New Martinsville | 6.3% | 4.5%(+1.78)#70 | 4.9%(+1.42)#7,896 |
| 71. | Belle | 6.2% | 4.5%(+1.68)#71 | 4.9%(+1.32)#8,087 |
| 72. | Poca | 6.0% | 4.5%(+1.53)#72 | 4.9%(+1.17)#8,323 |
| 73. | Brookhaven | 6.0% | 4.5%(+1.51)#73 | 4.9%(+1.15)#8,360 |
| 74. | Shannondale | 6.0% | 4.5%(+1.50)#74 | 4.9%(+1.14)#8,376 |
| 75. | Bath Berkeley Springs | 6.0% | 4.5%(+1.45)#75 | 4.9%(+1.09)#8,470 |
| 76. | Mineralwells | 5.9% | 4.5%(+1.42)#76 | 4.9%(+1.06)#8,515 |
| 77. | Kingwood | 5.8% | 4.5%(+1.32)#77 | 4.9%(+0.961)#8,714 |
| 78. | Culloden | 5.8% | 4.5%(+1.26)#78 | 4.9%(+0.904)#8,821 |
| 79. | Rowlesburg | 5.7% | 4.5%(+1.15)#79 | 4.9%(+0.788)#9,048 |
| 80. | Coal Fork | 5.6% | 4.5%(+1.13)#80 | 4.9%(+0.773)#9,075 |
| 81. | Belington | 5.5% | 4.5%(+0.967)#81 | 4.9%(+0.607)#9,404 |
| 82. | Richwood | 5.4% | 4.5%(+0.867)#82 | 4.9%(+0.508)#9,593 |
| 83. | Charles Town | 5.3% | 4.5%(+0.832)#83 | 4.9%(+0.472)#9,668 |
| 84. | Salem | 5.3% | 4.5%(+0.831)#84 | 4.9%(+0.471)#9,671 |
| 85. | White Hall | 5.3% | 4.5%(+0.827)#85 | 4.9%(+0.468)#9,686 |
| 86. | Charleston | 5.3% | 4.5%(+0.769)#86 | 4.9%(+0.409)#9,784 |
| 87. | Huntington | 5.2% | 4.5%(+0.722)#87 | 4.9%(+0.363)#9,915 |
| 88. | Weirton | 5.2% | 4.5%(+0.638)#88 | 4.9%(+0.278)#10,087 |
| 89. | Star City | 5.1% | 4.5%(+0.599)#89 | 4.9%(+0.240)#10,162 |
| 90. | South Charleston | 5.1% | 4.5%(+0.594)#90 | 4.9%(+0.234)#10,176 |
| 91. | Mitchell Heights | 5.1% | 4.5%(+0.590)#91 | 4.9%(+0.230)#10,187 |
| 92. | Bethany | 5.0% | 4.5%(+0.452)#92 | 4.9%(+0.092)#10,488 |
| 93. | Madison | 4.9% | 4.5%(+0.417)#93 | 4.9%(+0.057)#10,564 |
| 94. | Morgantown | 4.9% | 4.5%(+0.413)#94 | 4.9%(+0.054)#10,573 |
| 95. | Petersburg | 4.9% | 4.5%(+0.376)#95 | 4.9%(+0.017)#10,667 |
| 96. | Hamlin | 4.9% | 4.5%(+0.349)#96 | 4.9%(-0.011)#10,746 |
| 97. | Princeton | 4.7% | 4.5%(+0.221)#97 | 4.9%(-0.139)#11,045 |
| 98. | Bluefield | 4.7% | 4.5%(+0.194)#98 | 4.9%(-0.166)#11,097 |
| 99. | Follansbee | 4.7% | 4.5%(+0.190)#99 | 4.9%(-0.170)#11,111 |
| 100. | Hinton | 4.7% | 4.5%(+0.170)#100 | 4.9%(-0.190)#11,161 |
Common Questions
What are the Top 10 Cities with the Highest Percentage of Population with a Degree in Liberal Arts and History in West Virginia?
Top 10 Cities with the Highest Percentage of Population with a Degree in Liberal Arts and History in West Virginia are:
#1
100.0%
#2
100.0%
#3
100.0%
#4
40.5%
#5
37.2%
#6
34.0%
#7
34.0%
#8
33.8%
#9
27.5%
#10
26.5%
What city has the Highest Percentage of Population with a Degree in Liberal Arts and History in West Virginia?
Falls View has the Highest Percentage of Population with a Degree in Liberal Arts and History in West Virginia with 100.0%.
What is the Percentage of Population with a Degree in Liberal Arts and History in the State of West Virginia?
Percentage of Population with a Degree in Liberal Arts and History in West Virginia is 4.5%.
What is the Percentage of Population with a Degree in Liberal Arts and History in the United States?
Percentage of Population with a Degree in Liberal Arts and History in the United States is 4.9%.