Cities with the Highest Percentage of Population with a Degree in Liberal Arts and History in Alabama
RELATED REPORTS & OPTIONS
Liberal Arts and History
Alabama
Compare Cities
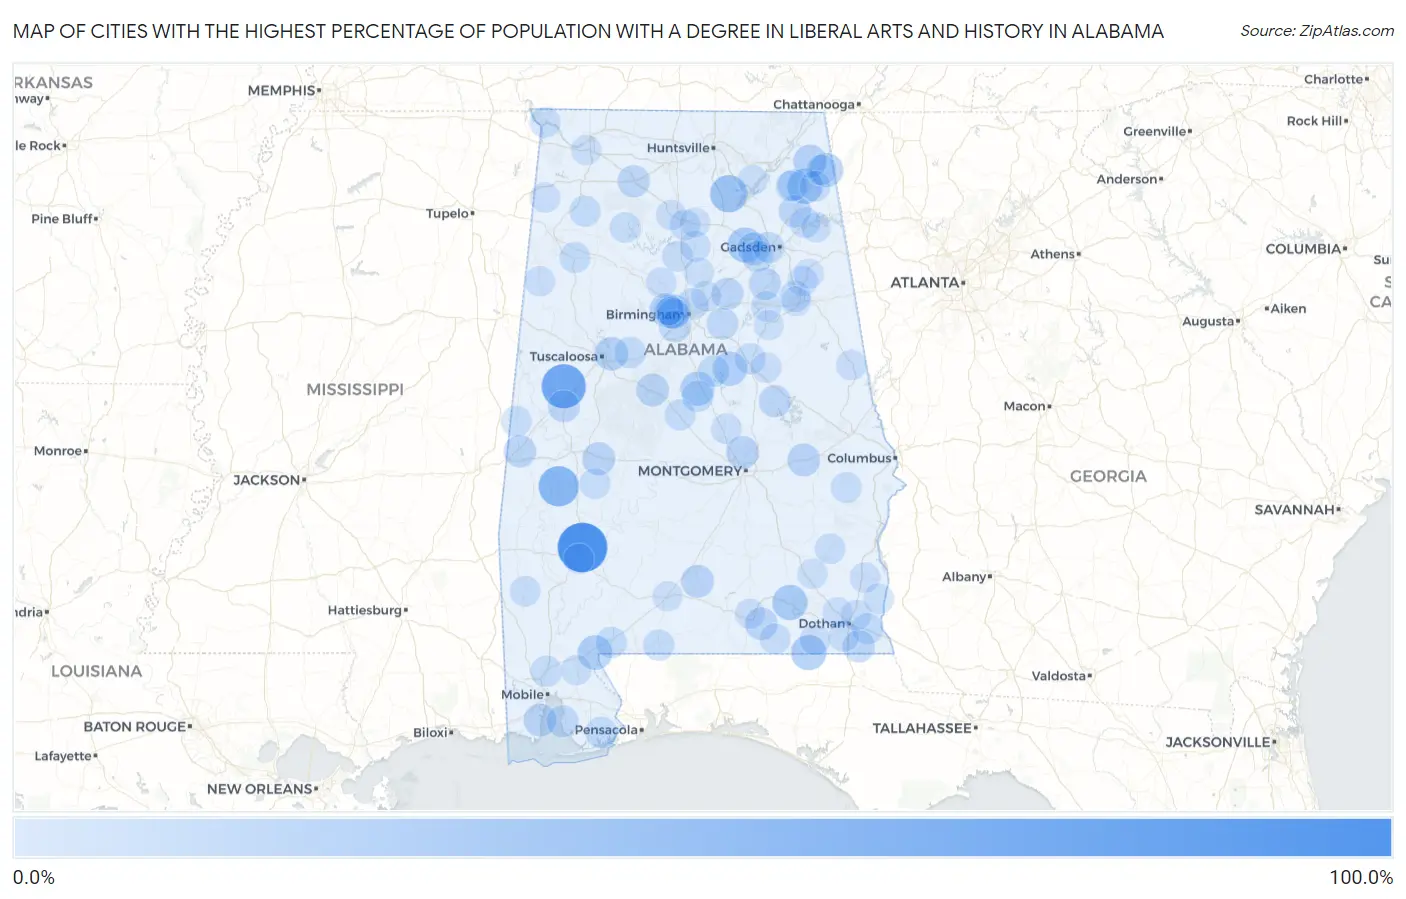
Map of Cities with the Highest Percentage of Population with a Degree in Liberal Arts and History in Alabama
0.0%
100.0%
Cities with the Highest Percentage of Population with a Degree in Liberal Arts and History in Alabama
| City | % Graduates | vs State | vs National | |
| 1. | Fulton | 90.0% | 4.6%(+85.4)#1 | 4.9%(+85.1)#95 |
| 2. | Union | 66.7% | 4.6%(+62.1)#2 | 4.9%(+61.8)#138 |
| 3. | Myrtlewood | 50.0% | 4.6%(+45.4)#3 | 4.9%(+45.1)#259 |
| 4. | Union Grove | 37.5% | 4.6%(+32.9)#4 | 4.9%(+32.6)#423 |
| 5. | Pine Ridge | 29.3% | 4.6%(+24.7)#5 | 4.9%(+24.4)#685 |
| 6. | New Brockton | 29.1% | 4.6%(+24.6)#6 | 4.9%(+24.3)#693 |
| 7. | Black | 28.6% | 4.6%(+24.0)#7 | 4.9%(+23.7)#707 |
| 8. | Altoona | 28.4% | 4.6%(+23.9)#8 | 4.9%(+23.5)#725 |
| 9. | Perdido | 26.7% | 4.6%(+22.1)#9 | 4.9%(+21.8)#807 |
| 10. | Talladega Springs | 25.0% | 4.6%(+20.4)#10 | 4.9%(+20.1)#909 |
| 11. | Jemison | 24.6% | 4.6%(+20.1)#11 | 4.9%(+19.7)#933 |
| 12. | Mentone | 23.7% | 4.6%(+19.2)#12 | 4.9%(+18.8)#980 |
| 13. | Maytown | 22.2% | 4.6%(+17.7)#13 | 4.9%(+17.4)#1,082 |
| 14. | Holt | 22.1% | 4.6%(+17.5)#14 | 4.9%(+17.2)#1,107 |
| 15. | Minor | 22.0% | 4.6%(+17.4)#15 | 4.9%(+17.1)#1,114 |
| 16. | Henagar | 21.5% | 4.6%(+17.0)#16 | 4.9%(+16.7)#1,140 |
| 17. | Faunsdale | 20.0% | 4.6%(+15.4)#17 | 4.9%(+15.1)#1,301 |
| 18. | Coosada | 19.6% | 4.6%(+15.1)#18 | 4.9%(+14.8)#1,328 |
| 19. | Centreville | 19.5% | 4.6%(+14.9)#19 | 4.9%(+14.6)#1,341 |
| 20. | Mckenzie | 19.4% | 4.6%(+14.9)#20 | 4.9%(+14.6)#1,346 |
| 21. | Belle Fontaine | 19.3% | 4.6%(+14.7)#21 | 4.9%(+14.4)#1,361 |
| 22. | Franklin | 19.2% | 4.6%(+14.7)#22 | 4.9%(+14.4)#1,364 |
| 23. | Gallant | 19.1% | 4.6%(+14.6)#23 | 4.9%(+14.3)#1,379 |
| 24. | Kinston | 18.5% | 4.6%(+13.9)#24 | 4.9%(+13.6)#1,455 |
| 25. | York | 17.7% | 4.6%(+13.2)#25 | 4.9%(+12.9)#1,550 |
| 26. | Moulton | 17.0% | 4.6%(+12.4)#26 | 4.9%(+12.1)#1,663 |
| 27. | Collinsville | 16.9% | 4.6%(+12.3)#27 | 4.9%(+12.0)#1,673 |
| 28. | Cottonwood | 16.5% | 4.6%(+11.9)#28 | 4.9%(+11.6)#1,773 |
| 29. | Ray | 16.3% | 4.6%(+11.7)#29 | 4.9%(+11.4)#1,803 |
| 30. | Margaret | 16.2% | 4.6%(+11.6)#30 | 4.9%(+11.3)#1,819 |
| 31. | Ragland | 16.1% | 4.6%(+11.6)#31 | 4.9%(+11.3)#1,825 |
| 32. | Eutaw | 16.1% | 4.6%(+11.6)#32 | 4.9%(+11.2)#1,832 |
| 33. | Lipscomb | 16.0% | 4.6%(+11.4)#33 | 4.9%(+11.1)#1,860 |
| 34. | Edgewater | 15.5% | 4.6%(+10.9)#34 | 4.9%(+10.6)#1,949 |
| 35. | Point Clear | 15.4% | 4.6%(+10.8)#35 | 4.9%(+10.5)#1,990 |
| 36. | Vandiver | 14.7% | 4.6%(+10.2)#36 | 4.9%(+9.85)#2,099 |
| 37. | Elberta | 14.3% | 4.6%(+9.73)#37 | 4.9%(+9.41)#2,190 |
| 38. | Shiloh | 14.3% | 4.6%(+9.73)#38 | 4.9%(+9.41)#2,205 |
| 39. | Brookwood | 14.3% | 4.6%(+9.70)#39 | 4.9%(+9.38)#2,257 |
| 40. | Shelby | 14.1% | 4.6%(+9.58)#40 | 4.9%(+9.26)#2,273 |
| 41. | Steele | 13.8% | 4.6%(+9.29)#41 | 4.9%(+8.97)#2,345 |
| 42. | Thorsby | 13.7% | 4.6%(+9.14)#42 | 4.9%(+8.82)#2,392 |
| 43. | Tarrant | 13.6% | 4.6%(+9.10)#43 | 4.9%(+8.78)#2,399 |
| 44. | Ashford | 13.5% | 4.6%(+8.99)#44 | 4.9%(+8.67)#2,443 |
| 45. | Attalla | 13.4% | 4.6%(+8.86)#45 | 4.9%(+8.54)#2,482 |
| 46. | Satsuma | 13.2% | 4.6%(+8.67)#46 | 4.9%(+8.34)#2,548 |
| 47. | West End Cobb Town | 13.0% | 4.6%(+8.49)#47 | 4.9%(+8.17)#2,592 |
| 48. | Atmore | 12.9% | 4.6%(+8.38)#48 | 4.9%(+8.06)#2,633 |
| 49. | Mignon | 12.8% | 4.6%(+8.27)#49 | 4.9%(+7.95)#2,671 |
| 50. | Bear Creek | 12.7% | 4.6%(+8.19)#50 | 4.9%(+7.87)#2,688 |
| 51. | Riverview | 12.5% | 4.6%(+7.95)#51 | 4.9%(+7.63)#2,787 |
| 52. | Mcdonald Chapel | 12.4% | 4.6%(+7.83)#52 | 4.9%(+7.51)#2,824 |
| 53. | Winfield | 12.3% | 4.6%(+7.77)#53 | 4.9%(+7.45)#2,847 |
| 54. | Fyffe | 12.0% | 4.6%(+7.45)#54 | 4.9%(+7.13)#2,965 |
| 55. | Maplesville | 11.9% | 4.6%(+7.35)#55 | 4.9%(+7.03)#3,012 |
| 56. | Colony | 11.8% | 4.6%(+7.21)#56 | 4.9%(+6.89)#3,081 |
| 57. | Rehobeth | 11.7% | 4.6%(+7.12)#57 | 4.9%(+6.79)#3,119 |
| 58. | Hurtsboro | 11.6% | 4.6%(+7.08)#58 | 4.9%(+6.76)#3,142 |
| 59. | Thomaston | 11.5% | 4.6%(+6.92)#59 | 4.9%(+6.60)#3,198 |
| 60. | Chatom | 11.4% | 4.6%(+6.86)#60 | 4.9%(+6.54)#3,221 |
| 61. | Fort Payne | 11.4% | 4.6%(+6.82)#61 | 4.9%(+6.50)#3,235 |
| 62. | Garden City | 11.1% | 4.6%(+6.56)#62 | 4.9%(+6.24)#3,347 |
| 63. | Waterloo | 11.1% | 4.6%(+6.56)#63 | 4.9%(+6.24)#3,386 |
| 64. | Emelle | 11.1% | 4.6%(+6.56)#64 | 4.9%(+6.24)#3,389 |
| 65. | Samson | 10.9% | 4.6%(+6.37)#65 | 4.9%(+6.05)#3,467 |
| 66. | Leesburg | 10.8% | 4.6%(+6.26)#66 | 4.9%(+5.94)#3,530 |
| 67. | Double Springs | 10.7% | 4.6%(+6.16)#67 | 4.9%(+5.84)#3,569 |
| 68. | Louisville | 10.6% | 4.6%(+6.09)#68 | 4.9%(+5.77)#3,608 |
| 69. | Cullman | 10.6% | 4.6%(+6.04)#69 | 4.9%(+5.72)#3,648 |
| 70. | Lincoln | 10.5% | 4.6%(+5.97)#70 | 4.9%(+5.65)#3,677 |
| 71. | Marbury | 10.3% | 4.6%(+5.79)#71 | 4.9%(+5.47)#3,783 |
| 72. | West Point | 10.3% | 4.6%(+5.70)#72 | 4.9%(+5.38)#3,835 |
| 73. | Hammondville | 10.3% | 4.6%(+5.70)#73 | 4.9%(+5.38)#3,838 |
| 74. | Hartford | 10.2% | 4.6%(+5.63)#74 | 4.9%(+5.31)#3,876 |
| 75. | Weaver | 10.2% | 4.6%(+5.62)#75 | 4.9%(+5.30)#3,880 |
| 76. | Kinsey | 10.1% | 4.6%(+5.59)#76 | 4.9%(+5.27)#3,893 |
| 77. | Mulga | 10.0% | 4.6%(+5.45)#77 | 4.9%(+5.13)#3,977 |
| 78. | Roanoke | 9.7% | 4.6%(+5.17)#78 | 4.9%(+4.85)#4,151 |
| 79. | Midland City | 9.6% | 4.6%(+5.06)#79 | 4.9%(+4.74)#4,241 |
| 80. | Sumiton | 9.6% | 4.6%(+5.06)#80 | 4.9%(+4.74)#4,247 |
| 81. | Vina | 9.5% | 4.6%(+4.97)#81 | 4.9%(+4.65)#4,312 |
| 82. | Bay Minette | 9.5% | 4.6%(+4.94)#82 | 4.9%(+4.62)#4,338 |
| 83. | Haleburg | 9.4% | 4.6%(+4.82)#83 | 4.9%(+4.50)#4,422 |
| 84. | Grove Hill | 9.4% | 4.6%(+4.80)#84 | 4.9%(+4.48)#4,437 |
| 85. | Abbeville | 9.3% | 4.6%(+4.71)#85 | 4.9%(+4.39)#4,494 |
| 86. | Grayson Valley | 9.2% | 4.6%(+4.70)#86 | 4.9%(+4.38)#4,514 |
| 87. | Opp | 9.2% | 4.6%(+4.69)#87 | 4.9%(+4.37)#4,524 |
| 88. | Hollins | 9.2% | 4.6%(+4.66)#88 | 4.9%(+4.34)#4,551 |
| 89. | Vernon | 9.2% | 4.6%(+4.64)#89 | 4.9%(+4.32)#4,558 |
| 90. | Berlin | 9.1% | 4.6%(+4.54)#90 | 4.9%(+4.22)#4,645 |
| 91. | County Line | 9.1% | 4.6%(+4.54)#91 | 4.9%(+4.22)#4,662 |
| 92. | Tuscumbia | 9.0% | 4.6%(+4.44)#92 | 4.9%(+4.12)#4,742 |
| 93. | Evergreen | 8.8% | 4.6%(+4.29)#93 | 4.9%(+3.97)#4,845 |
| 94. | Grant | 8.8% | 4.6%(+4.25)#94 | 4.9%(+3.93)#4,881 |
| 95. | Centre | 8.8% | 4.6%(+4.24)#95 | 4.9%(+3.92)#4,887 |
| 96. | Ariton | 8.8% | 4.6%(+4.24)#96 | 4.9%(+3.92)#4,892 |
| 97. | Talladega | 8.7% | 4.6%(+4.18)#97 | 4.9%(+3.86)#4,944 |
| 98. | Mccalla | 8.7% | 4.6%(+4.18)#98 | 4.9%(+3.86)#4,946 |
| 99. | Hobson City | 8.6% | 4.6%(+4.02)#99 | 4.9%(+3.70)#5,075 |
| 100. | Jacksonville | 8.5% | 4.6%(+3.96)#100 | 4.9%(+3.64)#5,141 |
Common Questions
What are the Top 10 Cities with the Highest Percentage of Population with a Degree in Liberal Arts and History in Alabama?
Top 10 Cities with the Highest Percentage of Population with a Degree in Liberal Arts and History in Alabama are:
#1
90.0%
#2
66.7%
#3
50.0%
#4
37.5%
#5
29.3%
#6
29.1%
#7
28.6%
#8
28.4%
#9
26.7%
#10
25.0%
What city has the Highest Percentage of Population with a Degree in Liberal Arts and History in Alabama?
Fulton has the Highest Percentage of Population with a Degree in Liberal Arts and History in Alabama with 90.0%.
What is the Percentage of Population with a Degree in Liberal Arts and History in the State of Alabama?
Percentage of Population with a Degree in Liberal Arts and History in Alabama is 4.6%.
What is the Percentage of Population with a Degree in Liberal Arts and History in the United States?
Percentage of Population with a Degree in Liberal Arts and History in the United States is 4.9%.