Manton, CA Map & Demographics
Manton Map
Manton Overview
$92,824
PER CAPITA INCOME
$128,088
AVG FAMILY INCOME
$128,125
AVG HOUSEHOLD INCOME
0.48
INEQUALITY / GINI INDEX
305
TOTAL POPULATION
184
MALE POPULATION
121
FEMALE POPULATION
152.07
MALES / 100 FEMALES
65.76
FEMALES / 100 MALES
74.0
MEDIAN AGE
2.5
AVG FAMILY SIZE
2.0
AVG HOUSEHOLD SIZE
33
LABOR FORCE [ PEOPLE ]
13.0%
PERCENT IN LABOR FORCE
Manton Zip Codes
Manton Area Codes
Income in Manton
Income Overview in Manton
Per Capita Income in Manton is $92,824, while median incomes of families and households are $128,088 and $128,125 respectively.
| Characteristic | Number | Measure |
| Per Capita Income | 305 | $92,824 |
| Median Family Income | 104 | $128,088 |
| Mean Family Income | 104 | $109,380 |
| Median Household Income | 144 | $128,125 |
| Mean Household Income | 144 | $182,206 |
| Income Deficit | 104 | $0 |
| Wage / Income Gap (%) | 305 | 0.00% |
| Wage / Income Gap ($) | 305 | 100.00¢ per $1 |
| Gini / Inequality Index | 305 | 0.48 |
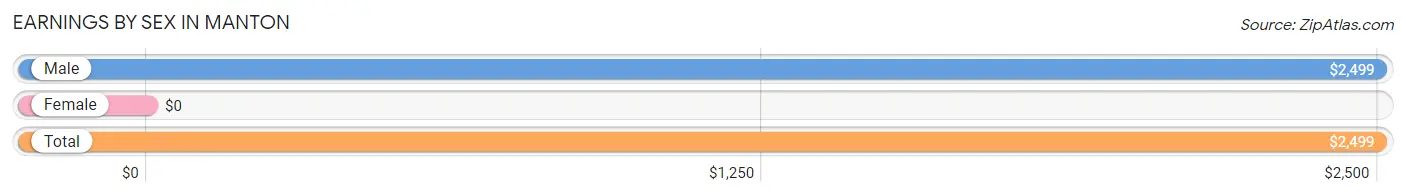
Earnings by Sex in Manton
| Sex | Number | Average Earnings |
| Male | 93 (88.6%) | $2,499 |
| Female | 12 (11.4%) | $0 |
| Total | 105 (100.0%) | $2,499 |
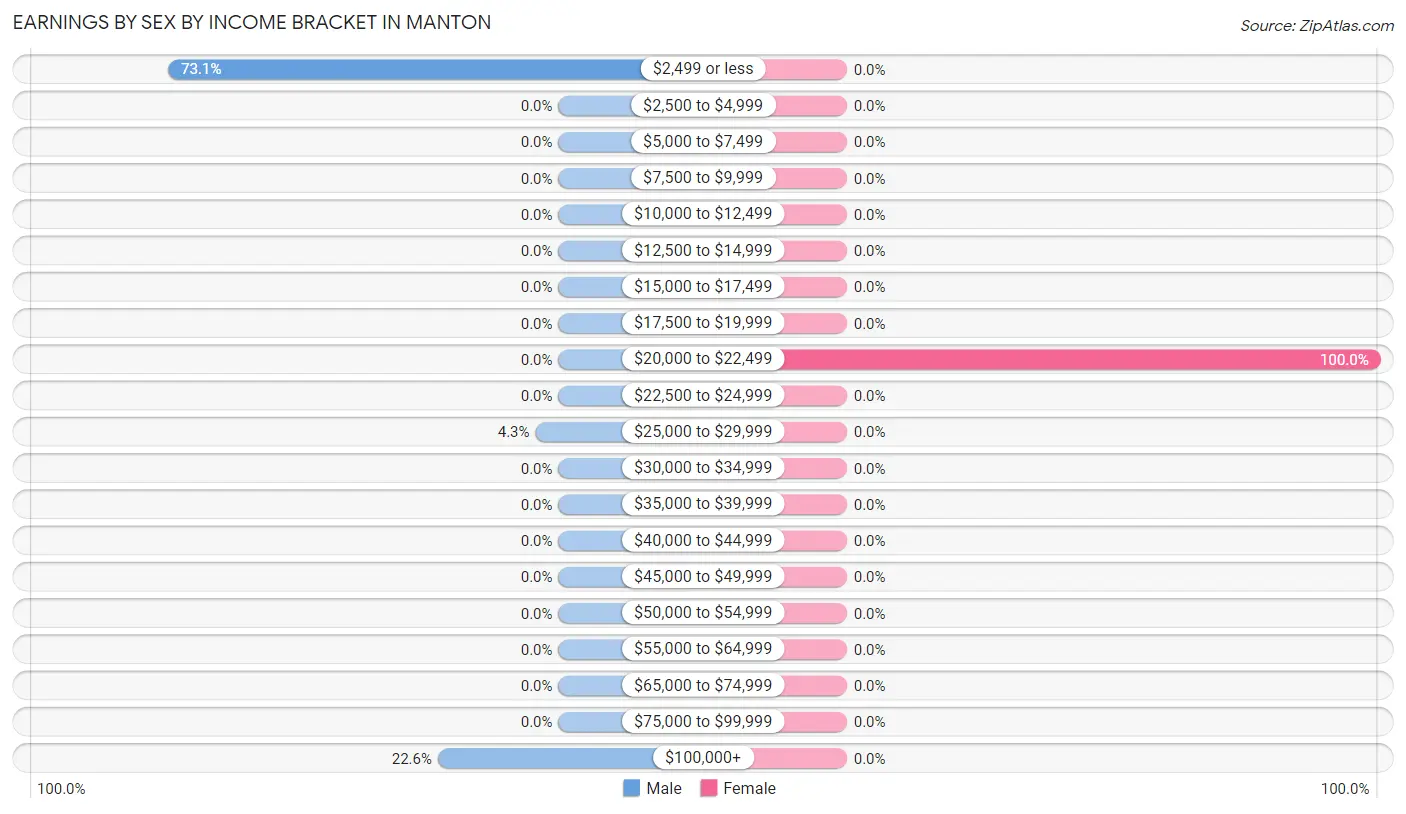
Earnings by Sex by Income Bracket in Manton
The most common earnings brackets in Manton are $2,499 or less for men (68 | 73.1%) and $20,000 to $22,499 for women (12 | 100.0%).
| Income | Male | Female |
| $2,499 or less | 68 (73.1%) | 0 (0.0%) |
| $2,500 to $4,999 | 0 (0.0%) | 0 (0.0%) |
| $5,000 to $7,499 | 0 (0.0%) | 0 (0.0%) |
| $7,500 to $9,999 | 0 (0.0%) | 0 (0.0%) |
| $10,000 to $12,499 | 0 (0.0%) | 0 (0.0%) |
| $12,500 to $14,999 | 0 (0.0%) | 0 (0.0%) |
| $15,000 to $17,499 | 0 (0.0%) | 0 (0.0%) |
| $17,500 to $19,999 | 0 (0.0%) | 0 (0.0%) |
| $20,000 to $22,499 | 0 (0.0%) | 12 (100.0%) |
| $22,500 to $24,999 | 0 (0.0%) | 0 (0.0%) |
| $25,000 to $29,999 | 4 (4.3%) | 0 (0.0%) |
| $30,000 to $34,999 | 0 (0.0%) | 0 (0.0%) |
| $35,000 to $39,999 | 0 (0.0%) | 0 (0.0%) |
| $40,000 to $44,999 | 0 (0.0%) | 0 (0.0%) |
| $45,000 to $49,999 | 0 (0.0%) | 0 (0.0%) |
| $50,000 to $54,999 | 0 (0.0%) | 0 (0.0%) |
| $55,000 to $64,999 | 0 (0.0%) | 0 (0.0%) |
| $65,000 to $74,999 | 0 (0.0%) | 0 (0.0%) |
| $75,000 to $99,999 | 0 (0.0%) | 0 (0.0%) |
| $100,000+ | 21 (22.6%) | 0 (0.0%) |
| Total | 93 (100.0%) | 12 (100.0%) |
Earnings by Sex by Educational Attainment in Manton
| Educational Attainment | Male Income | Female Income |
| Less than High School | - | - |
| High School Diploma | - | - |
| College or Associate's Degree | - | - |
| Bachelor's Degree | - | - |
| Graduate Degree | - | - |
| Total | $2,499 | $0 |
Family Income in Manton
Family Income Brackets in Manton
According to the Manton family income data, there are 68 families falling into the $100,000 to $149,999 income range, which is the most common income bracket and makes up 65.4% of all families.
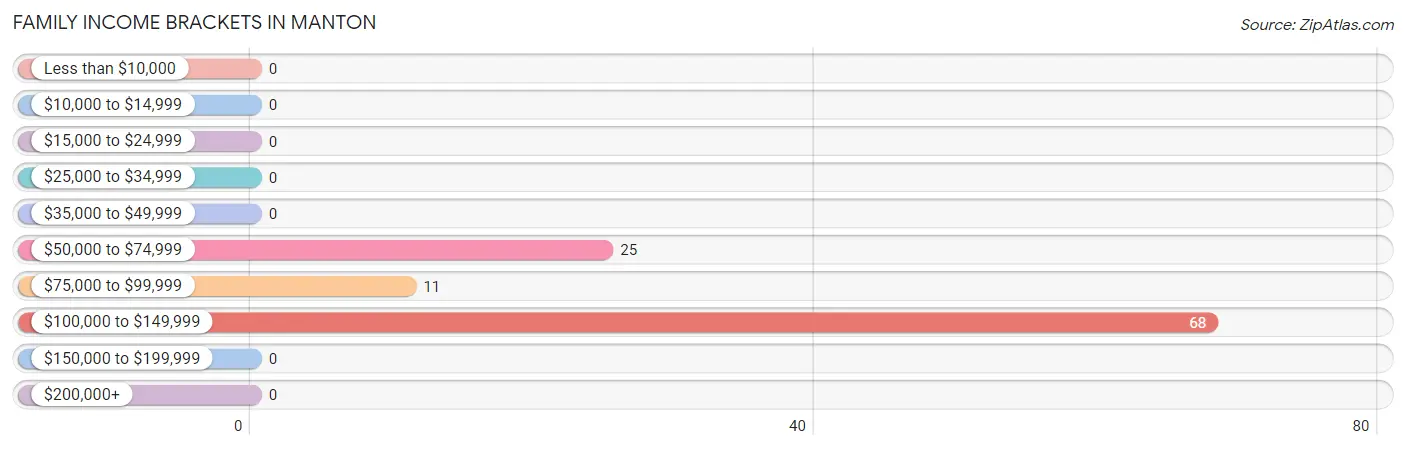
| Income Bracket | # Families | % Families |
| Less than $10,000 | 0 | 0.0% |
| $10,000 to $14,999 | 0 | 0.0% |
| $15,000 to $24,999 | 0 | 0.0% |
| $25,000 to $34,999 | 0 | 0.0% |
| $35,000 to $49,999 | 0 | 0.0% |
| $50,000 to $74,999 | 25 | 24.0% |
| $75,000 to $99,999 | 11 | 10.6% |
| $100,000 to $149,999 | 68 | 65.4% |
| $150,000 to $199,999 | 0 | 0.0% |
| $200,000+ | 0 | 0.0% |
Family Income by Famaliy Size in Manton
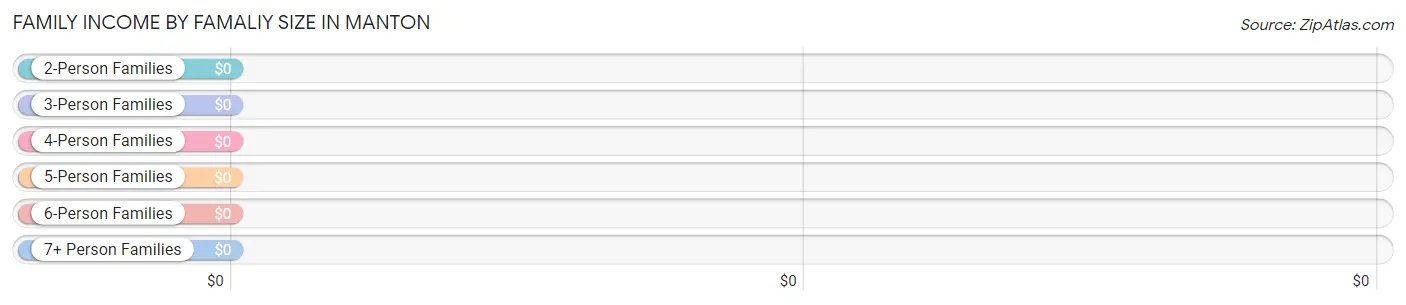
| Income Bracket | # Families | Median Income |
| 2-Person Families | 79 (76.0%) | $0 |
| 3-Person Families | 25 (24.0%) | $0 |
| 4-Person Families | 0 (0.0%) | $0 |
| 5-Person Families | 0 (0.0%) | $0 |
| 6-Person Families | 0 (0.0%) | $0 |
| 7+ Person Families | 0 (0.0%) | $0 |
| Total | 104 (100.0%) | $128,088 |
Family Income by Number of Earners in Manton
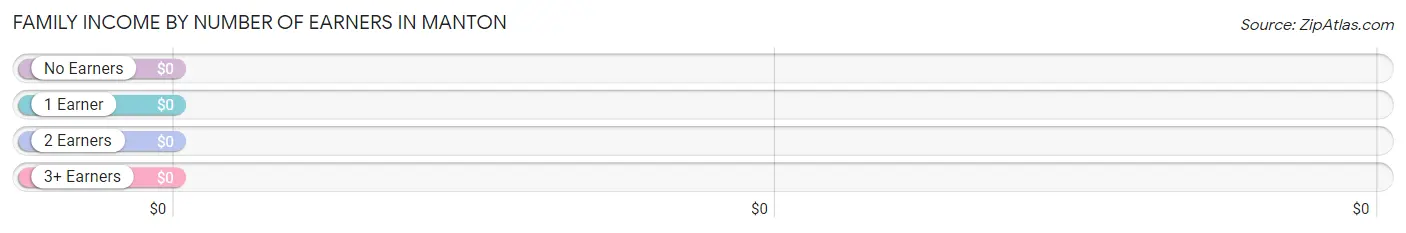
| Number of Earners | # Families | Median Income |
| No Earners | 25 (24.0%) | $0 |
| 1 Earner | 79 (76.0%) | $0 |
| 2 Earners | 0 (0.0%) | $0 |
| 3+ Earners | 0 (0.0%) | $0 |
| Total | 104 (100.0%) | $128,088 |
Household Income in Manton
Household Income Brackets in Manton
With 68 households falling in the category, the $100,000 to $149,999 income range is the most frequent in Manton, accounting for 47.2% of all households.
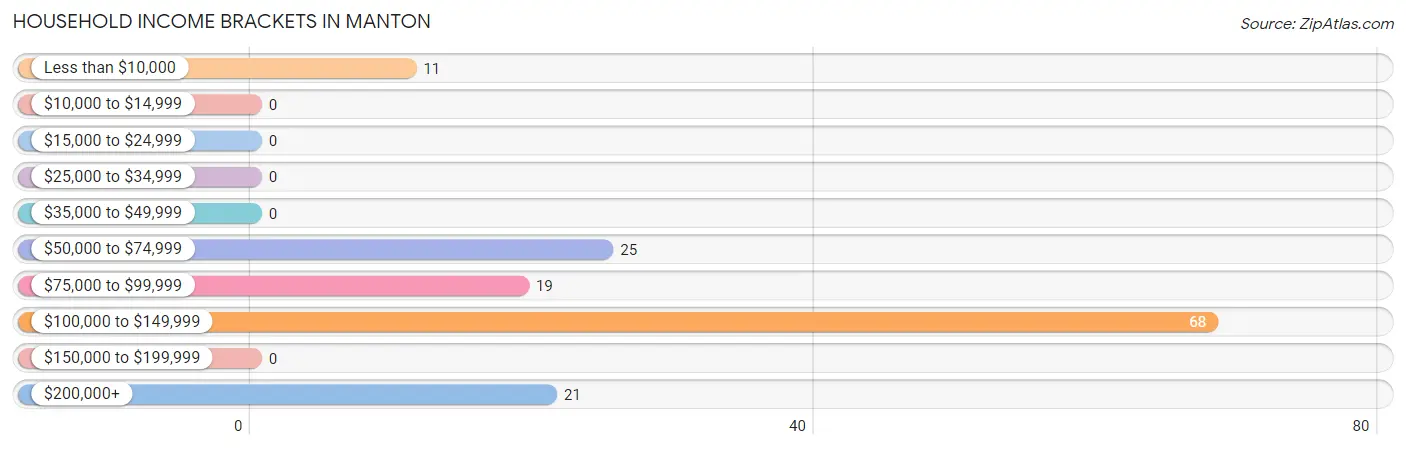
| Income Bracket | # Households | % Households |
| Less than $10,000 | 11 | 7.6% |
| $10,000 to $14,999 | 0 | 0.0% |
| $15,000 to $24,999 | 0 | 0.0% |
| $25,000 to $34,999 | 0 | 0.0% |
| $35,000 to $49,999 | 0 | 0.0% |
| $50,000 to $74,999 | 25 | 17.4% |
| $75,000 to $99,999 | 19 | 13.2% |
| $100,000 to $149,999 | 68 | 47.2% |
| $150,000 to $199,999 | 0 | 0.0% |
| $200,000+ | 21 | 14.6% |
Household Income by Householder Age in Manton
The median household income in Manton is $128,125, with the highest median household income of $61,100 found in the 45 to 64 years age bracket for the primary householder. A total of 44 households (30.6%) fall into this category.
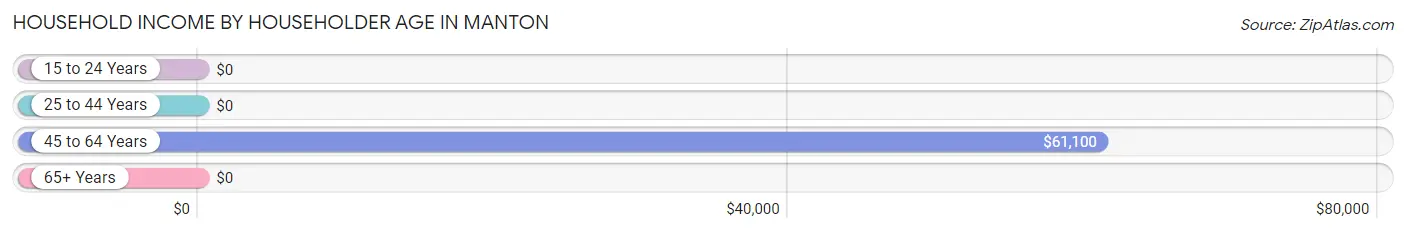
| Income Bracket | # Households | Median Income |
| 15 to 24 Years | 0 (0.0%) | $0 |
| 25 to 44 Years | 21 (14.6%) | $0 |
| 45 to 64 Years | 44 (30.6%) | $61,100 |
| 65+ Years | 79 (54.9%) | $0 |
| Total | 144 (100.0%) | $128,125 |
Poverty in Manton
Income Below Poverty by Sex and Age in Manton
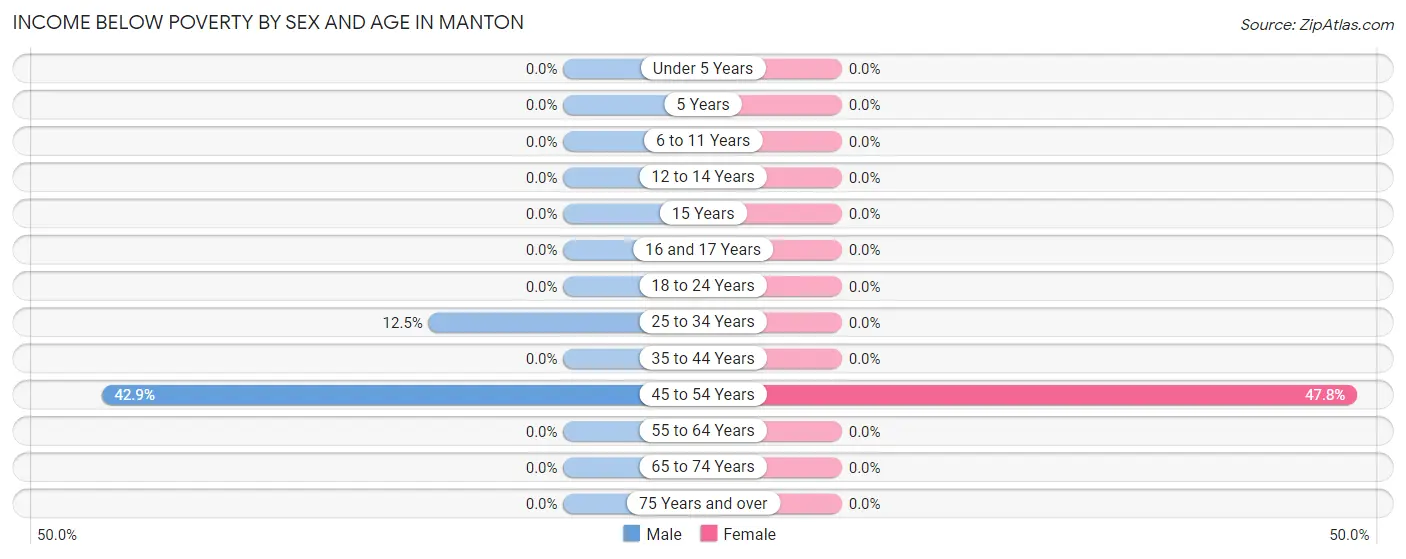
With 3.3% poverty level for males and 9.1% for females among the residents of Manton, 45 to 54 year old males and 45 to 54 year old females are the most vulnerable to poverty, with 3 males (42.9%) and 11 females (47.8%) in their respective age groups living below the poverty level.
| Age Bracket | Male | Female |
| Under 5 Years | 0 (0.0%) | 0 (0.0%) |
| 5 Years | 0 (0.0%) | 0 (0.0%) |
| 6 to 11 Years | 0 (0.0%) | 0 (0.0%) |
| 12 to 14 Years | 0 (0.0%) | 0 (0.0%) |
| 15 Years | 0 (0.0%) | 0 (0.0%) |
| 16 and 17 Years | 0 (0.0%) | 0 (0.0%) |
| 18 to 24 Years | 0 (0.0%) | 0 (0.0%) |
| 25 to 34 Years | 3 (12.5%) | 0 (0.0%) |
| 35 to 44 Years | 0 (0.0%) | 0 (0.0%) |
| 45 to 54 Years | 3 (42.9%) | 11 (47.8%) |
| 55 to 64 Years | 0 (0.0%) | 0 (0.0%) |
| 65 to 74 Years | 0 (0.0%) | 0 (0.0%) |
| 75 Years and over | 0 (0.0%) | 0 (0.0%) |
| Total | 6 (3.3%) | 11 (9.1%) |
Income Above Poverty by Sex and Age in Manton
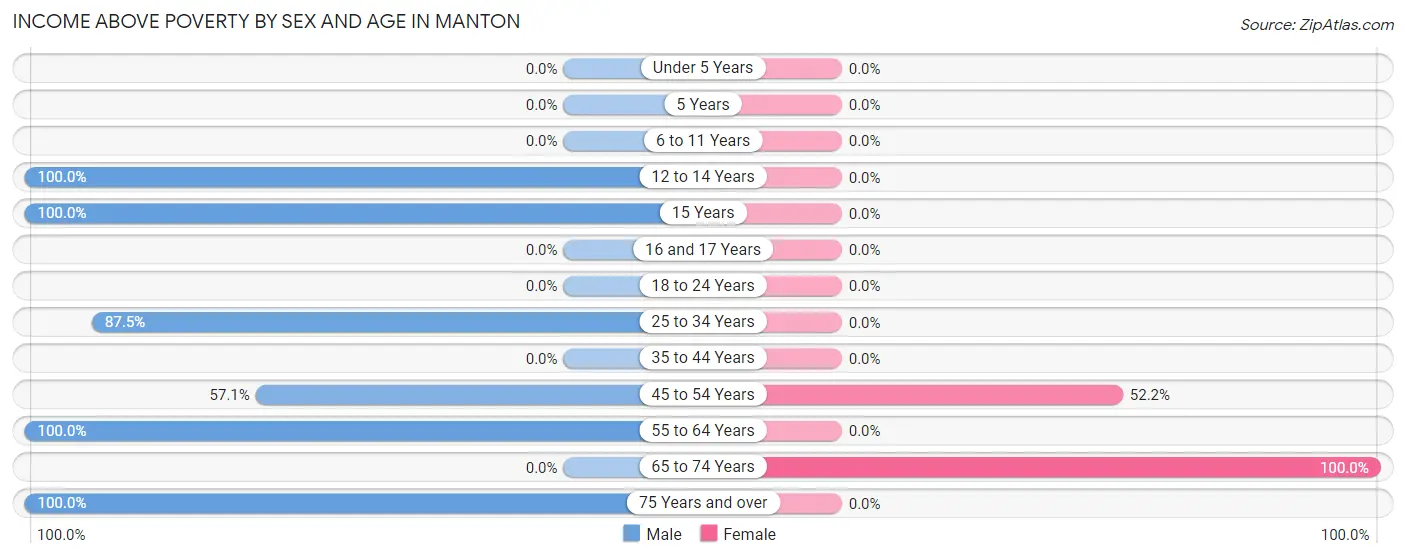
According to the poverty statistics in Manton, males aged 12 to 14 years and females aged 65 to 74 years are the age groups that are most secure financially, with 100.0% of males and 100.0% of females in these age groups living above the poverty line.
| Age Bracket | Male | Female |
| Under 5 Years | 0 (0.0%) | 0 (0.0%) |
| 5 Years | 0 (0.0%) | 0 (0.0%) |
| 6 to 11 Years | 0 (0.0%) | 0 (0.0%) |
| 12 to 14 Years | 29 (100.0%) | 0 (0.0%) |
| 15 Years | 23 (100.0%) | 0 (0.0%) |
| 16 and 17 Years | 0 (0.0%) | 0 (0.0%) |
| 18 to 24 Years | 0 (0.0%) | 0 (0.0%) |
| 25 to 34 Years | 21 (87.5%) | 0 (0.0%) |
| 35 to 44 Years | 0 (0.0%) | 0 (0.0%) |
| 45 to 54 Years | 4 (57.1%) | 12 (52.2%) |
| 55 to 64 Years | 33 (100.0%) | 0 (0.0%) |
| 65 to 74 Years | 0 (0.0%) | 98 (100.0%) |
| 75 Years and over | 68 (100.0%) | 0 (0.0%) |
| Total | 178 (96.7%) | 110 (90.9%) |
Income Below Poverty Among Married-Couple Families in Manton
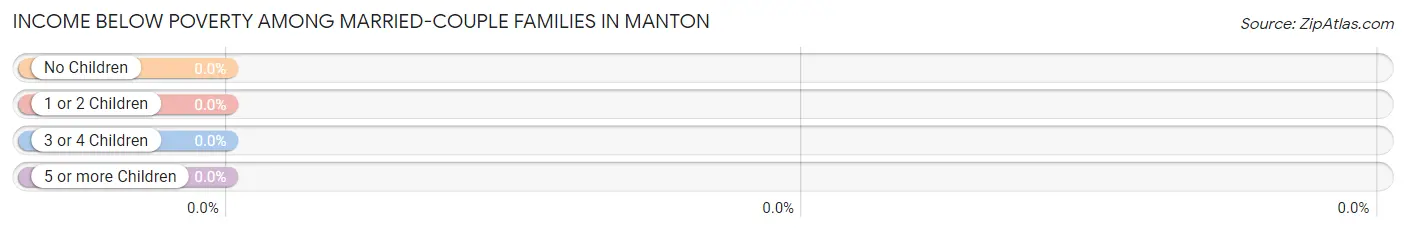
| Children | Above Poverty | Below Poverty |
| No Children | 68 (100.0%) | 0 (0.0%) |
| 1 or 2 Children | 0 (0.0%) | 0 (0.0%) |
| 3 or 4 Children | 0 (0.0%) | 0 (0.0%) |
| 5 or more Children | 0 (0.0%) | 0 (0.0%) |
| Total | 68 (100.0%) | 0 (0.0%) |
Income Below Poverty Among Single-Parent Households in Manton
| Children | Single Father | Single Mother |
| No Children | 0 (0.0%) | 0 (0.0%) |
| 1 or 2 Children | 0 (0.0%) | 0 (0.0%) |
| 3 or 4 Children | 0 (0.0%) | 0 (0.0%) |
| 5 or more Children | 0 (0.0%) | 0 (0.0%) |
| Total | 0 (0.0%) | 0 (0.0%) |
Income Below Poverty Among Married-Couple vs Single-Parent Households in Manton
| Children | Married-Couple Families | Single-Parent Households |
| No Children | 0 (0.0%) | 0 (0.0%) |
| 1 or 2 Children | 0 (0.0%) | 0 (0.0%) |
| 3 or 4 Children | 0 (0.0%) | 0 (0.0%) |
| 5 or more Children | 0 (0.0%) | 0 (0.0%) |
| Total | 0 (0.0%) | 0 (0.0%) |
Race in Manton
The most populous races in Manton are White / Caucasian (281 | 92.1%), and Asian (24 | 7.9%).
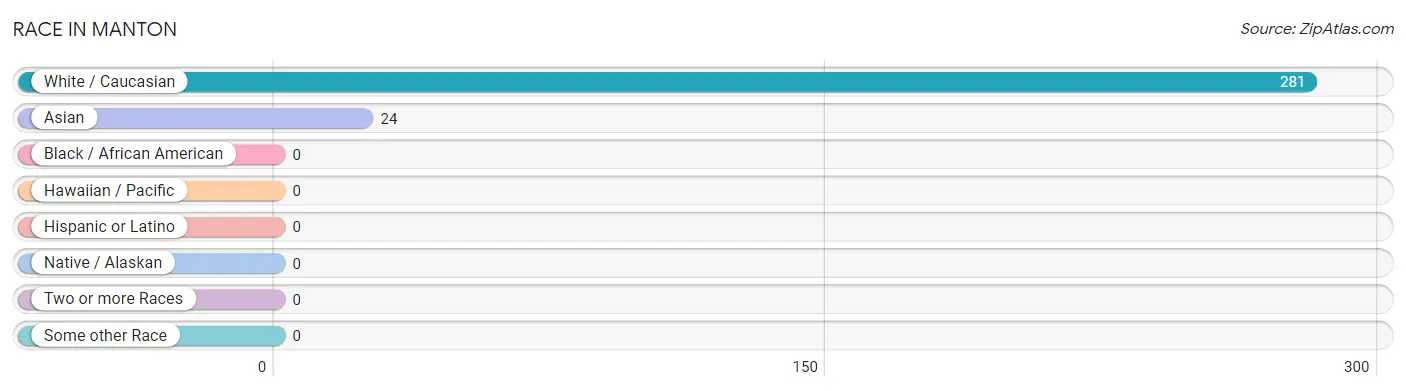
| Race | # Population | % Population |
| Asian | 24 | 7.9% |
| Black / African American | 0 | 0.0% |
| Hawaiian / Pacific | 0 | 0.0% |
| Hispanic or Latino | 0 | 0.0% |
| Native / Alaskan | 0 | 0.0% |
| White / Caucasian | 281 | 92.1% |
| Two or more Races | 0 | 0.0% |
| Some other Race | 0 | 0.0% |
| Total | 305 | 100.0% |
Ancestry in Manton
The most populous ancestries reported in Manton are English (166 | 54.4%), Scottish (100 | 32.8%), French (87 | 28.5%), German (72 | 23.6%), and Italian (30 | 9.8%), together accounting for 149.2% of all Manton residents.
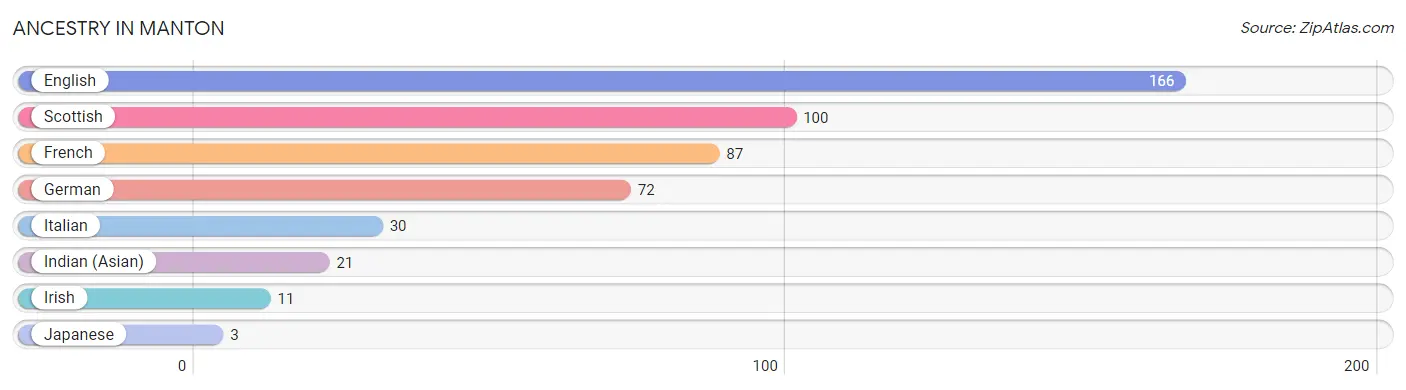
| Ancestry | # Population | % Population |
| English | 166 | 54.4% |
| French | 87 | 28.5% |
| German | 72 | 23.6% |
| Indian (Asian) | 21 | 6.9% |
| Irish | 11 | 3.6% |
| Italian | 30 | 9.8% |
| Japanese | 3 | 1.0% |
| Scottish | 100 | 32.8% | View All 8 Rows |
Immigrants in Manton
The most numerous immigrant groups reported in Manton came from Asia (24 | 7.9%), India (21 | 6.9%), South Central Asia (21 | 6.9%), Cambodia (3 | 1.0%), and South Eastern Asia (3 | 1.0%), together accounting for 23.6% of all Manton residents.
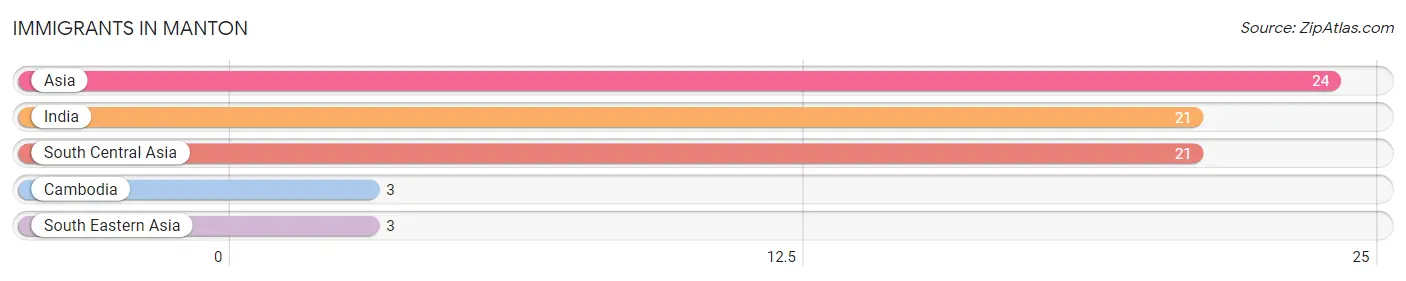
| Immigration Origin | # Population | % Population |
| Asia | 24 | 7.9% |
| Cambodia | 3 | 1.0% |
| India | 21 | 6.9% |
| South Central Asia | 21 | 6.9% |
| South Eastern Asia | 3 | 1.0% | View All 5 Rows |
Sex and Age in Manton
Sex and Age in Manton
The most populous age groups in Manton are 75 to 79 Years (68 | 37.0%) for men and 70 to 74 Years (87 | 71.9%) for women.
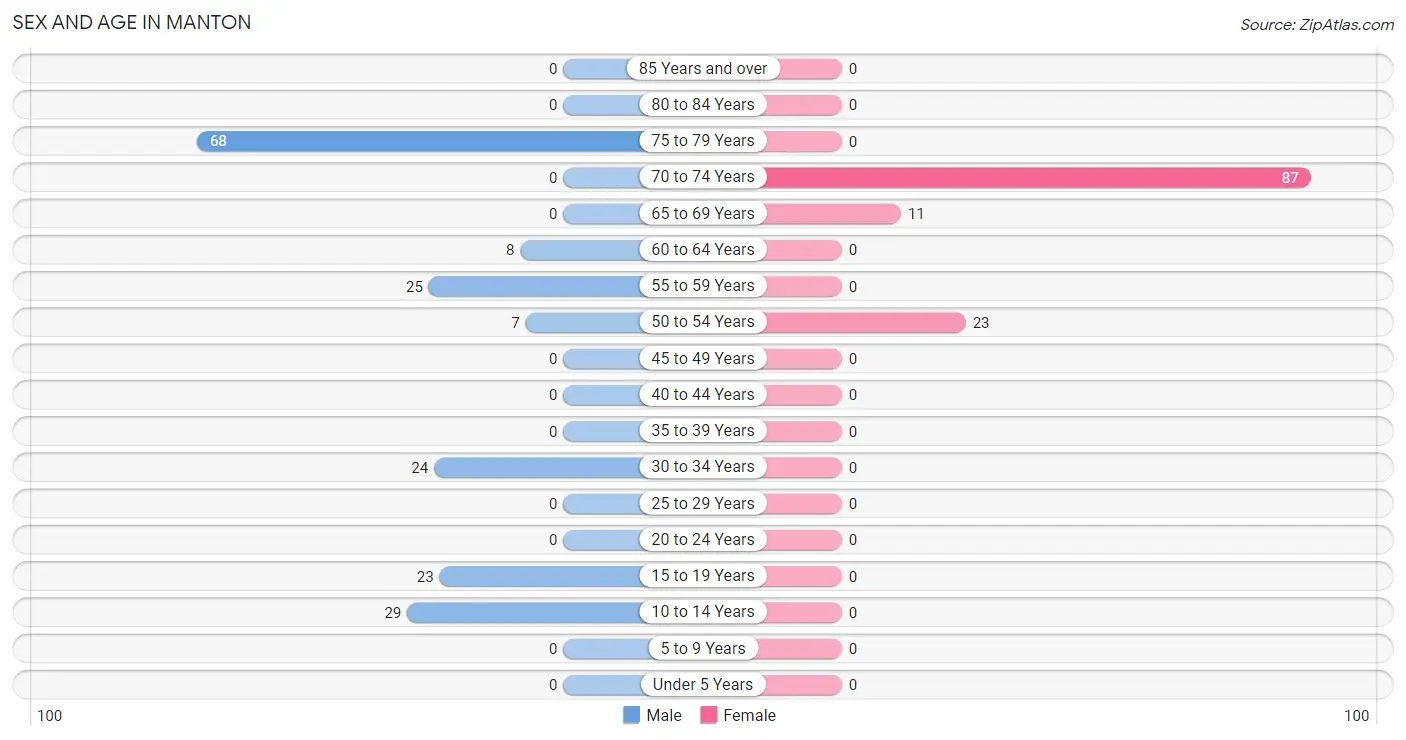
| Age Bracket | Male | Female |
| Under 5 Years | 0 (0.0%) | 0 (0.0%) |
| 5 to 9 Years | 0 (0.0%) | 0 (0.0%) |
| 10 to 14 Years | 29 (15.8%) | 0 (0.0%) |
| 15 to 19 Years | 23 (12.5%) | 0 (0.0%) |
| 20 to 24 Years | 0 (0.0%) | 0 (0.0%) |
| 25 to 29 Years | 0 (0.0%) | 0 (0.0%) |
| 30 to 34 Years | 24 (13.0%) | 0 (0.0%) |
| 35 to 39 Years | 0 (0.0%) | 0 (0.0%) |
| 40 to 44 Years | 0 (0.0%) | 0 (0.0%) |
| 45 to 49 Years | 0 (0.0%) | 0 (0.0%) |
| 50 to 54 Years | 7 (3.8%) | 23 (19.0%) |
| 55 to 59 Years | 25 (13.6%) | 0 (0.0%) |
| 60 to 64 Years | 8 (4.3%) | 0 (0.0%) |
| 65 to 69 Years | 0 (0.0%) | 11 (9.1%) |
| 70 to 74 Years | 0 (0.0%) | 87 (71.9%) |
| 75 to 79 Years | 68 (37.0%) | 0 (0.0%) |
| 80 to 84 Years | 0 (0.0%) | 0 (0.0%) |
| 85 Years and over | 0 (0.0%) | 0 (0.0%) |
| Total | 184 (100.0%) | 121 (100.0%) |
Families and Households in Manton
Median Family Size in Manton
The median family size in Manton is 2.45 persons per family, with single male/father families (25 | 24.0%) accounting for the largest median family size of 3.08 persons per family. On the other hand, single female/mother families (11 | 10.6%) represent the smallest median family size with 2.09 persons per family.
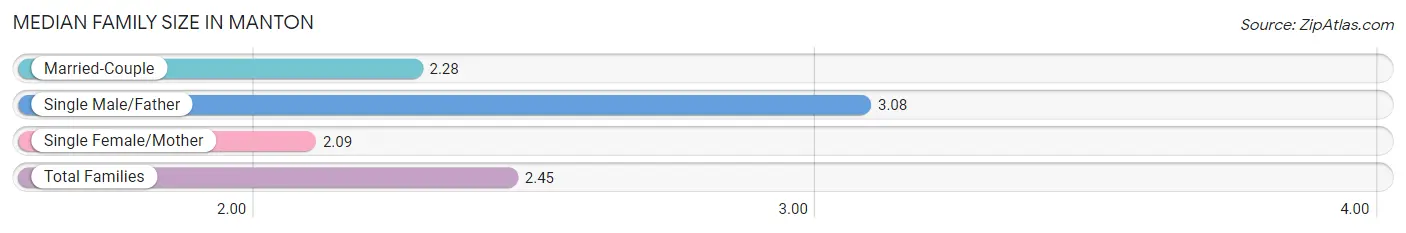
| Family Type | # Families | Family Size |
| Married-Couple | 68 (65.4%) | 2.28 |
| Single Male/Father | 25 (24.0%) | 3.08 |
| Single Female/Mother | 11 (10.6%) | 2.09 |
| Total Families | 104 (100.0%) | 2.45 |
Median Household Size in Manton
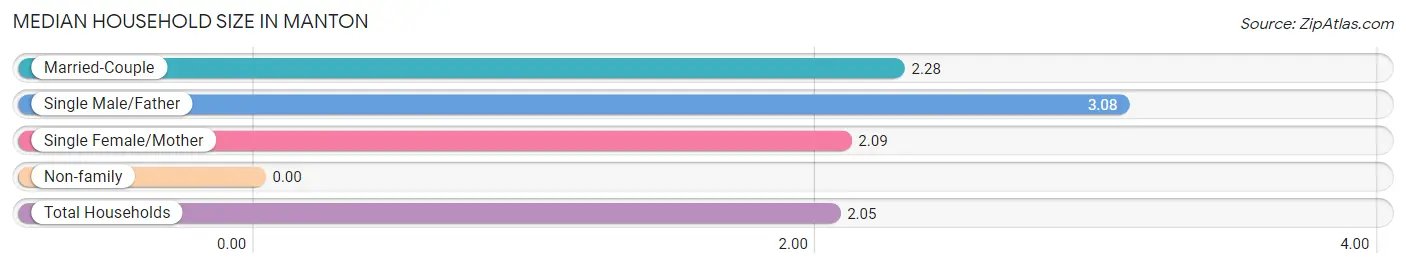
| Household Type | # Households | Household Size |
| Married-Couple | 68 (47.2%) | 2.28 |
| Single Male/Father | 25 (17.4%) | 3.08 |
| Single Female/Mother | 11 (7.6%) | 2.09 |
| Non-family | 40 (27.8%) | - |
| Total Households | 144 (100.0%) | 2.05 |
Household Size by Marriage Status in Manton
Out of a total of 144 households in Manton, 104 (72.2%) are family households, while 40 (27.8%) are nonfamily households. The most numerous type of family households are 2-person households, comprising 79, and the most common type of nonfamily households are 1-person households, comprising 40.
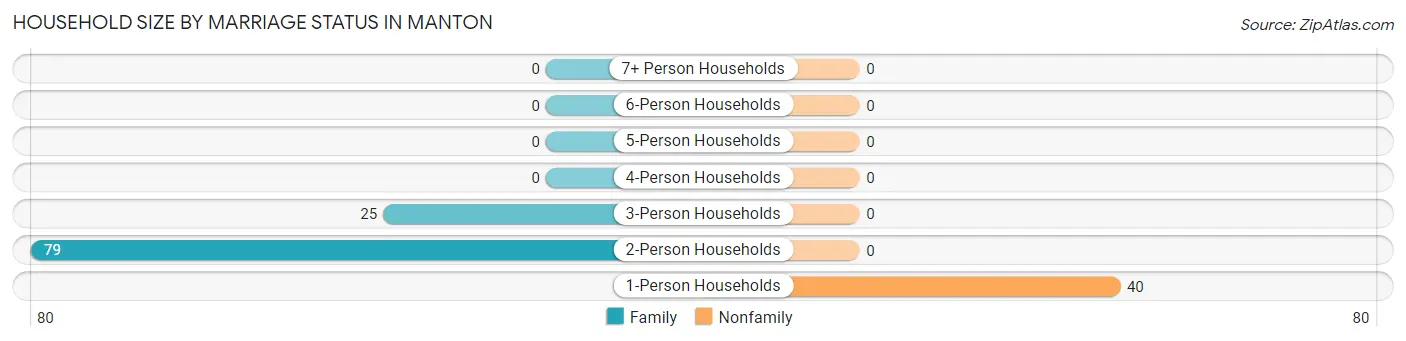
| Household Size | Family Households | Nonfamily Households |
| 1-Person Households | - | 40 (27.8%) |
| 2-Person Households | 79 (54.9%) | 0 (0.0%) |
| 3-Person Households | 25 (17.4%) | 0 (0.0%) |
| 4-Person Households | 0 (0.0%) | 0 (0.0%) |
| 5-Person Households | 0 (0.0%) | 0 (0.0%) |
| 6-Person Households | 0 (0.0%) | 0 (0.0%) |
| 7+ Person Households | 0 (0.0%) | 0 (0.0%) |
| Total | 104 (72.2%) | 40 (27.8%) |
Female Fertility in Manton
Fertility by Age in Manton
| Age Bracket | Women with Births | Births / 1,000 Women |
| 15 to 19 years | 0 (0.0%) | 0.0 |
| 20 to 34 years | 0 (0.0%) | 0.0 |
| 35 to 50 years | 0 (0.0%) | 0.0 |
| Total | 0 (0.0%) | 0.0 |
Fertility by Age by Marriage Status in Manton
| Age Bracket | Married | Unmarried |
| 15 to 19 years | 0 (0.0%) | 0 (0.0%) |
| 20 to 34 years | 0 (0.0%) | 0 (0.0%) |
| 35 to 50 years | 0 (0.0%) | 0 (0.0%) |
| Total | 0 (0.0%) | 0 (0.0%) |
Fertility by Education in Manton
| Educational Attainment | Women with Births | Births / 1,000 Women |
| Less than High School | 0 (0.0%) | 0.0 |
| High School Diploma | 0 (0.0%) | 0.0 |
| College or Associate's Degree | 0 (0.0%) | 0.0 |
| Bachelor's Degree | 0 (0.0%) | 0.0 |
| Graduate Degree | 0 (0.0%) | 0.0 |
| Total | 0 (0.0%) | 0.0 |
Fertility by Education by Marriage Status in Manton
| Educational Attainment | Married | Unmarried |
| Less than High School | 0 (0.0%) | 0 (0.0%) |
| High School Diploma | 0 (0.0%) | 0 (0.0%) |
| College or Associate's Degree | 0 (0.0%) | 0 (0.0%) |
| Bachelor's Degree | 0 (0.0%) | 0 (0.0%) |
| Graduate Degree | 0 (0.0%) | 0 (0.0%) |
| Total | 0 (0.0%) | 0 (0.0%) |
Employment Characteristics in Manton
Employment by Class of Employer in Manton
Among the 33 employed individuals in Manton, private company employees (21 | 63.6%), and local government employees (12 | 36.4%) make up the most common classes of employment.
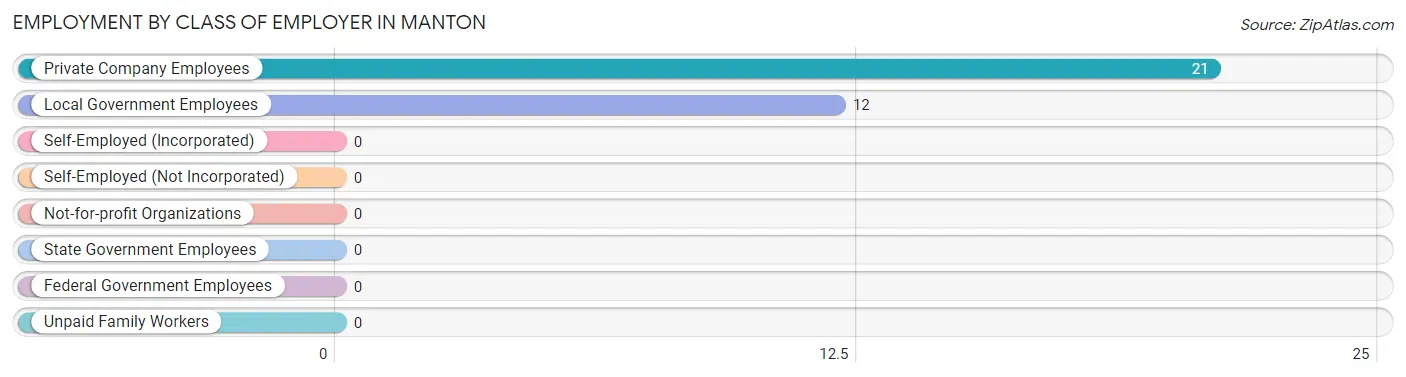
| Employer Class | # Employees | % Employees |
| Private Company Employees | 21 | 63.6% |
| Self-Employed (Incorporated) | 0 | 0.0% |
| Self-Employed (Not Incorporated) | 0 | 0.0% |
| Not-for-profit Organizations | 0 | 0.0% |
| Local Government Employees | 12 | 36.4% |
| State Government Employees | 0 | 0.0% |
| Federal Government Employees | 0 | 0.0% |
| Unpaid Family Workers | 0 | 0.0% |
| Total | 33 | 100.0% |
Employment Status by Age in Manton
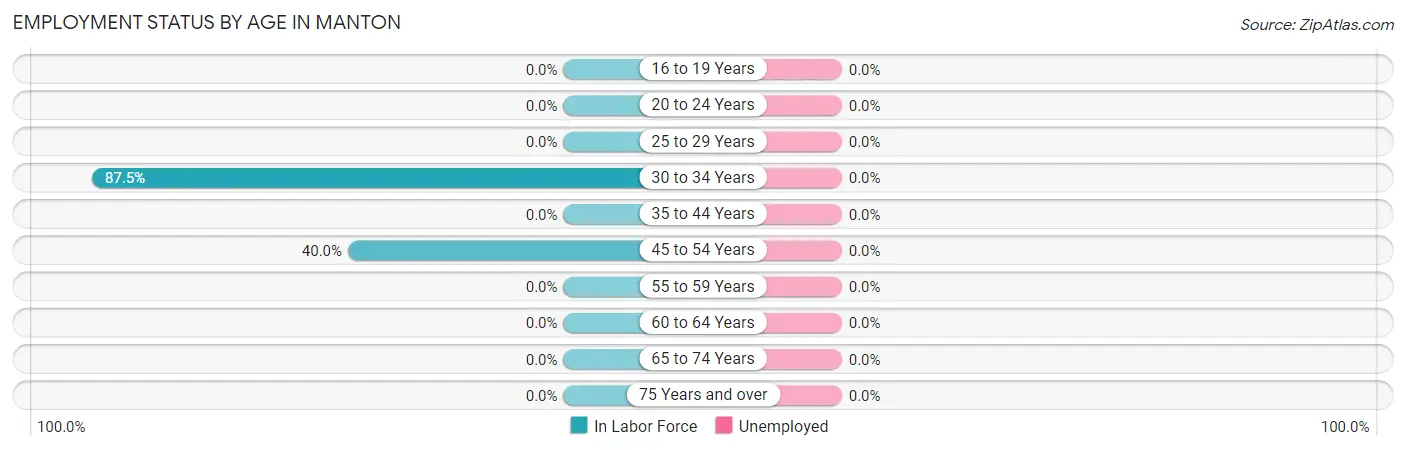
| Age Bracket | In Labor Force | Unemployed |
| 16 to 19 Years | 0 (0.0%) | 0 (0.0%) |
| 20 to 24 Years | 0 (0.0%) | 0 (0.0%) |
| 25 to 29 Years | 0 (0.0%) | 0 (0.0%) |
| 30 to 34 Years | 21 (87.5%) | 0 (0.0%) |
| 35 to 44 Years | 0 (0.0%) | 0 (0.0%) |
| 45 to 54 Years | 12 (40.0%) | 0 (0.0%) |
| 55 to 59 Years | 0 (0.0%) | 0 (0.0%) |
| 60 to 64 Years | 0 (0.0%) | 0 (0.0%) |
| 65 to 74 Years | 0 (0.0%) | 0 (0.0%) |
| 75 Years and over | 0 (0.0%) | 0 (0.0%) |
| Total | 33 (13.0%) | 0 (0.0%) |
Employment Status by Educational Attainment in Manton
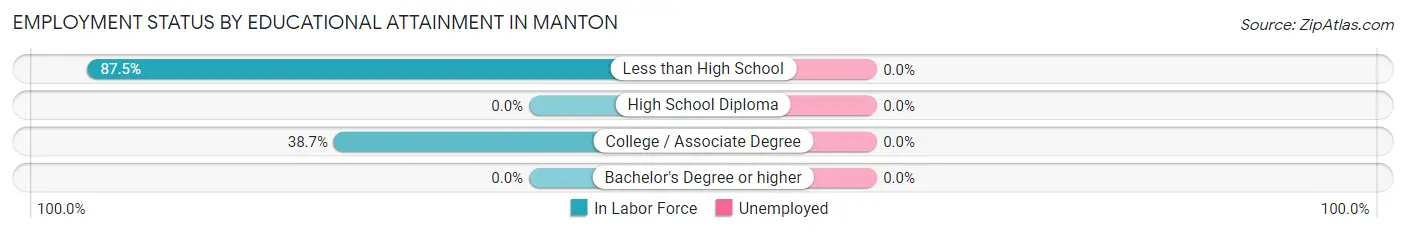
| Educational Attainment | In Labor Force | Unemployed |
| Less than High School | 21 (87.5%) | 0 (0.0%) |
| High School Diploma | 0 (0.0%) | 0 (0.0%) |
| College / Associate Degree | 12 (38.7%) | 0 (0.0%) |
| Bachelor's Degree or higher | 0 (0.0%) | 0 (0.0%) |
| Total | 33 (37.9%) | 0 (0.0%) |
Employment Occupations by Sex in Manton
Management, Business, Science and Arts Occupations
The most common Management, Business, Science and Arts occupations in Manton are , and Management (21 | 63.6%).
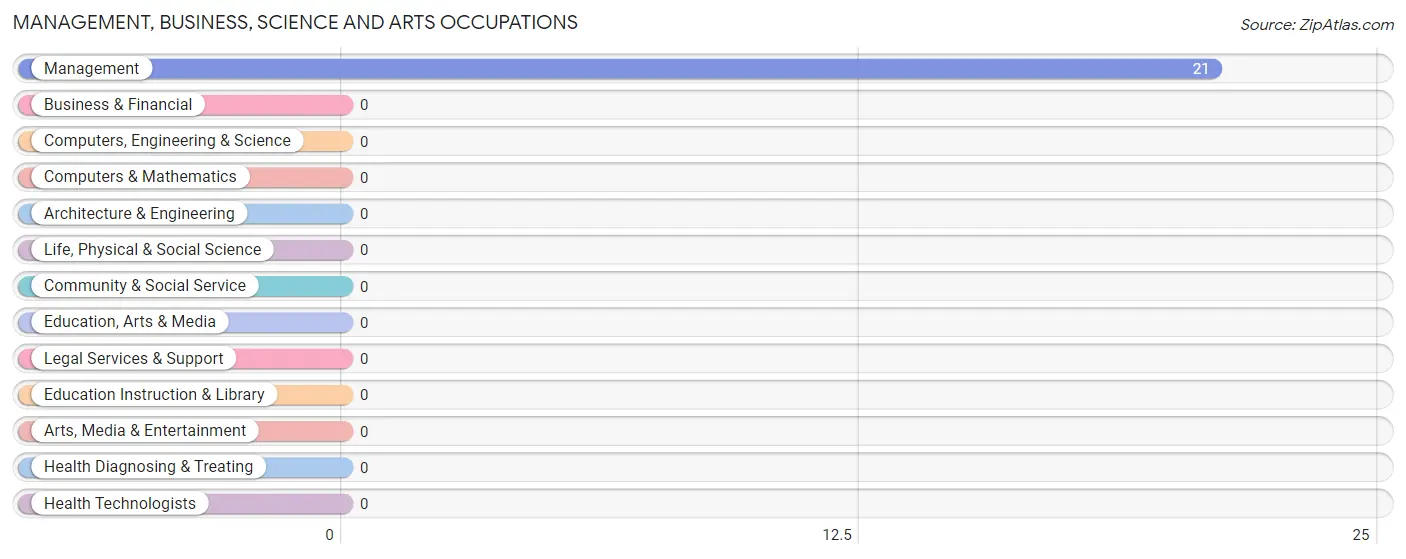
Management, Business, Science and Arts Occupations by Sex
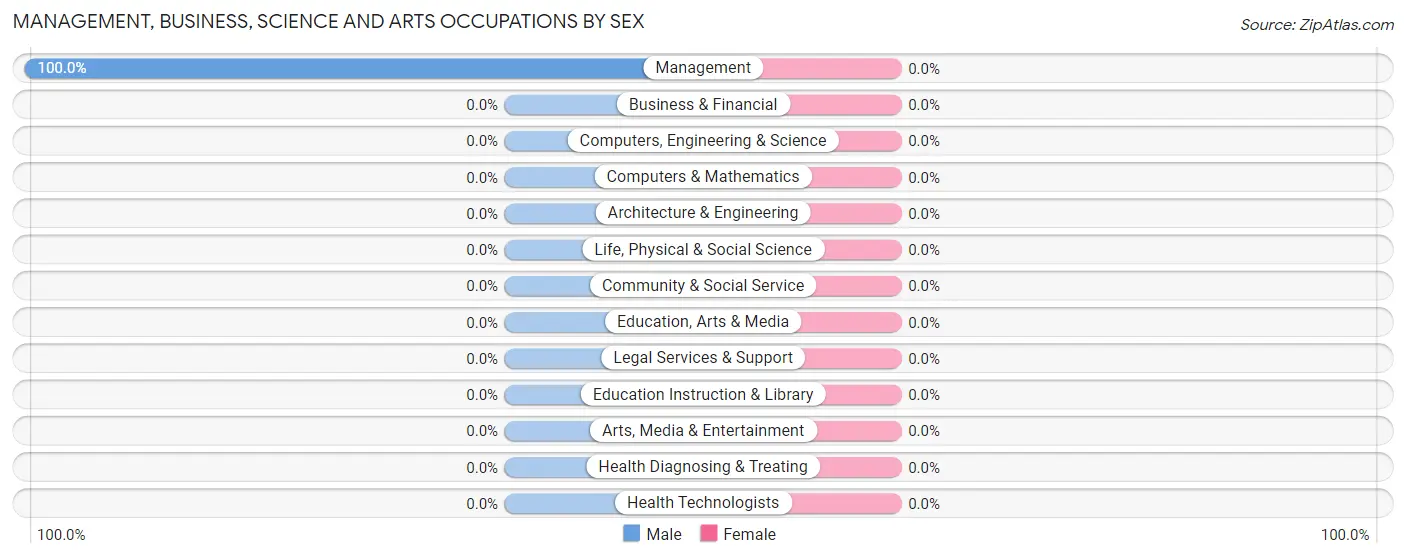
| Occupation | Male | Female |
| Management | 21 (100.0%) | 0 (0.0%) |
| Business & Financial | 0 (0.0%) | 0 (0.0%) |
| Computers, Engineering & Science | 0 (0.0%) | 0 (0.0%) |
| Computers & Mathematics | 0 (0.0%) | 0 (0.0%) |
| Architecture & Engineering | 0 (0.0%) | 0 (0.0%) |
| Life, Physical & Social Science | 0 (0.0%) | 0 (0.0%) |
| Community & Social Service | 0 (0.0%) | 0 (0.0%) |
| Education, Arts & Media | 0 (0.0%) | 0 (0.0%) |
| Legal Services & Support | 0 (0.0%) | 0 (0.0%) |
| Education Instruction & Library | 0 (0.0%) | 0 (0.0%) |
| Arts, Media & Entertainment | 0 (0.0%) | 0 (0.0%) |
| Health Diagnosing & Treating | 0 (0.0%) | 0 (0.0%) |
| Health Technologists | 0 (0.0%) | 0 (0.0%) |
| Total (Category) | 21 (100.0%) | 0 (0.0%) |
| Total (Overall) | 21 (63.6%) | 12 (36.4%) |
Services Occupations
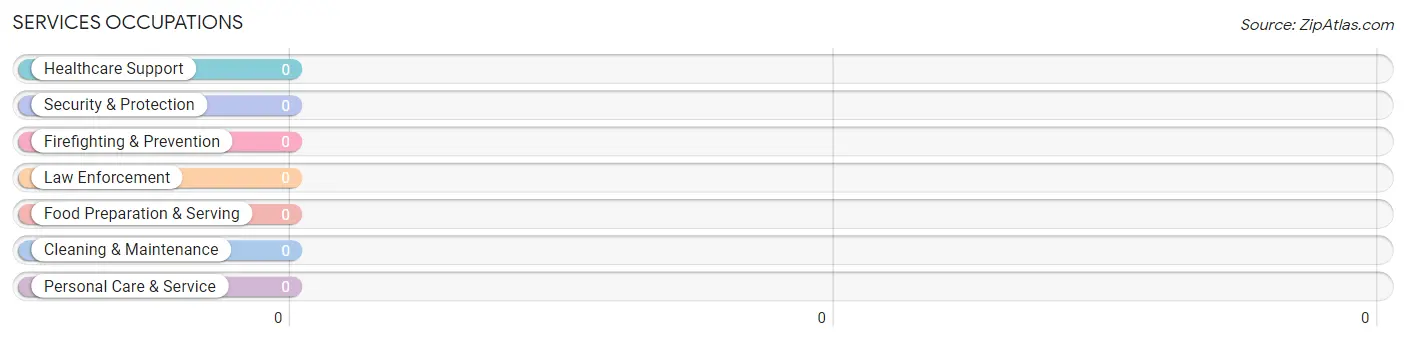
Services Occupations by Sex
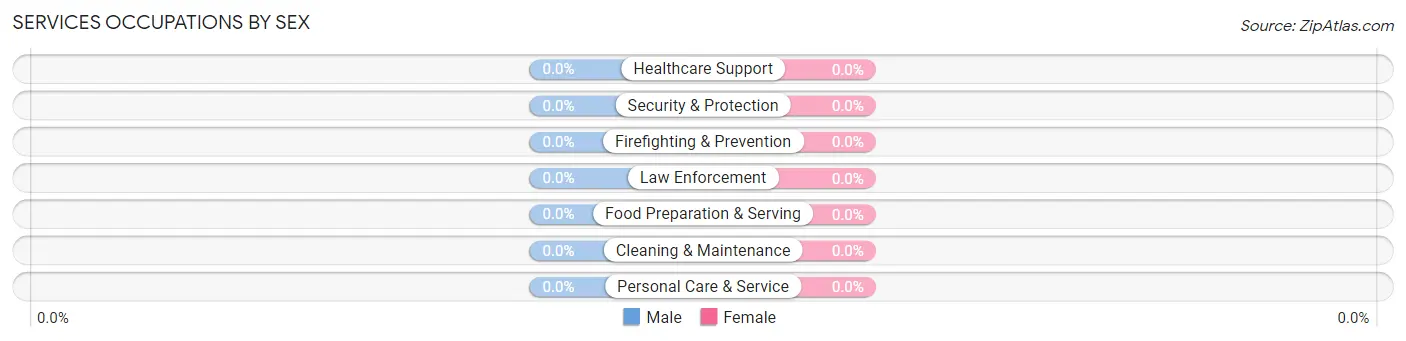
| Occupation | Male | Female |
| Healthcare Support | 0 (0.0%) | 0 (0.0%) |
| Security & Protection | 0 (0.0%) | 0 (0.0%) |
| Firefighting & Prevention | 0 (0.0%) | 0 (0.0%) |
| Law Enforcement | 0 (0.0%) | 0 (0.0%) |
| Food Preparation & Serving | 0 (0.0%) | 0 (0.0%) |
| Cleaning & Maintenance | 0 (0.0%) | 0 (0.0%) |
| Personal Care & Service | 0 (0.0%) | 0 (0.0%) |
| Total (Category) | 0 (0.0%) | 0 (0.0%) |
| Total (Overall) | 21 (63.6%) | 12 (36.4%) |
Sales and Office Occupations
Sales and Office Occupations by Sex
| Occupation | Male | Female |
| Sales & Related | 0 (0.0%) | 0 (0.0%) |
| Office & Administration | 0 (0.0%) | 0 (0.0%) |
| Total (Category) | 0 (0.0%) | 0 (0.0%) |
| Total (Overall) | 21 (63.6%) | 12 (36.4%) |
Natural Resources, Construction and Maintenance Occupations
Natural Resources, Construction and Maintenance Occupations by Sex
| Occupation | Male | Female |
| Farming, Fishing & Forestry | 0 (0.0%) | 0 (0.0%) |
| Construction & Extraction | 0 (0.0%) | 0 (0.0%) |
| Installation, Maintenance & Repair | 0 (0.0%) | 0 (0.0%) |
| Total (Category) | 0 (0.0%) | 0 (0.0%) |
| Total (Overall) | 21 (63.6%) | 12 (36.4%) |
Production, Transportation and Moving Occupations
The most common Production, Transportation and Moving occupations in Manton are , and Transportation (12 | 36.4%).
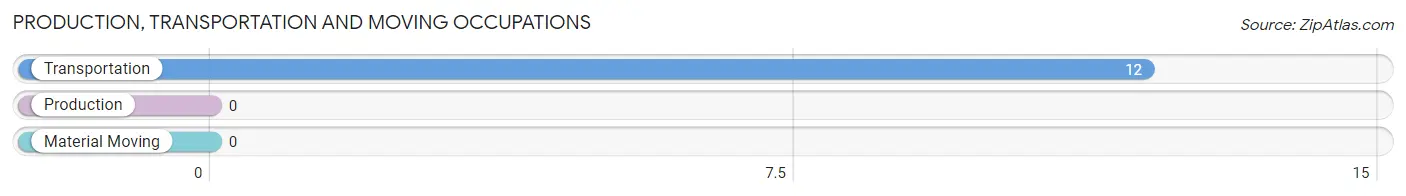
Production, Transportation and Moving Occupations by Sex
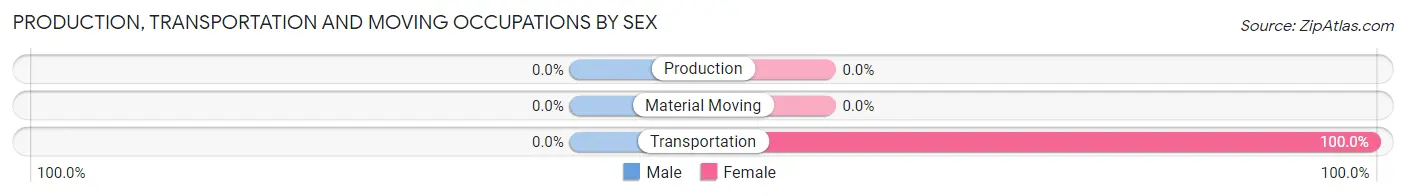
| Occupation | Male | Female |
| Production | 0 (0.0%) | 0 (0.0%) |
| Transportation | 0 (0.0%) | 12 (100.0%) |
| Material Moving | 0 (0.0%) | 0 (0.0%) |
| Total (Category) | 0 (0.0%) | 12 (100.0%) |
| Total (Overall) | 21 (63.6%) | 12 (36.4%) |
Employment Industries by Sex in Manton
Employment Industries in Manton
The major employment industries in Manton include Information (21 | 63.6%), and Educational Services (12 | 36.4%).
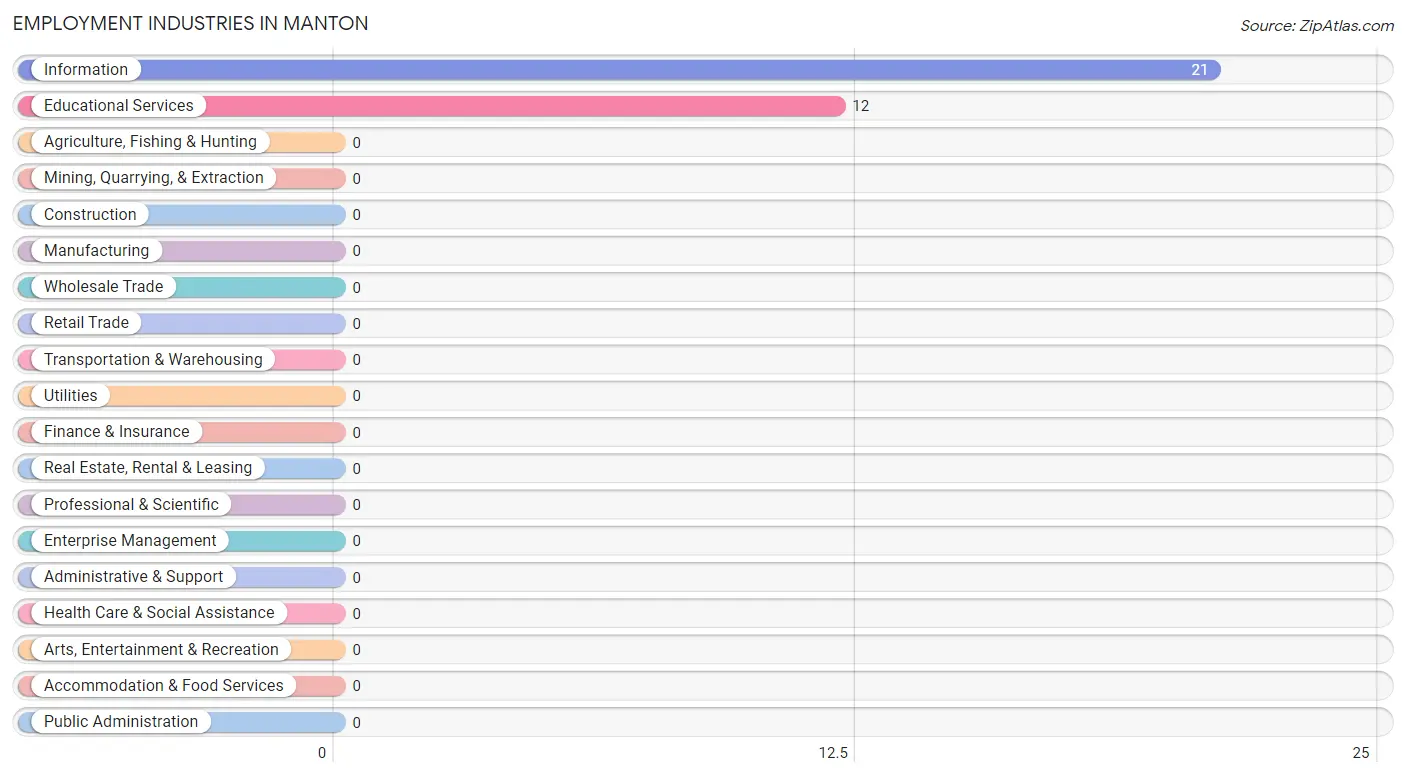
Employment Industries by Sex in Manton
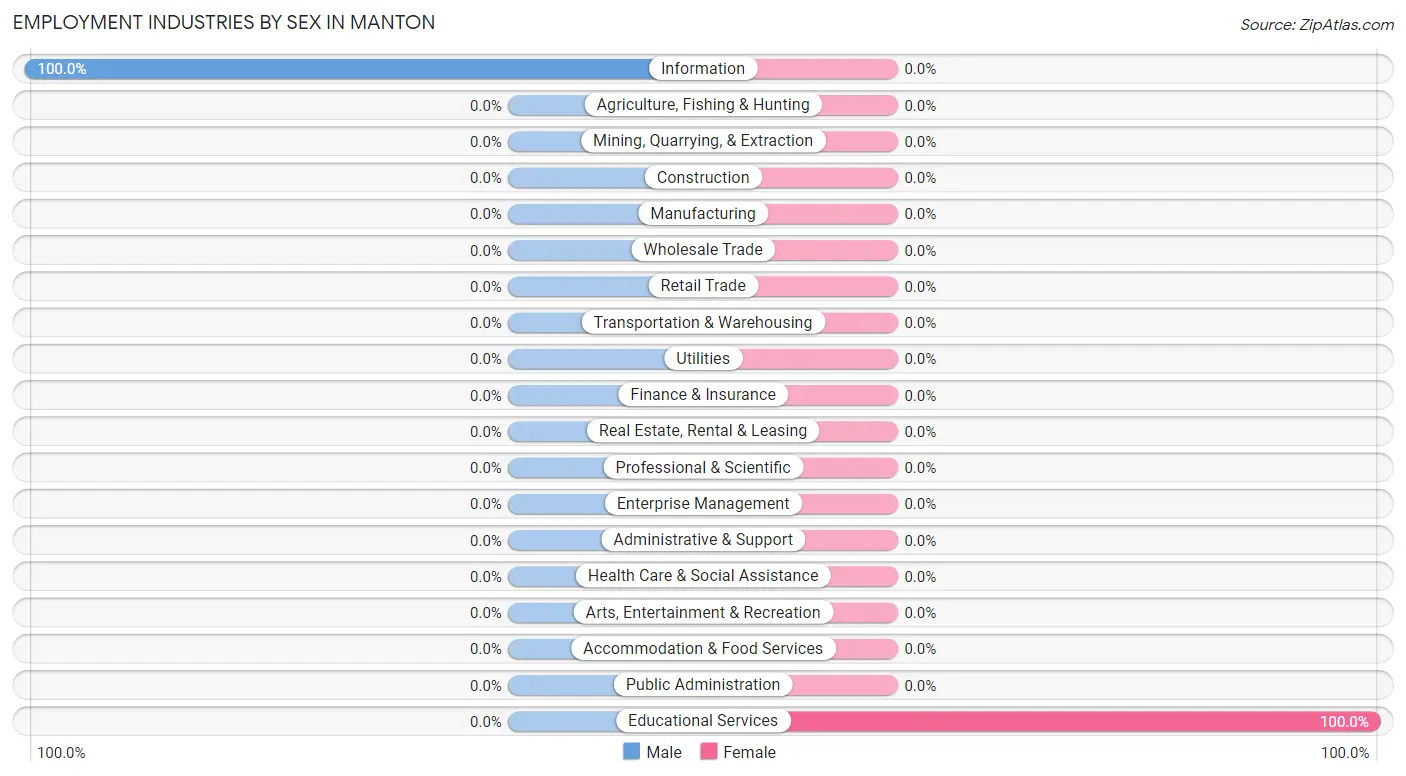
| Industry | Male | Female |
| Agriculture, Fishing & Hunting | 0 (0.0%) | 0 (0.0%) |
| Mining, Quarrying, & Extraction | 0 (0.0%) | 0 (0.0%) |
| Construction | 0 (0.0%) | 0 (0.0%) |
| Manufacturing | 0 (0.0%) | 0 (0.0%) |
| Wholesale Trade | 0 (0.0%) | 0 (0.0%) |
| Retail Trade | 0 (0.0%) | 0 (0.0%) |
| Transportation & Warehousing | 0 (0.0%) | 0 (0.0%) |
| Utilities | 0 (0.0%) | 0 (0.0%) |
| Information | 21 (100.0%) | 0 (0.0%) |
| Finance & Insurance | 0 (0.0%) | 0 (0.0%) |
| Real Estate, Rental & Leasing | 0 (0.0%) | 0 (0.0%) |
| Professional & Scientific | 0 (0.0%) | 0 (0.0%) |
| Enterprise Management | 0 (0.0%) | 0 (0.0%) |
| Administrative & Support | 0 (0.0%) | 0 (0.0%) |
| Educational Services | 0 (0.0%) | 12 (100.0%) |
| Health Care & Social Assistance | 0 (0.0%) | 0 (0.0%) |
| Arts, Entertainment & Recreation | 0 (0.0%) | 0 (0.0%) |
| Accommodation & Food Services | 0 (0.0%) | 0 (0.0%) |
| Public Administration | 0 (0.0%) | 0 (0.0%) |
| Total | 21 (63.6%) | 12 (36.4%) |
Education in Manton
School Enrollment in Manton
The most common levels of schooling among the 52 students in Manton are middle school (29 | 55.8%), and high school (23 | 44.2%).
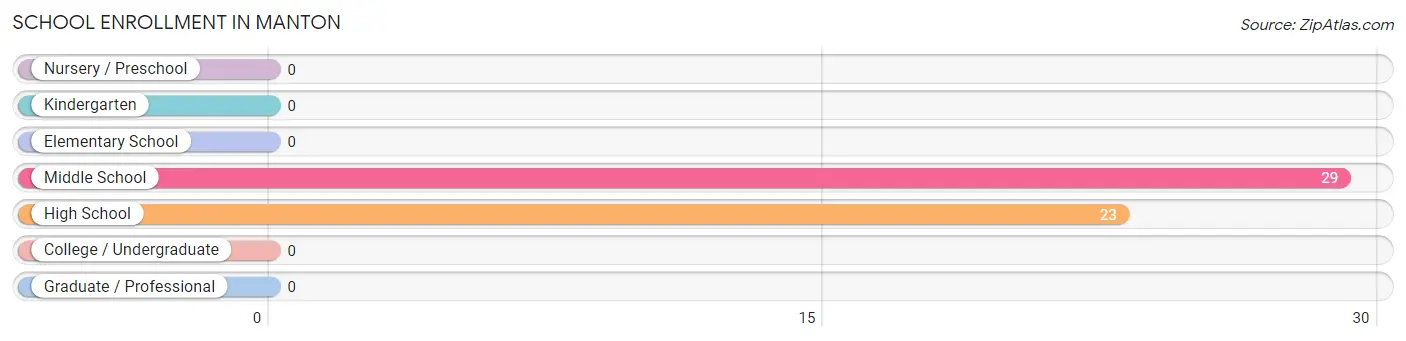
| School Level | # Students | % Students |
| Nursery / Preschool | 0 | 0.0% |
| Kindergarten | 0 | 0.0% |
| Elementary School | 0 | 0.0% |
| Middle School | 29 | 55.8% |
| High School | 23 | 44.2% |
| College / Undergraduate | 0 | 0.0% |
| Graduate / Professional | 0 | 0.0% |
| Total | 52 | 100.0% |
School Enrollment by Age by Funding Source in Manton
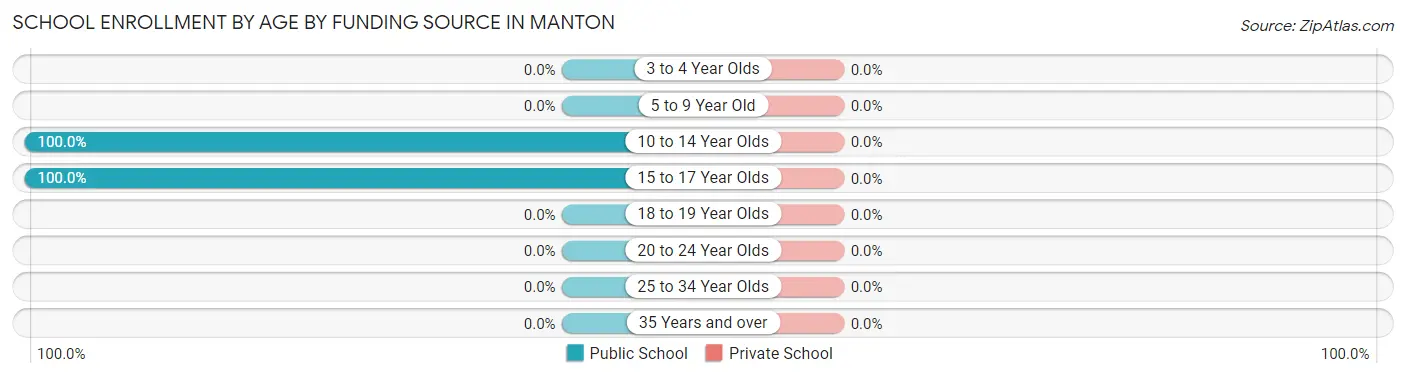
| Age Bracket | Public School | Private School |
| 3 to 4 Year Olds | 0 (0.0%) | 0 (0.0%) |
| 5 to 9 Year Old | 0 (0.0%) | 0 (0.0%) |
| 10 to 14 Year Olds | 29 (100.0%) | 0 (0.0%) |
| 15 to 17 Year Olds | 23 (100.0%) | 0 (0.0%) |
| 18 to 19 Year Olds | 0 (0.0%) | 0 (0.0%) |
| 20 to 24 Year Olds | 0 (0.0%) | 0 (0.0%) |
| 25 to 34 Year Olds | 0 (0.0%) | 0 (0.0%) |
| 35 Years and over | 0 (0.0%) | 0 (0.0%) |
| Total | 52 (100.0%) | 0 (0.0%) |
Educational Attainment by Field of Study in Manton
Education (11 | 61.1%), liberal arts & history (4 | 22.2%), and business (3 | 16.7%) are the most common fields of study among 18 individuals in Manton who have obtained a bachelor's degree or higher.
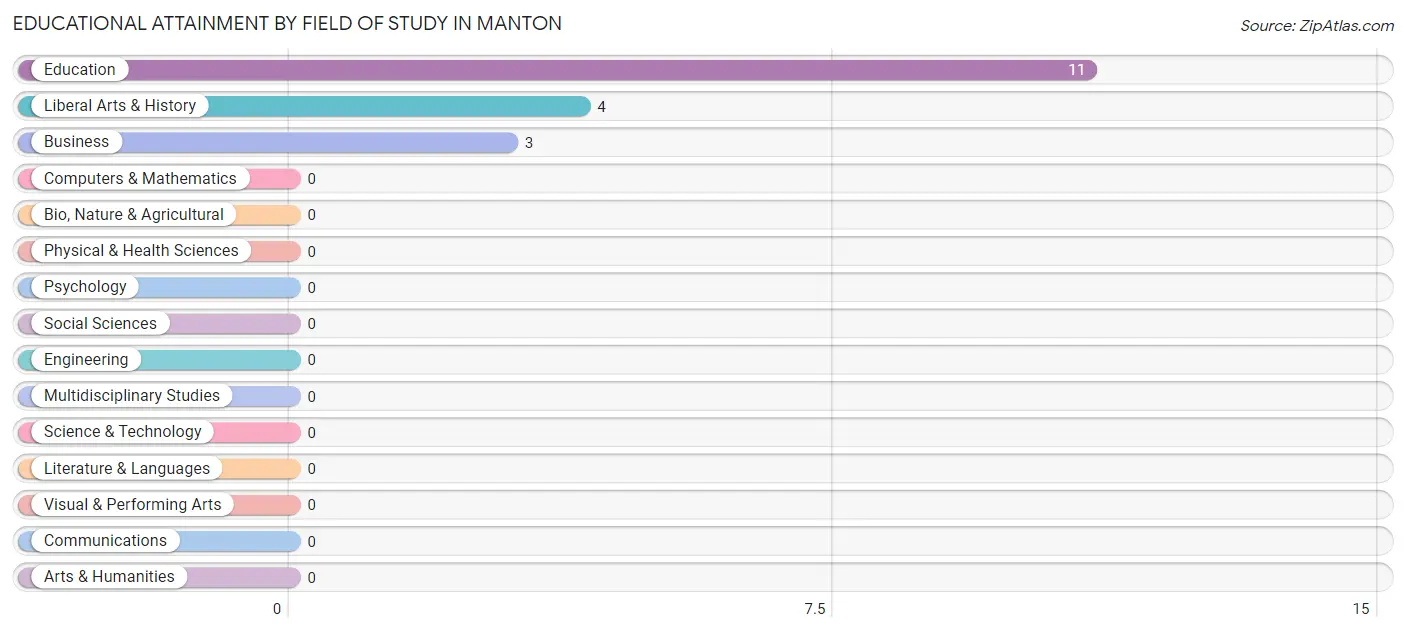
| Field of Study | # Graduates | % Graduates |
| Computers & Mathematics | 0 | 0.0% |
| Bio, Nature & Agricultural | 0 | 0.0% |
| Physical & Health Sciences | 0 | 0.0% |
| Psychology | 0 | 0.0% |
| Social Sciences | 0 | 0.0% |
| Engineering | 0 | 0.0% |
| Multidisciplinary Studies | 0 | 0.0% |
| Science & Technology | 0 | 0.0% |
| Business | 3 | 16.7% |
| Education | 11 | 61.1% |
| Literature & Languages | 0 | 0.0% |
| Liberal Arts & History | 4 | 22.2% |
| Visual & Performing Arts | 0 | 0.0% |
| Communications | 0 | 0.0% |
| Arts & Humanities | 0 | 0.0% |
| Total | 18 | 100.0% |
Transportation & Commute in Manton
Vehicle Availability by Sex in Manton
The most prevalent vehicle ownership categories in Manton are males with 2 vehicles (21, accounting for 100.0%) and females with 2 vehicles (0, making up 175.0%).
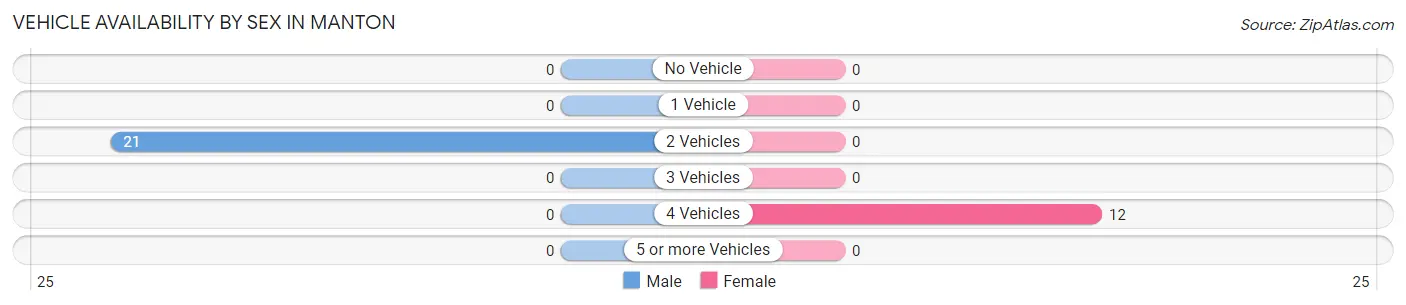
| Vehicles Available | Male | Female |
| No Vehicle | 0 (0.0%) | 0 (0.0%) |
| 1 Vehicle | 0 (0.0%) | 0 (0.0%) |
| 2 Vehicles | 21 (100.0%) | 0 (0.0%) |
| 3 Vehicles | 0 (0.0%) | 0 (0.0%) |
| 4 Vehicles | 0 (0.0%) | 12 (100.0%) |
| 5 or more Vehicles | 0 (0.0%) | 0 (0.0%) |
| Total | 21 (100.0%) | 12 (100.0%) |
Commute Time in Manton
The most frequently occuring commute durations in Manton are 90 or more minutes (21 commuters, 63.6%), 5 to 9 minutes (12 commuters, 36.4%), and less than 5 minutes (0 commuters, 0.0%).
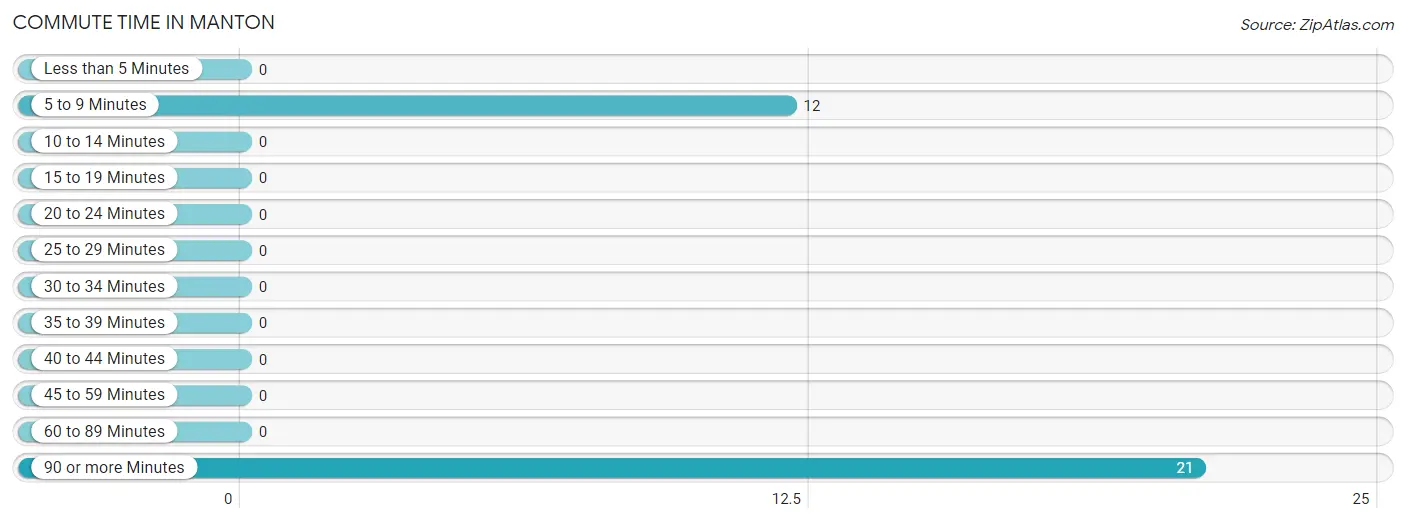
| Commute Time | # Commuters | % Commuters |
| Less than 5 Minutes | 0 | 0.0% |
| 5 to 9 Minutes | 12 | 36.4% |
| 10 to 14 Minutes | 0 | 0.0% |
| 15 to 19 Minutes | 0 | 0.0% |
| 20 to 24 Minutes | 0 | 0.0% |
| 25 to 29 Minutes | 0 | 0.0% |
| 30 to 34 Minutes | 0 | 0.0% |
| 35 to 39 Minutes | 0 | 0.0% |
| 40 to 44 Minutes | 0 | 0.0% |
| 45 to 59 Minutes | 0 | 0.0% |
| 60 to 89 Minutes | 0 | 0.0% |
| 90 or more Minutes | 21 | 63.6% |
Commute Time by Sex in Manton
The most common commute times in Manton are 90 or more minutes (21 commuters, 100.0%) for males and 5 to 9 minutes (12 commuters, 100.0%) for females.
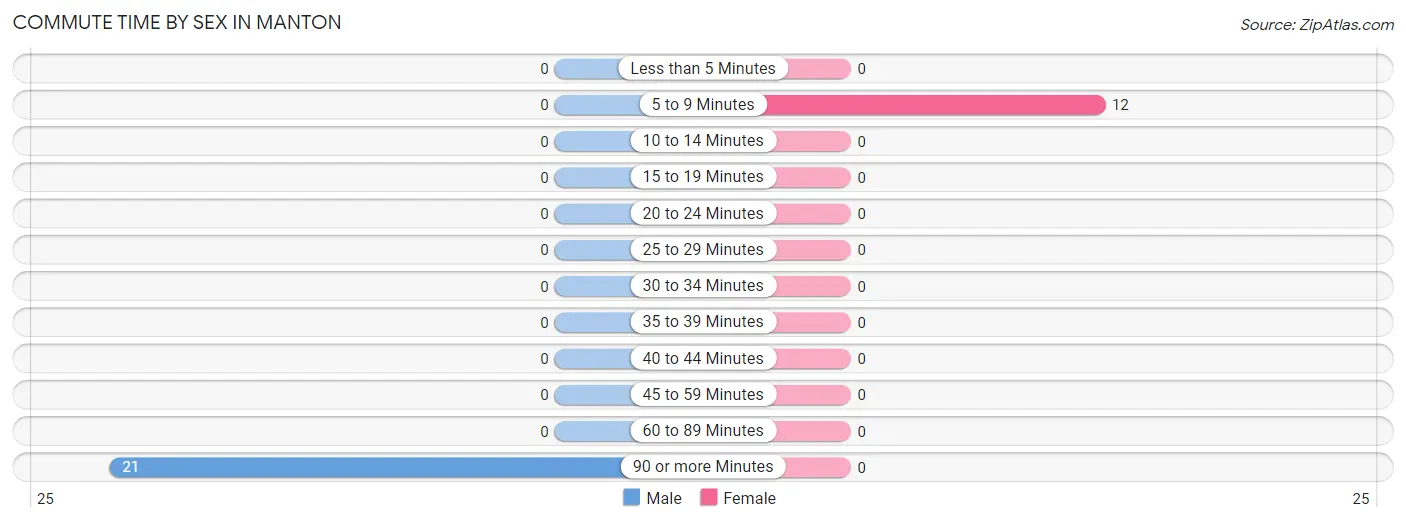
| Commute Time | Male | Female |
| Less than 5 Minutes | 0 (0.0%) | 0 (0.0%) |
| 5 to 9 Minutes | 0 (0.0%) | 12 (100.0%) |
| 10 to 14 Minutes | 0 (0.0%) | 0 (0.0%) |
| 15 to 19 Minutes | 0 (0.0%) | 0 (0.0%) |
| 20 to 24 Minutes | 0 (0.0%) | 0 (0.0%) |
| 25 to 29 Minutes | 0 (0.0%) | 0 (0.0%) |
| 30 to 34 Minutes | 0 (0.0%) | 0 (0.0%) |
| 35 to 39 Minutes | 0 (0.0%) | 0 (0.0%) |
| 40 to 44 Minutes | 0 (0.0%) | 0 (0.0%) |
| 45 to 59 Minutes | 0 (0.0%) | 0 (0.0%) |
| 60 to 89 Minutes | 0 (0.0%) | 0 (0.0%) |
| 90 or more Minutes | 21 (100.0%) | 0 (0.0%) |
Time of Departure to Work by Sex in Manton
The most frequent times of departure to work in Manton are 5:30 AM to 5:59 AM (21, 100.0%) for males and 6:00 AM to 6:29 AM (12, 100.0%) for females.
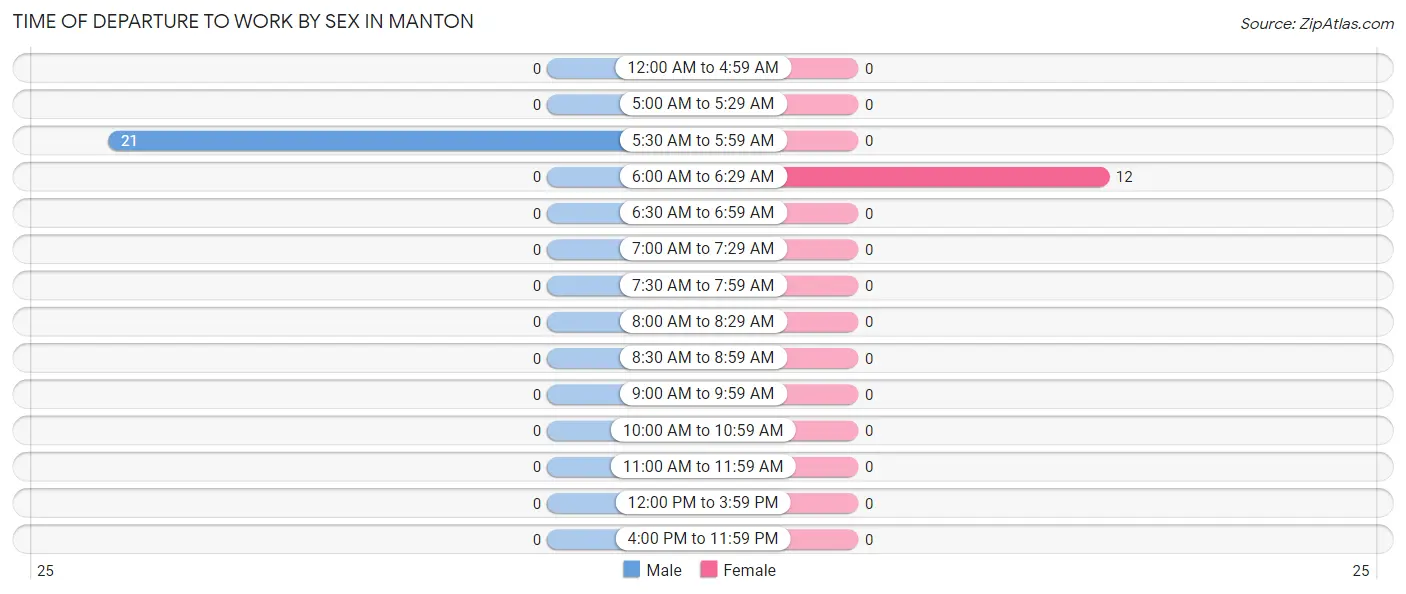
| Time of Departure | Male | Female |
| 12:00 AM to 4:59 AM | 0 (0.0%) | 0 (0.0%) |
| 5:00 AM to 5:29 AM | 0 (0.0%) | 0 (0.0%) |
| 5:30 AM to 5:59 AM | 21 (100.0%) | 0 (0.0%) |
| 6:00 AM to 6:29 AM | 0 (0.0%) | 12 (100.0%) |
| 6:30 AM to 6:59 AM | 0 (0.0%) | 0 (0.0%) |
| 7:00 AM to 7:29 AM | 0 (0.0%) | 0 (0.0%) |
| 7:30 AM to 7:59 AM | 0 (0.0%) | 0 (0.0%) |
| 8:00 AM to 8:29 AM | 0 (0.0%) | 0 (0.0%) |
| 8:30 AM to 8:59 AM | 0 (0.0%) | 0 (0.0%) |
| 9:00 AM to 9:59 AM | 0 (0.0%) | 0 (0.0%) |
| 10:00 AM to 10:59 AM | 0 (0.0%) | 0 (0.0%) |
| 11:00 AM to 11:59 AM | 0 (0.0%) | 0 (0.0%) |
| 12:00 PM to 3:59 PM | 0 (0.0%) | 0 (0.0%) |
| 4:00 PM to 11:59 PM | 0 (0.0%) | 0 (0.0%) |
| Total | 21 (100.0%) | 12 (100.0%) |
Housing Occupancy in Manton
Occupancy by Ownership in Manton
Of the total 144 dwellings in Manton, owner-occupied units account for 133 (92.4%), while renter-occupied units make up 11 (7.6%).
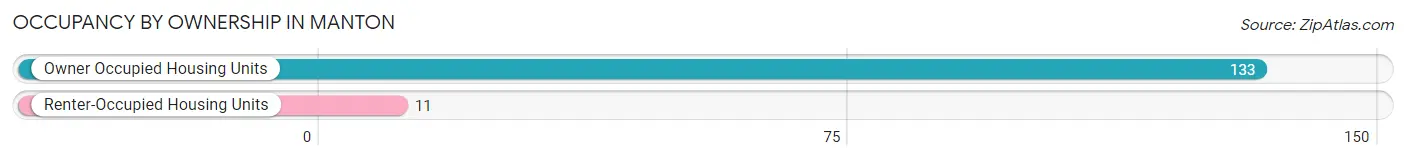
| Occupancy | # Housing Units | % Housing Units |
| Owner Occupied Housing Units | 133 | 92.4% |
| Renter-Occupied Housing Units | 11 | 7.6% |
| Total Occupied Housing Units | 144 | 100.0% |
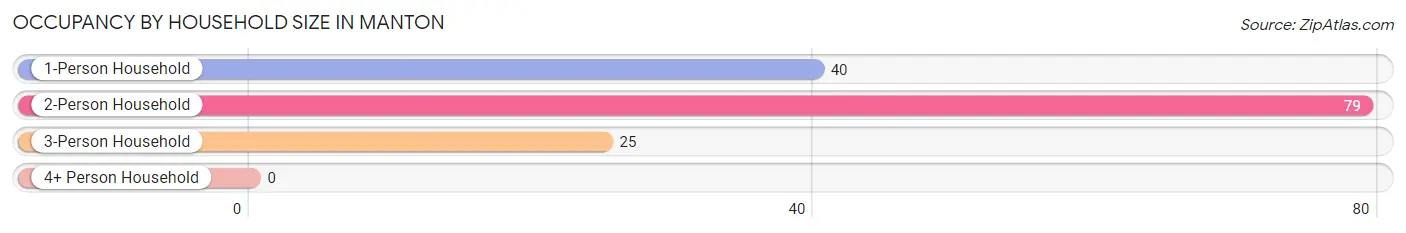
Occupancy by Household Size in Manton
| Household Size | # Housing Units | % Housing Units |
| 1-Person Household | 40 | 27.8% |
| 2-Person Household | 79 | 54.9% |
| 3-Person Household | 25 | 17.4% |
| 4+ Person Household | 0 | 0.0% |
| Total Housing Units | 144 | 100.0% |
Occupancy by Ownership by Household Size in Manton
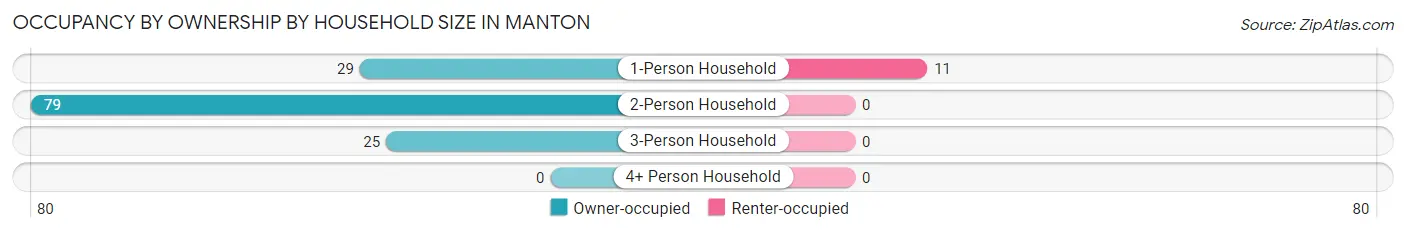
| Household Size | Owner-occupied | Renter-occupied |
| 1-Person Household | 29 (72.5%) | 11 (27.5%) |
| 2-Person Household | 79 (100.0%) | 0 (0.0%) |
| 3-Person Household | 25 (100.0%) | 0 (0.0%) |
| 4+ Person Household | 0 (0.0%) | 0 (0.0%) |
| Total Housing Units | 133 (92.4%) | 11 (7.6%) |
Occupancy by Educational Attainment in Manton

| Household Size | Owner-occupied | Renter-occupied |
| Less than High School | 21 (100.0%) | 0 (0.0%) |
| High School Diploma | 25 (100.0%) | 0 (0.0%) |
| College/Associate Degree | 76 (87.4%) | 11 (12.6%) |
| Bachelor's Degree or higher | 11 (100.0%) | 0 (0.0%) |
Occupancy by Age of Householder in Manton
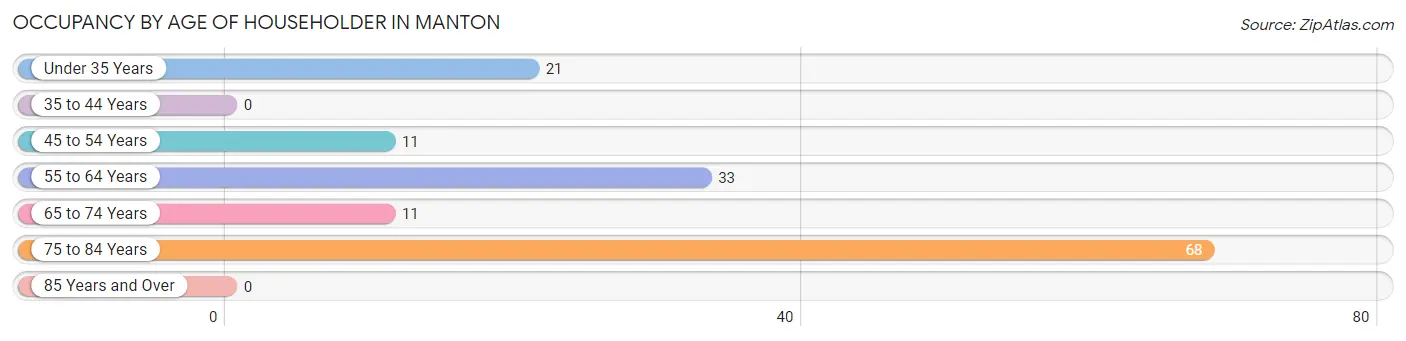
| Age Bracket | # Households | % Households |
| Under 35 Years | 21 | 14.6% |
| 35 to 44 Years | 0 | 0.0% |
| 45 to 54 Years | 11 | 7.6% |
| 55 to 64 Years | 33 | 22.9% |
| 65 to 74 Years | 11 | 7.6% |
| 75 to 84 Years | 68 | 47.2% |
| 85 Years and Over | 0 | 0.0% |
| Total | 144 | 100.0% |
Housing Finances in Manton
Median Income by Occupancy in Manton
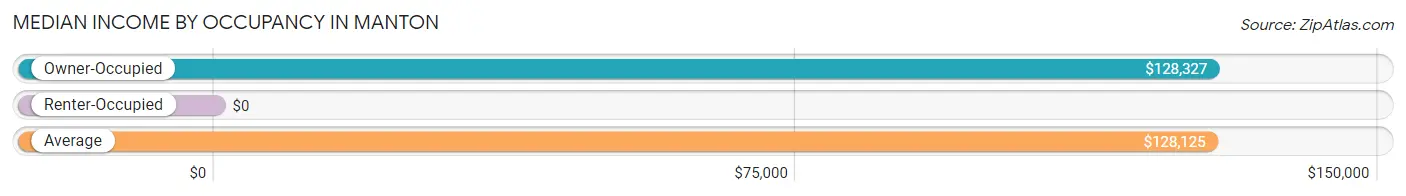
| Occupancy Type | # Households | Median Income |
| Owner-Occupied | 133 (92.4%) | $128,327 |
| Renter-Occupied | 11 (7.6%) | $0 |
| Average | 144 (100.0%) | $128,125 |
Occupancy by Householder Income Bracket in Manton
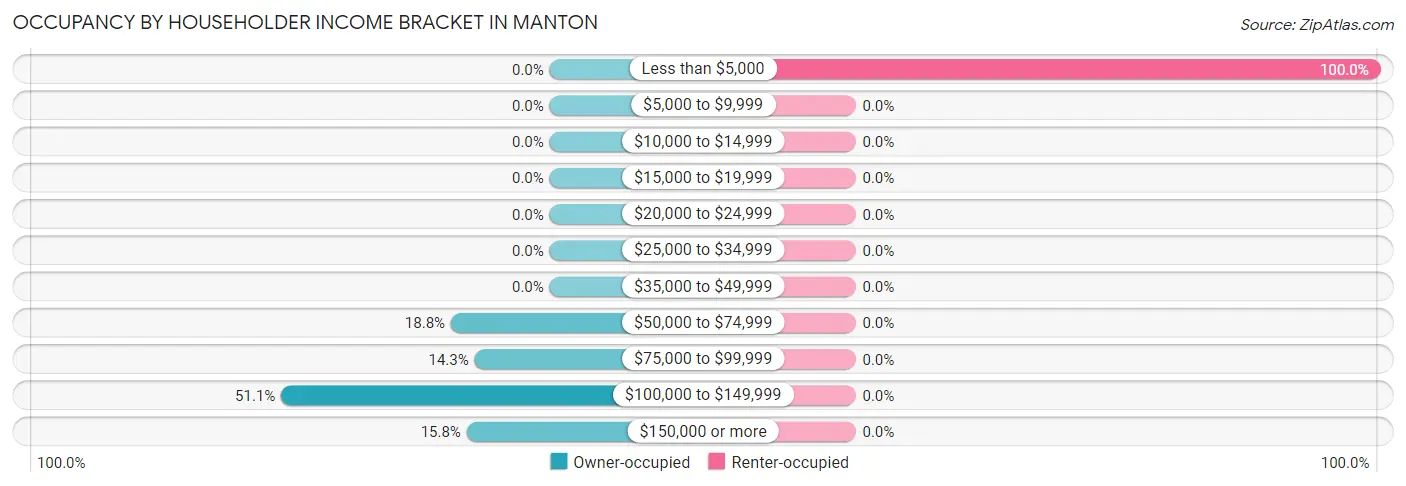
| Income Bracket | Owner-occupied | Renter-occupied |
| Less than $5,000 | 0 (0.0%) | 11 (100.0%) |
| $5,000 to $9,999 | 0 (0.0%) | 0 (0.0%) |
| $10,000 to $14,999 | 0 (0.0%) | 0 (0.0%) |
| $15,000 to $19,999 | 0 (0.0%) | 0 (0.0%) |
| $20,000 to $24,999 | 0 (0.0%) | 0 (0.0%) |
| $25,000 to $34,999 | 0 (0.0%) | 0 (0.0%) |
| $35,000 to $49,999 | 0 (0.0%) | 0 (0.0%) |
| $50,000 to $74,999 | 25 (18.8%) | 0 (0.0%) |
| $75,000 to $99,999 | 19 (14.3%) | 0 (0.0%) |
| $100,000 to $149,999 | 68 (51.1%) | 0 (0.0%) |
| $150,000 or more | 21 (15.8%) | 0 (0.0%) |
| Total | 133 (100.0%) | 11 (100.0%) |
Monthly Housing Cost Tiers in Manton
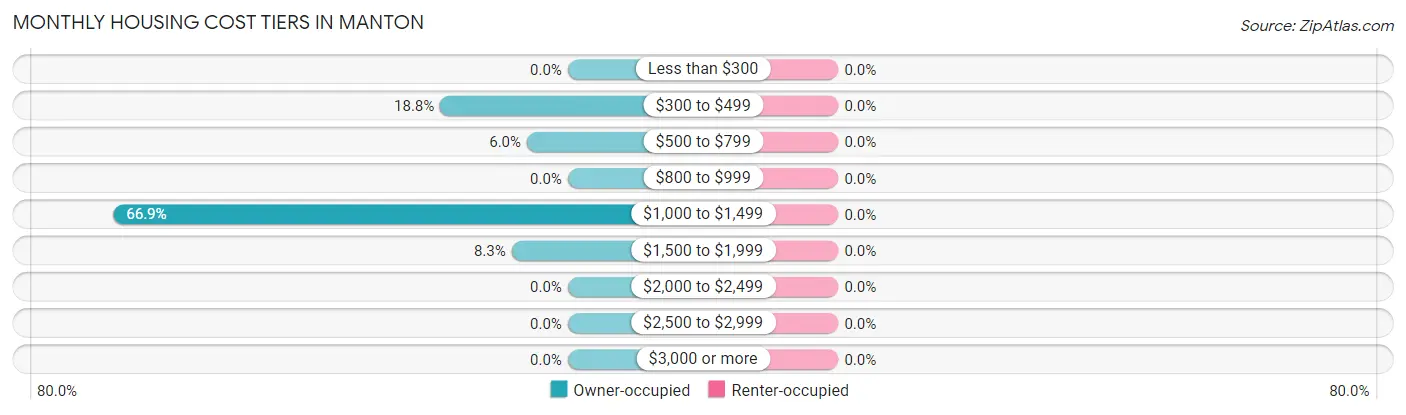
| Monthly Cost | Owner-occupied | Renter-occupied |
| Less than $300 | 0 (0.0%) | 0 (0.0%) |
| $300 to $499 | 25 (18.8%) | 0 (0.0%) |
| $500 to $799 | 8 (6.0%) | 0 (0.0%) |
| $800 to $999 | 0 (0.0%) | 0 (0.0%) |
| $1,000 to $1,499 | 89 (66.9%) | 0 (0.0%) |
| $1,500 to $1,999 | 11 (8.3%) | 0 (0.0%) |
| $2,000 to $2,499 | 0 (0.0%) | 0 (0.0%) |
| $2,500 to $2,999 | 0 (0.0%) | 0 (0.0%) |
| $3,000 or more | 0 (0.0%) | 0 (0.0%) |
| Total | 133 (100.0%) | 11 (100.0%) |
Physical Housing Characteristics in Manton
Housing Structures in Manton
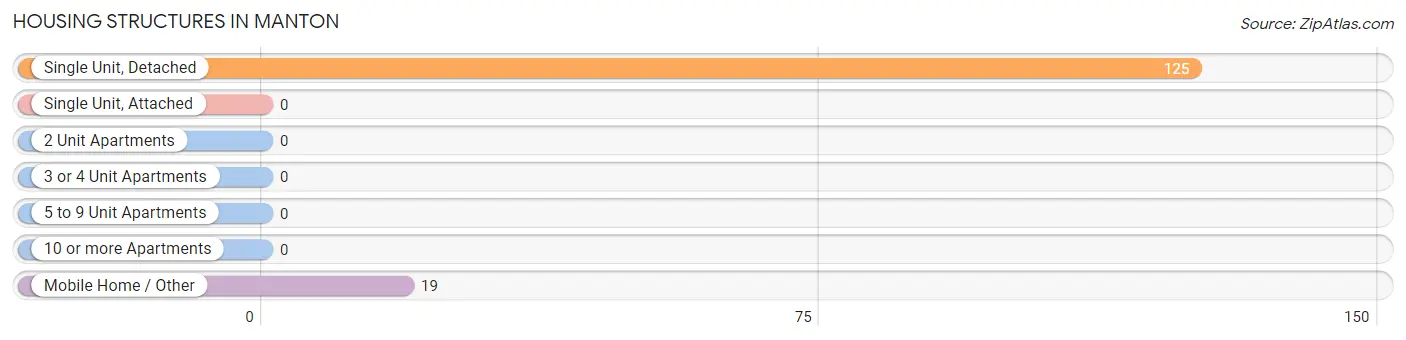
| Structure Type | # Housing Units | % Housing Units |
| Single Unit, Detached | 125 | 86.8% |
| Single Unit, Attached | 0 | 0.0% |
| 2 Unit Apartments | 0 | 0.0% |
| 3 or 4 Unit Apartments | 0 | 0.0% |
| 5 to 9 Unit Apartments | 0 | 0.0% |
| 10 or more Apartments | 0 | 0.0% |
| Mobile Home / Other | 19 | 13.2% |
| Total | 144 | 100.0% |
Housing Structures by Occupancy in Manton
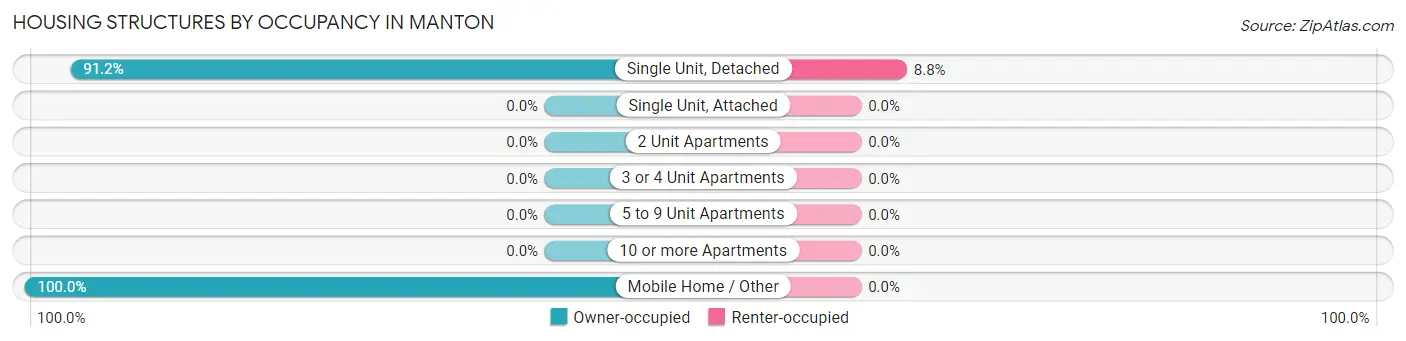
| Structure Type | Owner-occupied | Renter-occupied |
| Single Unit, Detached | 114 (91.2%) | 11 (8.8%) |
| Single Unit, Attached | 0 (0.0%) | 0 (0.0%) |
| 2 Unit Apartments | 0 (0.0%) | 0 (0.0%) |
| 3 or 4 Unit Apartments | 0 (0.0%) | 0 (0.0%) |
| 5 to 9 Unit Apartments | 0 (0.0%) | 0 (0.0%) |
| 10 or more Apartments | 0 (0.0%) | 0 (0.0%) |
| Mobile Home / Other | 19 (100.0%) | 0 (0.0%) |
| Total | 133 (92.4%) | 11 (7.6%) |
Housing Structures by Number of Rooms in Manton
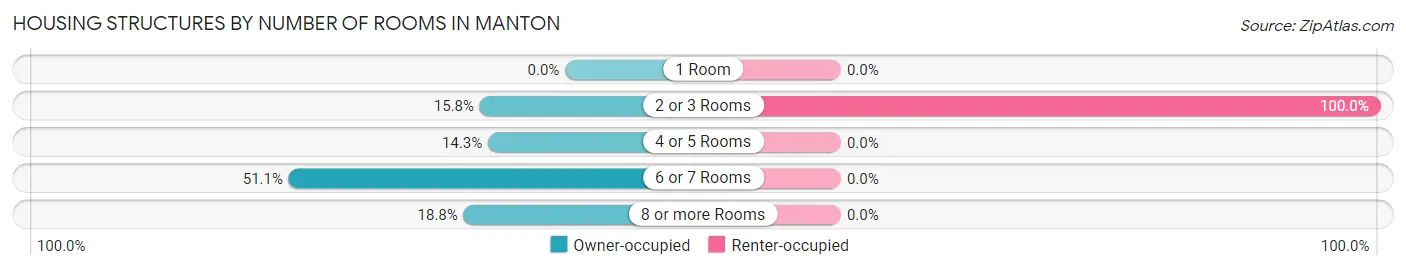
| Number of Rooms | Owner-occupied | Renter-occupied |
| 1 Room | 0 (0.0%) | 0 (0.0%) |
| 2 or 3 Rooms | 21 (15.8%) | 11 (100.0%) |
| 4 or 5 Rooms | 19 (14.3%) | 0 (0.0%) |
| 6 or 7 Rooms | 68 (51.1%) | 0 (0.0%) |
| 8 or more Rooms | 25 (18.8%) | 0 (0.0%) |
| Total | 133 (100.0%) | 11 (100.0%) |
Housing Structure by Heating Type in Manton
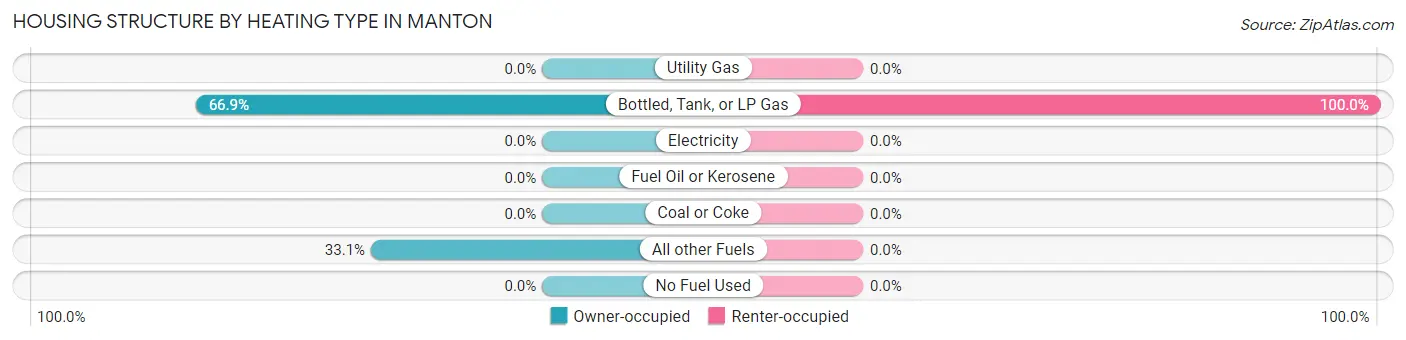
| Heating Type | Owner-occupied | Renter-occupied |
| Utility Gas | 0 (0.0%) | 0 (0.0%) |
| Bottled, Tank, or LP Gas | 89 (66.9%) | 11 (100.0%) |
| Electricity | 0 (0.0%) | 0 (0.0%) |
| Fuel Oil or Kerosene | 0 (0.0%) | 0 (0.0%) |
| Coal or Coke | 0 (0.0%) | 0 (0.0%) |
| All other Fuels | 44 (33.1%) | 0 (0.0%) |
| No Fuel Used | 0 (0.0%) | 0 (0.0%) |
| Total | 133 (100.0%) | 11 (100.0%) |
Household Vehicle Usage in Manton
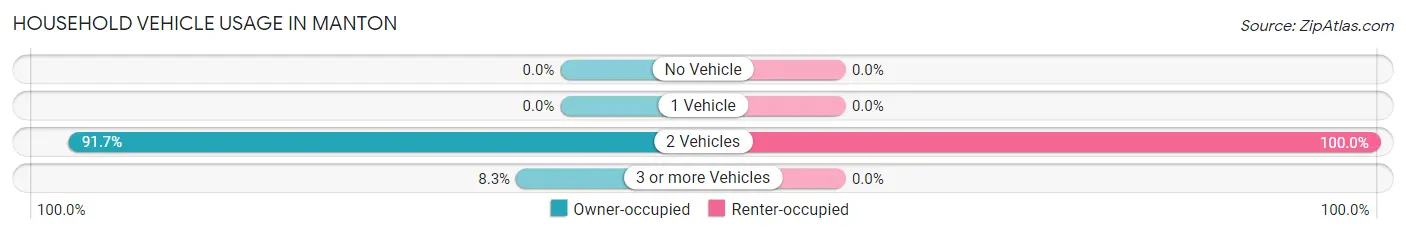
| Vehicles per Household | Owner-occupied | Renter-occupied |
| No Vehicle | 0 (0.0%) | 0 (0.0%) |
| 1 Vehicle | 0 (0.0%) | 0 (0.0%) |
| 2 Vehicles | 122 (91.7%) | 11 (100.0%) |
| 3 or more Vehicles | 11 (8.3%) | 0 (0.0%) |
| Total | 133 (100.0%) | 11 (100.0%) |
Real Estate & Mortgages in Manton
Real Estate and Mortgage Overview in Manton
| Characteristic | Without Mortgage | With Mortgage |
| Housing Units | 114 | 19 |
| Median Property Value | - | - |
| Median Household Income | $128,676 | $0 |
| Monthly Housing Costs | $1,436 | $0 |
| Real Estate Taxes | $3,360 | $0 |
Property Value by Mortgage Status in Manton
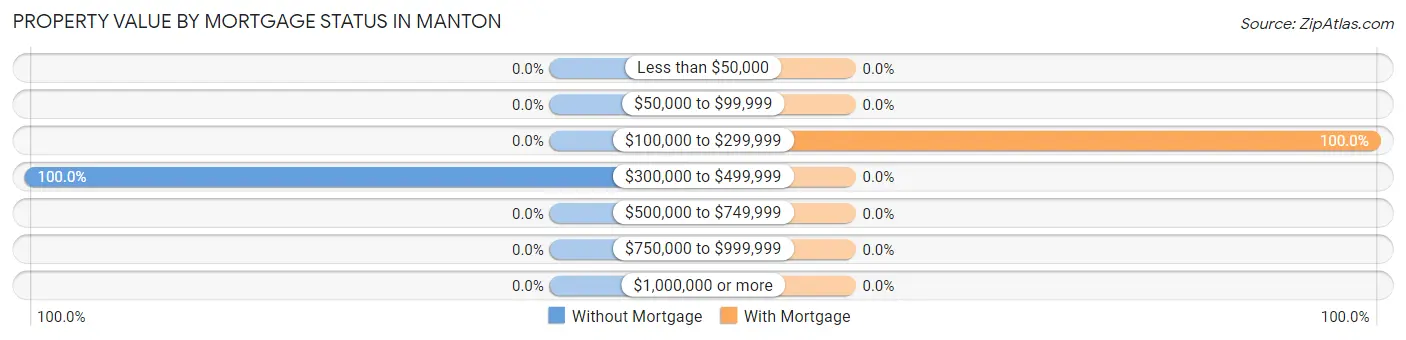
| Property Value | Without Mortgage | With Mortgage |
| Less than $50,000 | 0 (0.0%) | 0 (0.0%) |
| $50,000 to $99,999 | 0 (0.0%) | 0 (0.0%) |
| $100,000 to $299,999 | 0 (0.0%) | 19 (100.0%) |
| $300,000 to $499,999 | 114 (100.0%) | 0 (0.0%) |
| $500,000 to $749,999 | 0 (0.0%) | 0 (0.0%) |
| $750,000 to $999,999 | 0 (0.0%) | 0 (0.0%) |
| $1,000,000 or more | 0 (0.0%) | 0 (0.0%) |
| Total | 114 (100.0%) | 19 (100.0%) |
Household Income by Mortgage Status in Manton
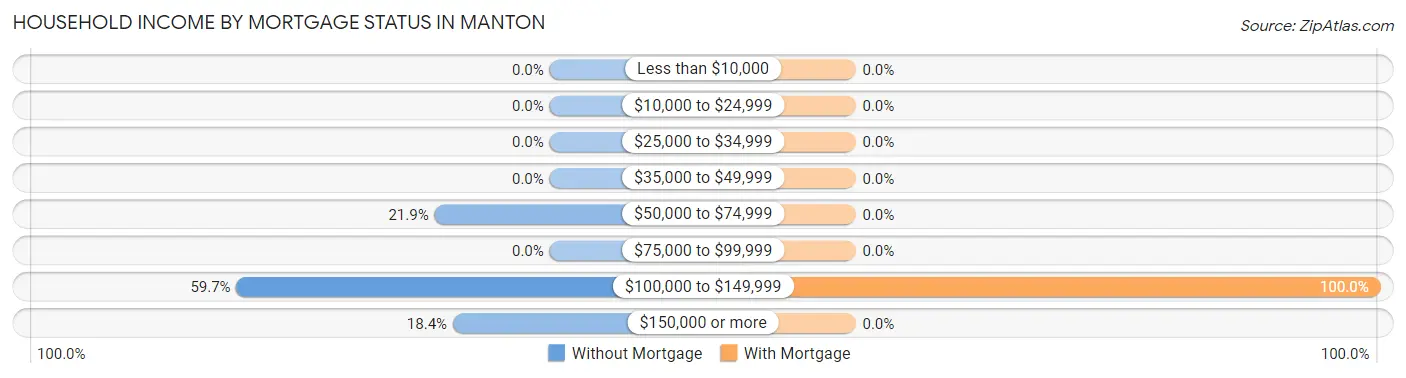
| Household Income | Without Mortgage | With Mortgage |
| Less than $10,000 | 0 (0.0%) | 0 (0.0%) |
| $10,000 to $24,999 | 0 (0.0%) | 0 (0.0%) |
| $25,000 to $34,999 | 0 (0.0%) | 0 (0.0%) |
| $35,000 to $49,999 | 0 (0.0%) | 0 (0.0%) |
| $50,000 to $74,999 | 25 (21.9%) | 0 (0.0%) |
| $75,000 to $99,999 | 0 (0.0%) | 0 (0.0%) |
| $100,000 to $149,999 | 68 (59.7%) | 19 (100.0%) |
| $150,000 or more | 21 (18.4%) | 0 (0.0%) |
| Total | 114 (100.0%) | 19 (100.0%) |
Property Value to Household Income Ratio in Manton
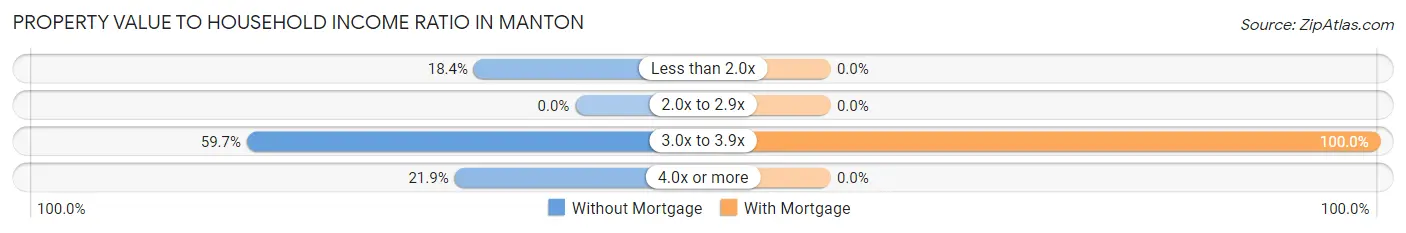
| Value-to-Income Ratio | Without Mortgage | With Mortgage |
| Less than 2.0x | 21 (18.4%) | 0 (0.0%) |
| 2.0x to 2.9x | 0 (0.0%) | 0 (0.0%) |
| 3.0x to 3.9x | 68 (59.7%) | 19 (100.0%) |
| 4.0x or more | 25 (21.9%) | 0 (0.0%) |
| Total | 114 (100.0%) | 19 (100.0%) |
Real Estate Taxes by Mortgage Status in Manton
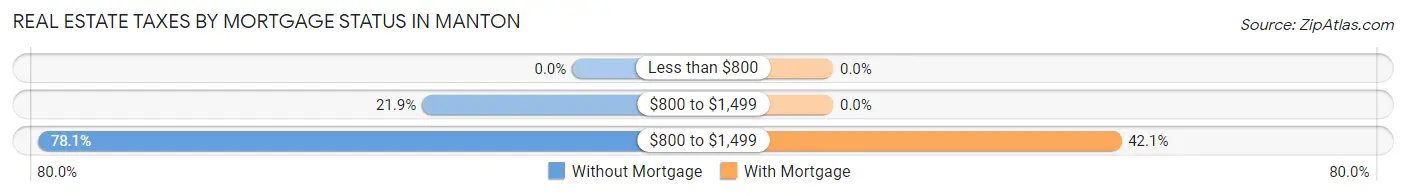
| Property Taxes | Without Mortgage | With Mortgage |
| Less than $800 | 0 (0.0%) | 0 (0.0%) |
| $800 to $1,499 | 25 (21.9%) | 0 (0.0%) |
| $800 to $1,499 | 89 (78.1%) | 8 (42.1%) |
| Total | 114 (100.0%) | 19 (100.0%) |
Health & Disability in Manton
Health Insurance Coverage by Age in Manton
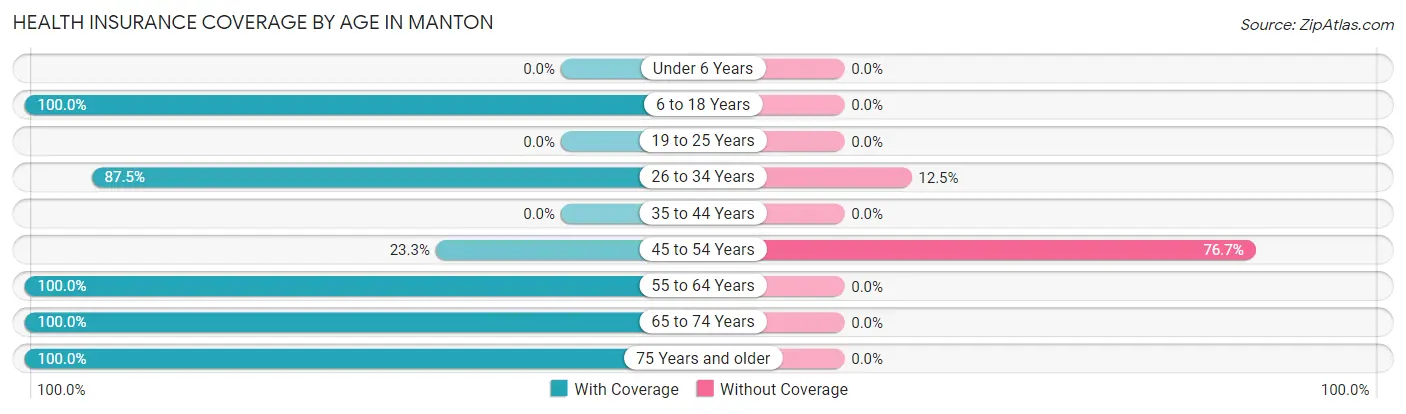
| Age Bracket | With Coverage | Without Coverage |
| Under 6 Years | 0 (0.0%) | 0 (0.0%) |
| 6 to 18 Years | 52 (100.0%) | 0 (0.0%) |
| 19 to 25 Years | 0 (0.0%) | 0 (0.0%) |
| 26 to 34 Years | 21 (87.5%) | 3 (12.5%) |
| 35 to 44 Years | 0 (0.0%) | 0 (0.0%) |
| 45 to 54 Years | 7 (23.3%) | 23 (76.7%) |
| 55 to 64 Years | 33 (100.0%) | 0 (0.0%) |
| 65 to 74 Years | 98 (100.0%) | 0 (0.0%) |
| 75 Years and older | 68 (100.0%) | 0 (0.0%) |
| Total | 279 (91.5%) | 26 (8.5%) |
Health Insurance Coverage by Citizenship Status in Manton
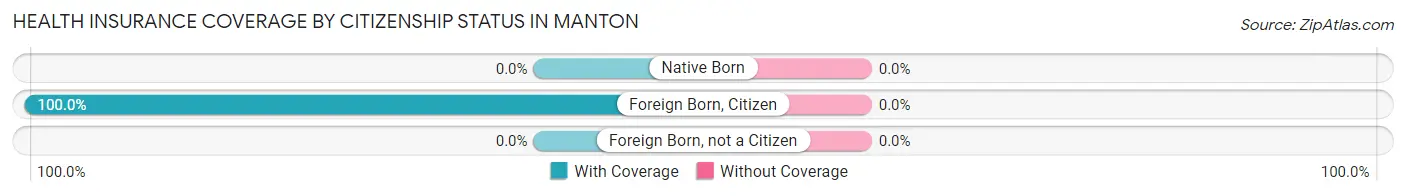
| Citizenship Status | With Coverage | Without Coverage |
| Native Born | 0 (0.0%) | 0 (0.0%) |
| Foreign Born, Citizen | 52 (100.0%) | 0 (0.0%) |
| Foreign Born, not a Citizen | 0 (0.0%) | 0 (0.0%) |
Health Insurance Coverage by Household Income in Manton
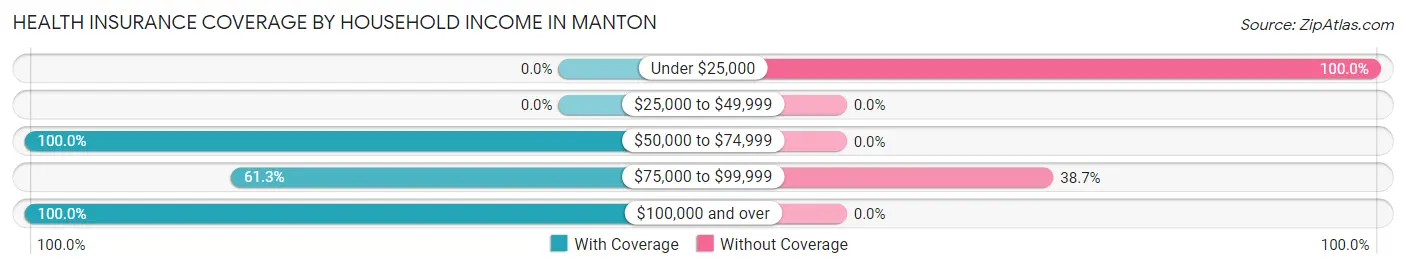
| Household Income | With Coverage | Without Coverage |
| Under $25,000 | 0 (0.0%) | 11 (100.0%) |
| $25,000 to $49,999 | 0 (0.0%) | 0 (0.0%) |
| $50,000 to $74,999 | 77 (100.0%) | 0 (0.0%) |
| $75,000 to $99,999 | 19 (61.3%) | 12 (38.7%) |
| $100,000 and over | 176 (100.0%) | 0 (0.0%) |
Public vs Private Health Insurance Coverage by Age in Manton
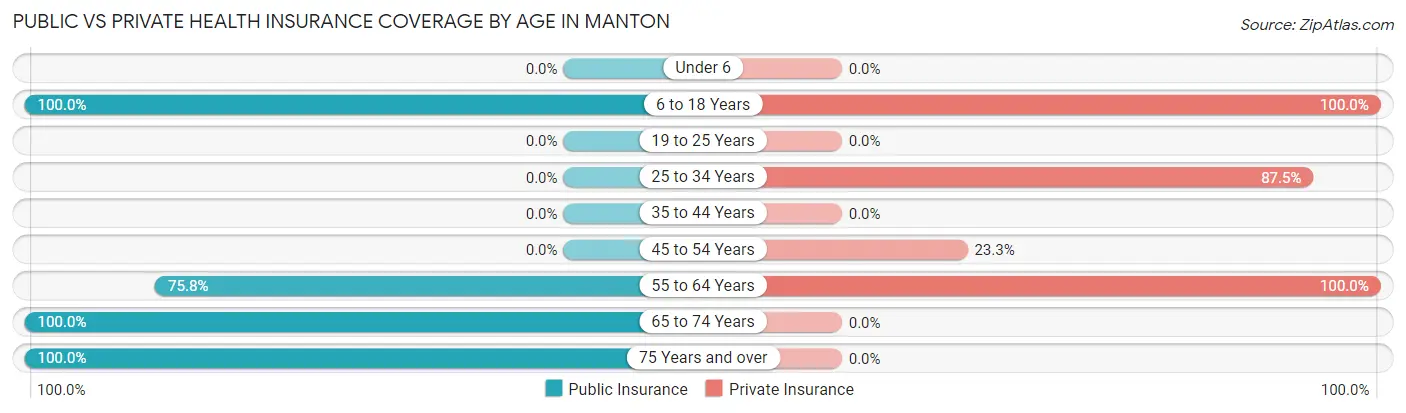
| Age Bracket | Public Insurance | Private Insurance |
| Under 6 | 0 (0.0%) | 0 (0.0%) |
| 6 to 18 Years | 52 (100.0%) | 52 (100.0%) |
| 19 to 25 Years | 0 (0.0%) | 0 (0.0%) |
| 25 to 34 Years | 0 (0.0%) | 21 (87.5%) |
| 35 to 44 Years | 0 (0.0%) | 0 (0.0%) |
| 45 to 54 Years | 0 (0.0%) | 7 (23.3%) |
| 55 to 64 Years | 25 (75.8%) | 33 (100.0%) |
| 65 to 74 Years | 98 (100.0%) | 0 (0.0%) |
| 75 Years and over | 68 (100.0%) | 0 (0.0%) |
| Total | 243 (79.7%) | 113 (37.0%) |
Disability Status by Sex by Age in Manton
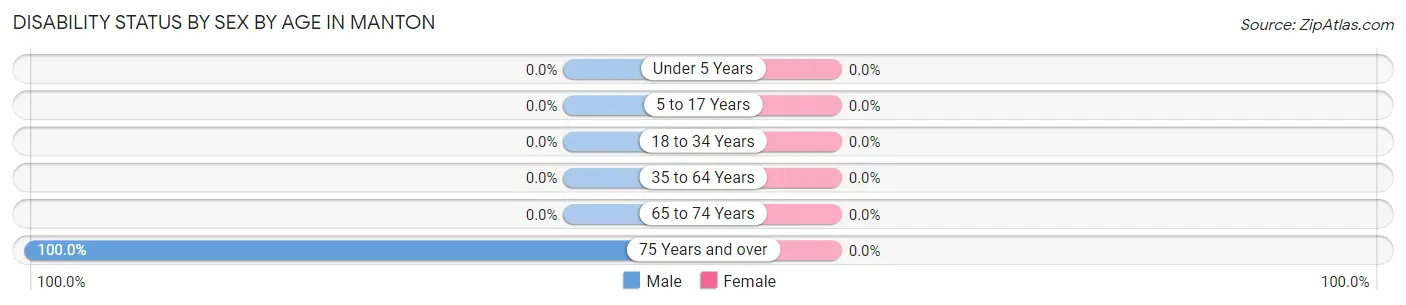
| Age Bracket | Male | Female |
| Under 5 Years | 0 (0.0%) | 0 (0.0%) |
| 5 to 17 Years | 0 (0.0%) | 0 (0.0%) |
| 18 to 34 Years | 0 (0.0%) | 0 (0.0%) |
| 35 to 64 Years | 0 (0.0%) | 0 (0.0%) |
| 65 to 74 Years | 0 (0.0%) | 0 (0.0%) |
| 75 Years and over | 68 (100.0%) | 0 (0.0%) |
Disability Class by Sex by Age in Manton
Disability Class: Hearing Difficulty
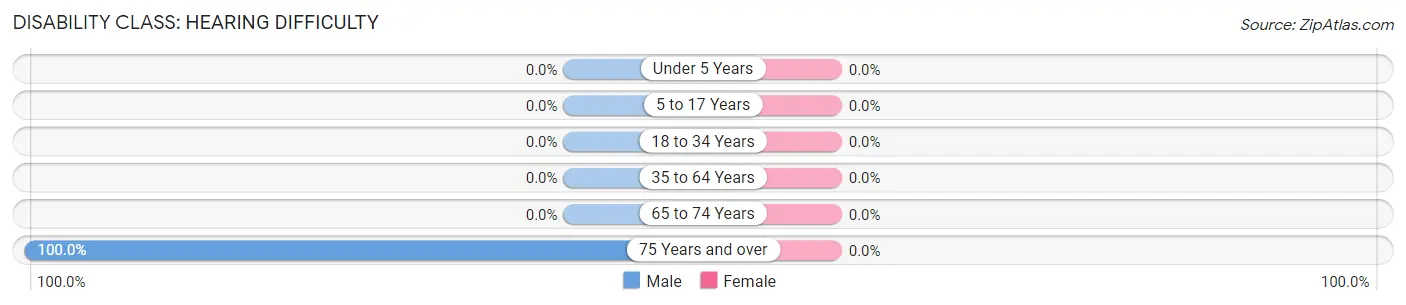
| Age Bracket | Male | Female |
| Under 5 Years | 0 (0.0%) | 0 (0.0%) |
| 5 to 17 Years | 0 (0.0%) | 0 (0.0%) |
| 18 to 34 Years | 0 (0.0%) | 0 (0.0%) |
| 35 to 64 Years | 0 (0.0%) | 0 (0.0%) |
| 65 to 74 Years | 0 (0.0%) | 0 (0.0%) |
| 75 Years and over | 68 (100.0%) | 0 (0.0%) |
Disability Class: Vision Difficulty
| Age Bracket | Male | Female |
| Under 5 Years | 0 (0.0%) | 0 (0.0%) |
| 5 to 17 Years | 0 (0.0%) | 0 (0.0%) |
| 18 to 34 Years | 0 (0.0%) | 0 (0.0%) |
| 35 to 64 Years | 0 (0.0%) | 0 (0.0%) |
| 65 to 74 Years | 0 (0.0%) | 0 (0.0%) |
| 75 Years and over | 0 (0.0%) | 0 (0.0%) |
Disability Class: Cognitive Difficulty

| Age Bracket | Male | Female |
| 5 to 17 Years | 0 (0.0%) | 0 (0.0%) |
| 18 to 34 Years | 0 (0.0%) | 0 (0.0%) |
| 35 to 64 Years | 0 (0.0%) | 0 (0.0%) |
| 65 to 74 Years | 0 (0.0%) | 0 (0.0%) |
| 75 Years and over | 0 (0.0%) | 0 (0.0%) |
Disability Class: Ambulatory Difficulty
| Age Bracket | Male | Female |
| 5 to 17 Years | 0 (0.0%) | 0 (0.0%) |
| 18 to 34 Years | 0 (0.0%) | 0 (0.0%) |
| 35 to 64 Years | 0 (0.0%) | 0 (0.0%) |
| 65 to 74 Years | 0 (0.0%) | 0 (0.0%) |
| 75 Years and over | 0 (0.0%) | 0 (0.0%) |
Disability Class: Self-Care Difficulty
| Age Bracket | Male | Female |
| 5 to 17 Years | 0 (0.0%) | 0 (0.0%) |
| 18 to 34 Years | 0 (0.0%) | 0 (0.0%) |
| 35 to 64 Years | 0 (0.0%) | 0 (0.0%) |
| 65 to 74 Years | 0 (0.0%) | 0 (0.0%) |
| 75 Years and over | 0 (0.0%) | 0 (0.0%) |
Technology Access in Manton
Computing Device Access in Manton
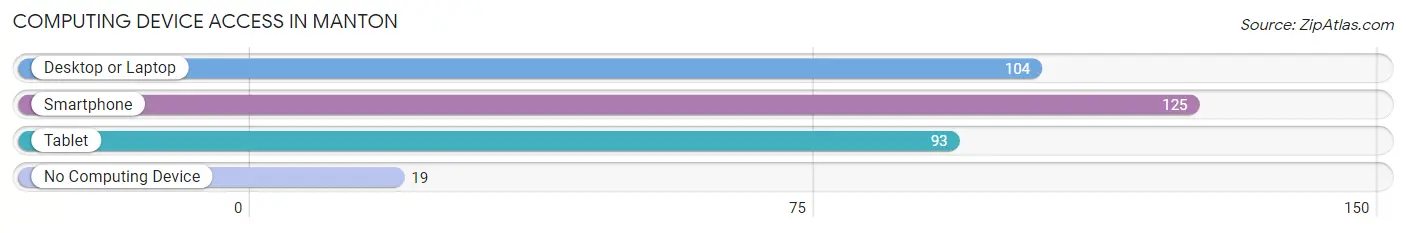
| Device Type | # Households | % Households |
| Desktop or Laptop | 104 | 72.2% |
| Smartphone | 125 | 86.8% |
| Tablet | 93 | 64.6% |
| No Computing Device | 19 | 13.2% |
| Total | 144 | 100.0% |
Internet Access in Manton
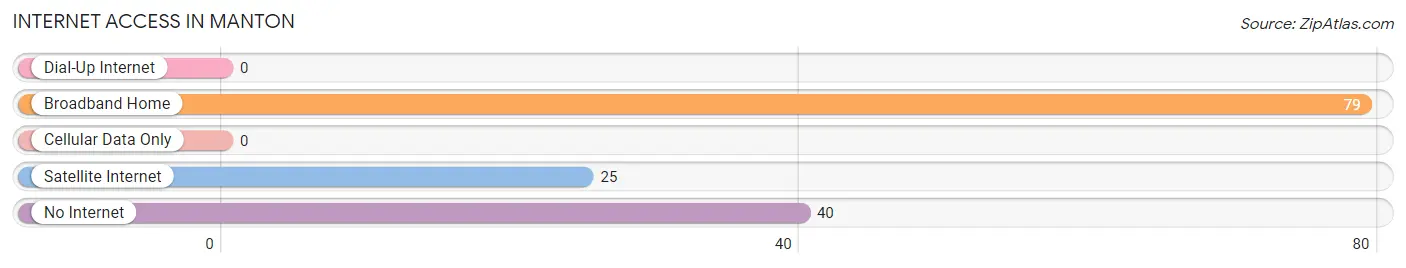
| Internet Type | # Households | % Households |
| Dial-Up Internet | 0 | 0.0% |
| Broadband Home | 79 | 54.9% |
| Cellular Data Only | 0 | 0.0% |
| Satellite Internet | 25 | 17.4% |
| No Internet | 40 | 27.8% |
| Total | 144 | 100.0% |
Manton Summary
Manton is a small unincorporated community located in Tehama County, California. It is situated in the foothills of the Sierra Nevada Mountains, approximately 25 miles northeast of Red Bluff. The population of Manton was estimated to be 1,845 in 2019.
History
Manton was founded in 1856 by a group of settlers from the Midwest. The town was named after Manton, Michigan, the hometown of one of the settlers. The settlers were attracted to the area by the abundance of timber and the potential for gold mining. The first post office was established in 1858.
In the late 1800s, Manton was a bustling town with a population of over 1,000. It had several stores, a hotel, a blacksmith shop, a school, and a church. The town was also home to several saloons and gambling halls.
In the early 1900s, the timber industry began to decline and the gold mining industry began to decline as well. This caused the population of Manton to decrease. By the 1950s, the population had dropped to around 500.
Geography
Manton is located in the foothills of the Sierra Nevada Mountains. The town is situated at an elevation of 1,845 feet above sea level. The climate in Manton is semi-arid, with hot summers and cold winters. The average annual precipitation is around 18 inches.
The town is surrounded by rolling hills and open grasslands. The nearby Manton Valley is home to a variety of wildlife, including deer, coyotes, and wild turkeys.
Economy
The economy of Manton is largely based on agriculture. The town is home to several farms and ranches, which produce a variety of crops, including hay, alfalfa, and wheat. The town is also home to several wineries and vineyards.
The town is also home to several small businesses, including restaurants, stores, and a gas station. The town is also home to a few small manufacturing companies.
Demographics
As of 2019, the population of Manton was estimated to be 1,845. The racial makeup of the town was 94.3% White, 0.7% African American, 0.7% Native American, 0.7% Asian, 0.3% Pacific Islander, and 2.7% from other races. The median household income was $45,000.
Conclusion
Manton is a small unincorporated community located in Tehama County, California. It is situated in the foothills of the Sierra Nevada Mountains, approximately 25 miles northeast of Red Bluff. The population of Manton was estimated to be 1,845 in 2019. The town is largely based on agriculture, with several farms and ranches producing a variety of crops. The town is also home to several small businesses, including restaurants, stores, and a gas station. The racial makeup of the town was 94.3% White, 0.7% African American, 0.7% Native American, 0.7% Asian, 0.3% Pacific Islander, and 2.7% from other races. The median household income was $45,000.
Common Questions
What is Per Capita Income in Manton?
Per Capita income in Manton is $92,824.
What is the Median Family Income in Manton?
Median Family Income in Manton is $128,088.
What is the Median Household income in Manton?
Median Household Income in Manton is $128,125.
What is Inequality or Gini Index in Manton?
Inequality or Gini Index in Manton is 0.48.
What is the Total Population of Manton?
Total Population of Manton is 305.
What is the Total Male Population of Manton?
Total Male Population of Manton is 184.
What is the Total Female Population of Manton?
Total Female Population of Manton is 121.
What is the Ratio of Males per 100 Females in Manton?
There are 152.07 Males per 100 Females in Manton.
What is the Ratio of Females per 100 Males in Manton?
There are 65.76 Females per 100 Males in Manton.
What is the Median Population Age in Manton?
Median Population Age in Manton is 74.0 Years.
What is the Average Family Size in Manton
Average Family Size in Manton is 2.5 People.
What is the Average Household Size in Manton
Average Household Size in Manton is 2.0 People.
How Large is the Labor Force in Manton?
There are 33 People in the Labor Forcein in Manton.
What is the Percentage of People in the Labor Force in Manton?
13.0% of People are in the Labor Force in Manton.