Cities with the Highest Percentage of Population with a Degree in Liberal Arts and History in the United States
RELATED REPORTS & OPTIONS
Liberal Arts and History
United States
Compare Cities
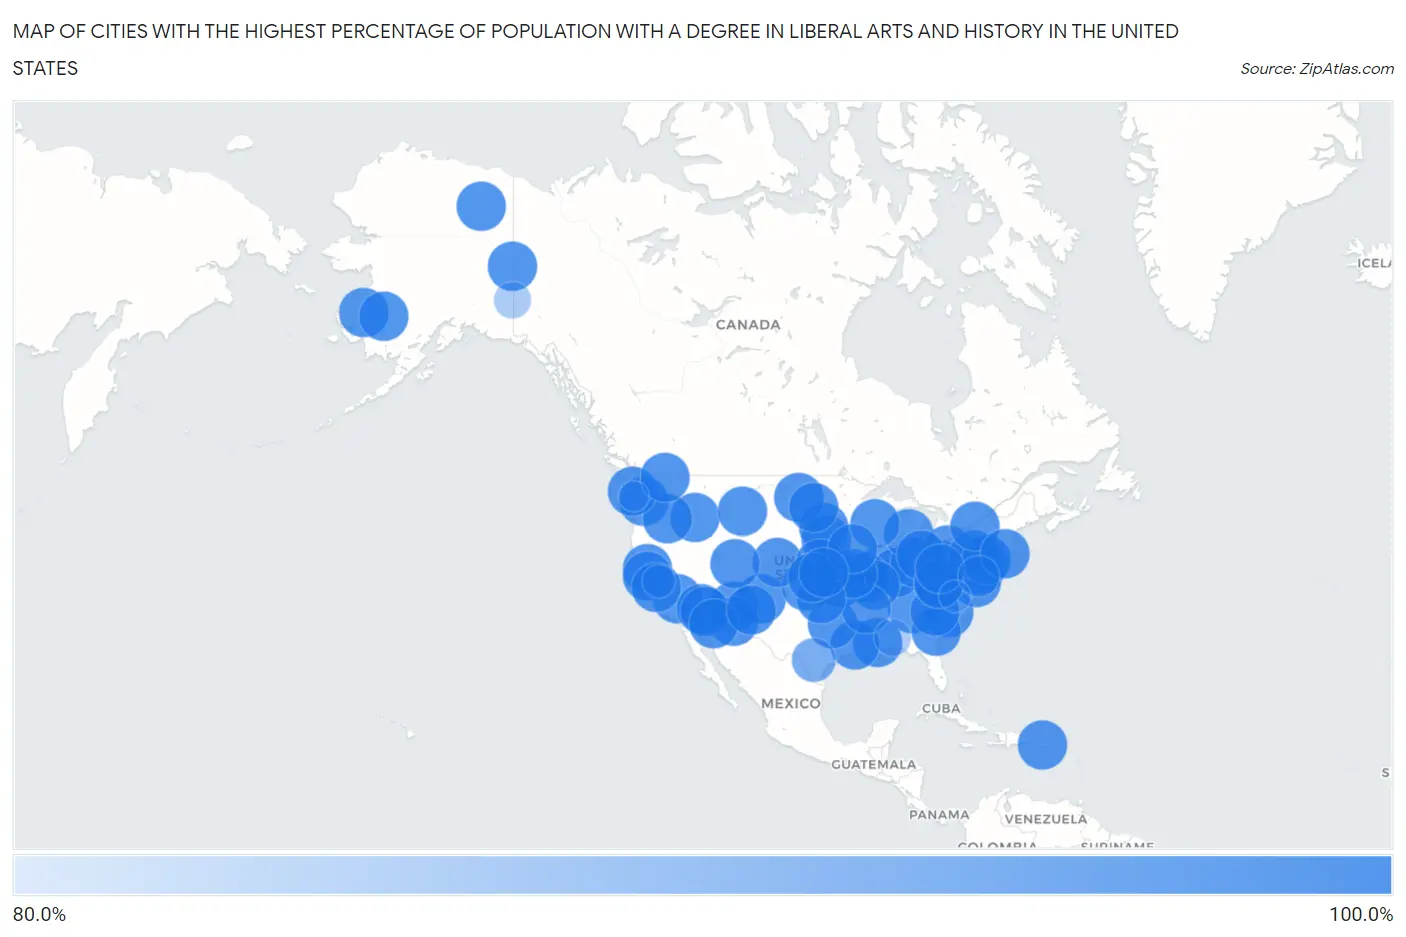
Map of Cities with the Highest Percentage of Population with a Degree in Liberal Arts and History in the United States
0.0%
100.0%
Cities with the Highest Percentage of Population with a Degree in Liberal Arts and History in the United States
| City | % Graduates | vs State | vs National | |
| 1. | East Cleveland | 100.0% | 4.9%(+95.1)#1 | 4.9%(+95.1)#1 |
| 2. | St. John Fisher College | 100.0% | 5.7%(+94.3)#1 | 4.9%(+95.1)#2 |
| 3. | El Rito | 100.0% | 5.5%(+94.5)#1 | 4.9%(+95.1)#3 |
| 4. | Desales University | 100.0% | 4.6%(+95.4)#1 | 4.9%(+95.1)#4 |
| 5. | Arcadia University | 100.0% | 4.6%(+95.4)#2 | 4.9%(+95.1)#5 |
| 6. | Wallace | 100.0% | 5.2%(+94.8)#1 | 4.9%(+95.1)#6 |
| 7. | Crescent | 100.0% | 4.1%(+95.9)#1 | 4.9%(+95.1)#7 |
| 8. | Foxworth | 100.0% | 4.2%(+95.8)#1 | 4.9%(+95.1)#8 |
| 9. | Onalaska | 100.0% | 5.1%(+94.9)#1 | 4.9%(+95.1)#9 |
| 10. | Ontario | 100.0% | 5.8%(+94.2)#1 | 4.9%(+95.1)#10 |
| 11. | South Union | 100.0% | 5.2%(+94.8)#2 | 4.9%(+95.1)#11 |
| 12. | Pitkin | 100.0% | 7.4%(+92.6)#1 | 4.9%(+95.1)#12 |
| 13. | Indian Wells | 100.0% | 4.3%(+95.7)#1 | 4.9%(+95.1)#13 |
| 14. | Hancocks Bridge | 100.0% | 4.6%(+95.4)#1 | 4.9%(+95.1)#14 |
| 15. | Langleyville | 100.0% | 4.7%(+95.3)#1 | 4.9%(+95.1)#15 |
| 16. | Falls View | 100.0% | 4.5%(+95.5)#1 | 4.9%(+95.1)#16 |
| 17. | Yellow Pine | 100.0% | 4.2%(+95.8)#1 | 4.9%(+95.1)#17 |
| 18. | Walesboro | 100.0% | 5.8%(+94.2)#2 | 4.9%(+95.1)#18 |
| 19. | Millersville | 100.0% | 4.6%(+95.4)#1 | 4.9%(+95.1)#19 |
| 20. | Oliver | 100.0% | 4.1%(+95.9)#2 | 4.9%(+95.1)#20 |
| 21. | Coalmont | 100.0% | 5.8%(+94.2)#3 | 4.9%(+95.1)#21 |
| 22. | Rio | 100.0% | 7.4%(+92.6)#2 | 4.9%(+95.1)#22 |
| 23. | Skene | 100.0% | 4.2%(+95.8)#2 | 4.9%(+95.1)#23 |
| 24. | Rossburg | 100.0% | 4.2%(+95.8)#1 | 4.9%(+95.1)#24 |
| 25. | Gasconade | 100.0% | 4.6%(+95.4)#2 | 4.9%(+95.1)#25 |
| 26. | Bailey | 100.0% | 4.2%(+95.8)#1 | 4.9%(+95.1)#26 |
| 27. | Artois | 100.0% | 5.5%(+94.5)#1 | 4.9%(+95.1)#27 |
| 28. | Leoma | 100.0% | 4.9%(+95.1)#2 | 4.9%(+95.1)#28 |
| 29. | Harmon | 100.0% | 3.7%(+96.3)#1 | 4.9%(+95.1)#29 |
| 30. | Greenville | 100.0% | 4.5%(+95.5)#2 | 4.9%(+95.1)#30 |
| 31. | Grantville | 100.0% | 4.6%(+95.4)#1 | 4.9%(+95.1)#31 |
| 32. | Marshall | 100.0% | 5.6%(+94.4)#1 | 4.9%(+95.1)#32 |
| 33. | Dames Quarter | 100.0% | 5.0%(+95.0)#1 | 4.9%(+95.1)#33 |
| 34. | Roberdel | 100.0% | 4.9%(+95.1)#1 | 4.9%(+95.1)#34 |
| 35. | Arctic Village | 100.0% | 5.6%(+94.4)#2 | 4.9%(+95.1)#35 |
| 36. | Guinda | 100.0% | 5.5%(+94.5)#2 | 4.9%(+95.1)#37 |
| 37. | Central Pacolet | 100.0% | 5.2%(+94.8)#3 | 4.9%(+95.1)#38 |
| 38. | Bannock | 100.0% | 4.2%(+95.8)#2 | 4.9%(+95.1)#39 |
| 39. | Fort Apache | 100.0% | 4.3%(+95.7)#2 | 4.9%(+95.1)#40 |
| 40. | Olancha | 100.0% | 5.5%(+94.5)#3 | 4.9%(+95.1)#41 |
| 41. | Morrow | 100.0% | 7.4%(+92.6)#3 | 4.9%(+95.1)#42 |
| 42. | Monument | 100.0% | 6.1%(+93.9)#1 | 4.9%(+95.1)#43 |
| 43. | Katherine | 100.0% | 4.3%(+95.7)#3 | 4.9%(+95.1)#44 |
| 44. | Lazear | 100.0% | 4.6%(+95.4)#1 | 4.9%(+95.1)#45 |
| 45. | Weingarten | 100.0% | 4.6%(+95.4)#3 | 4.9%(+95.1)#46 |
| 46. | Monterey Park Tract | 100.0% | 5.5%(+94.5)#4 | 4.9%(+95.1)#47 |
| 47. | Stendal | 100.0% | 5.8%(+94.2)#4 | 4.9%(+95.1)#48 |
| 48. | Pierson | 100.0% | 4.0%(+96.0)#1 | 4.9%(+95.1)#49 |
| 49. | Glen Ferris | 100.0% | 4.5%(+95.5)#3 | 4.9%(+95.1)#50 |
| 50. | Guys Mills | 100.0% | 4.6%(+95.4)#3 | 4.9%(+95.1)#51 |
| 51. | Queets | 100.0% | 5.1%(+94.9)#2 | 4.9%(+95.1)#52 |
| 52. | Bairdstown | 100.0% | 4.2%(+95.8)#3 | 4.9%(+95.1)#53 |
| 53. | Mill Run | 100.0% | 4.6%(+95.4)#4 | 4.9%(+95.1)#54 |
| 54. | Loomis | 100.0% | 5.1%(+94.9)#3 | 4.9%(+95.1)#55 |
| 55. | Wright | 100.0% | 4.6%(+95.4)#2 | 4.9%(+95.1)#56 |
| 56. | Foundryville | 100.0% | 4.6%(+95.4)#5 | 4.9%(+95.1)#57 |
| 57. | Chuathbaluk | 100.0% | 5.6%(+94.4)#3 | 4.9%(+95.1)#58 |
| 58. | Corral Viejo | 100.0% | 2.3%(+97.7)#1 | 4.9%(+95.1)#59 |
| 59. | Trail Side | 100.0% | 4.6%(+95.4)#2 | 4.9%(+95.1)#60 |
| 60. | Kincaid | 100.0% | 4.6%(+95.4)#3 | 4.9%(+95.1)#61 |
| 61. | Babcock | 100.0% | 4.0%(+96.0)#1 | 4.9%(+95.1)#62 |
| 62. | Georgetown | 100.0% | 4.9%(+95.1)#1 | 4.9%(+95.1)#63 |
| 63. | Zarephath | 100.0% | 4.6%(+95.4)#2 | 4.9%(+95.1)#64 |
| 64. | Eagle Village | 100.0% | 5.6%(+94.4)#4 | 4.9%(+95.1)#65 |
| 65. | Yucca | 100.0% | 4.3%(+95.7)#4 | 4.9%(+95.1)#66 |
| 66. | Beards Fork | 100.0% | 4.5%(+95.5)#4 | 4.9%(+95.1)#67 |
| 67. | Three Mile Bay | 100.0% | 5.7%(+94.3)#2 | 4.9%(+95.1)#68 |
| 68. | Caddo Gap | 100.0% | 4.9%(+95.1)#2 | 4.9%(+95.1)#69 |
| 69. | Randlett | 100.0% | 3.3%(+96.7)#1 | 4.9%(+95.1)#70 |
| 70. | Maskell | 100.0% | 4.0%(+96.0)#1 | 4.9%(+95.1)#71 |
| 71. | Lorenzo | 100.0% | 4.7%(+95.3)#2 | 4.9%(+95.1)#72 |
| 72. | Fishers Island | 100.0% | 5.7%(+94.3)#3 | 4.9%(+95.1)#73 |
| 73. | Mount Leonard | 100.0% | 4.6%(+95.4)#4 | 4.9%(+95.1)#74 |
| 74. | Codell | 100.0% | 4.6%(+95.4)#5 | 4.9%(+95.1)#75 |
| 75. | Furley | 100.0% | 4.6%(+95.4)#6 | 4.9%(+95.1)#76 |
| 76. | Metz | 100.0% | 5.8%(+94.2)#5 | 4.9%(+95.1)#77 |
| 77. | Middle Grove | 100.0% | 4.6%(+95.4)#5 | 4.9%(+95.1)#78 |
| 78. | Antioch | 100.0% | 4.2%(+95.8)#4 | 4.9%(+95.1)#79 |
| 79. | Ojo Caliente | 100.0% | 5.5%(+94.5)#2 | 4.9%(+95.1)#80 |
| 80. | Winfred | 100.0% | 4.1%(+95.9)#1 | 4.9%(+95.1)#81 |
| 81. | Oak | 100.0% | 4.0%(+96.0)#2 | 4.9%(+95.1)#82 |
| 82. | Valeria | 100.0% | 4.5%(+95.5)#1 | 4.9%(+95.1)#83 |
| 83. | Douglas | 100.0% | 4.9%(+95.1)#1 | 4.9%(+95.1)#84 |
| 84. | Leopold | 100.0% | 5.8%(+94.2)#6 | 4.9%(+95.1)#85 |
| 85. | Forbes | 100.0% | 3.7%(+96.3)#2 | 4.9%(+95.1)#87 |
| 86. | Sapphire Ridge | 100.0% | 5.3%(+94.7)#1 | 4.9%(+95.1)#88 |
| 87. | Galatia | 100.0% | 4.6%(+95.4)#7 | 4.9%(+95.1)#89 |
| 88. | Oak Hill | 100.0% | 4.6%(+95.4)#8 | 4.9%(+95.1)#90 |
| 89. | Tonopah | 100.0% | 4.3%(+95.7)#5 | 4.9%(+95.1)#91 |
| 90. | Silesia | 100.0% | 5.3%(+94.7)#2 | 4.9%(+95.1)#92 |
| 91. | San Fidel | 100.0% | 5.5%(+94.5)#3 | 4.9%(+95.1)#93 |
| 92. | Bigfoot | 95.5% | 4.2%(+91.4)#2 | 4.9%(+90.7)#94 |
| 93. | Farmington | 93.4% | 5.5%(+88.0)#1 | 4.9%(+88.6)#95 |
| 94. | Good Pine | 91.0% | 7.4%(+83.6)#4 | 4.9%(+86.2)#96 |
| 95. | Fulton | 90.0% | 4.6%(+85.4)#1 | 4.9%(+85.1)#97 |
| 96. | Alcan Border | 90.0% | 5.6%(+84.4)#5 | 4.9%(+85.1)#98 |
| 97. | Mountain Ranch | 86.8% | 5.5%(+81.3)#5 | 4.9%(+81.9)#99 |
| 98. | Cluster Springs | 86.0% | 5.9%(+80.2)#1 | 4.9%(+81.1)#100 |
| 99. | Embreeville | 85.2% | 4.9%(+80.3)#3 | 4.9%(+80.3)#101 |
| 100. | Ocean City | 84.6% | 5.1%(+79.5)#4 | 4.9%(+79.7)#102 |
Common Questions
What are the Top 10 Cities with the Highest Percentage of Population with a Degree in Liberal Arts and History in the United States?
Top 10 Cities with the Highest Percentage of Population with a Degree in Liberal Arts and History in the United States are:
#1
100.0%
#2
100.0%
#3
100.0%
#4
100.0%
#5
100.0%
#6
100.0%
#7
100.0%
#8
100.0%
#9
100.0%
#10
100.0%
What city has the Highest Percentage of Population with a Degree in Liberal Arts and History in the United States?
East Cleveland has the Highest Percentage of Population with a Degree in Liberal Arts and History in the United States with 100.0%.
What is the Percentage of Population with a Degree in Liberal Arts and History in the United States?
Percentage of Population with a Degree in Liberal Arts and History in the United States is 4.9%.