Squirrel Mountain Valley, CA Map & Demographics
Squirrel Mountain Valley Map
Squirrel Mountain Valley Overview
$40,016
PER CAPITA INCOME
0.43
INEQUALITY / GINI INDEX
1,071
TOTAL POPULATION
566
MALE POPULATION
505
FEMALE POPULATION
112.08
MALES / 100 FEMALES
89.22
FEMALES / 100 MALES
60.4
MEDIAN AGE
2.7
AVG FAMILY SIZE
2.2
AVG HOUSEHOLD SIZE
290
LABOR FORCE [ PEOPLE ]
32.2%
PERCENT IN LABOR FORCE
11.4%
UNEMPLOYMENT RATE
Income in Squirrel Mountain Valley
Income Overview in Squirrel Mountain Valley
| Characteristic | Number | Measure |
| Per Capita Income | 1,071 | $40,016 |
| Median Family Income | 345 | $0 |
| Mean Family Income | 345 | $103,217 |
| Median Household Income | 475 | $0 |
| Mean Household Income | 475 | $89,676 |
| Income Deficit | 345 | $0 |
| Wage / Income Gap (%) | 1,071 | 0.00% |
| Wage / Income Gap ($) | 1,071 | 100.00¢ per $1 |
| Gini / Inequality Index | 1,071 | 0.43 |
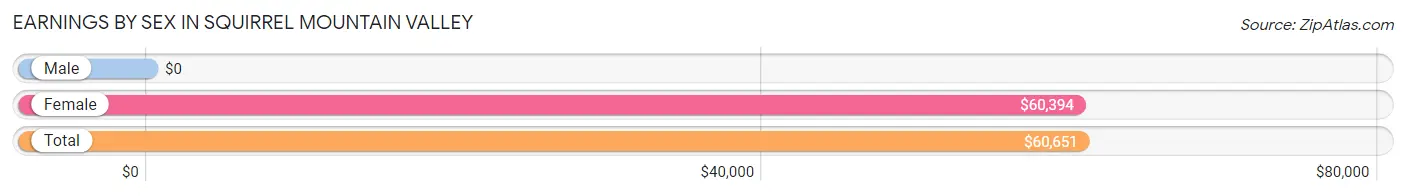
Earnings by Sex in Squirrel Mountain Valley
| Sex | Number | Average Earnings |
| Male | 161 (53.0%) | $0 |
| Female | 143 (47.0%) | $60,394 |
| Total | 304 (100.0%) | $60,651 |
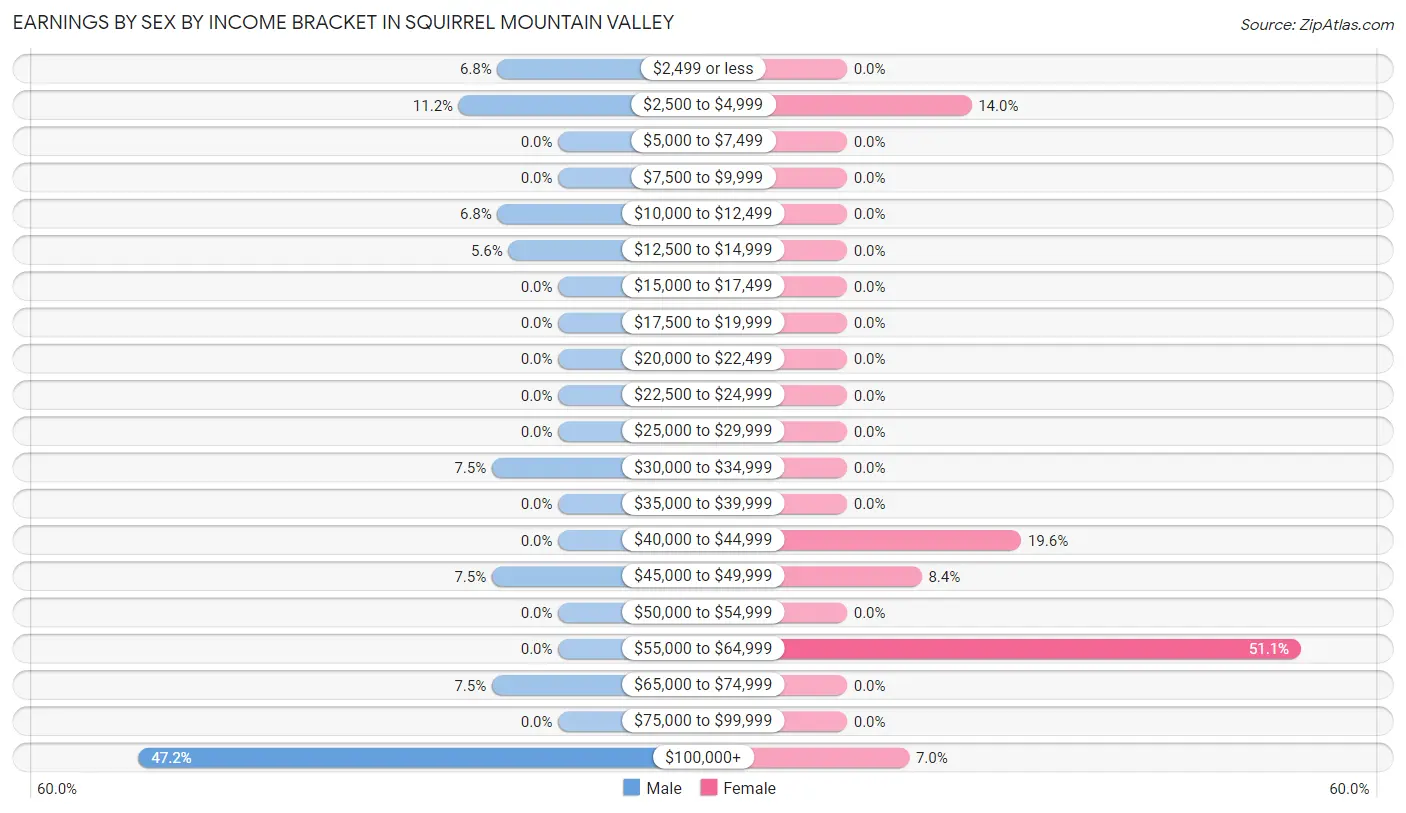
Earnings by Sex by Income Bracket in Squirrel Mountain Valley
The most common earnings brackets in Squirrel Mountain Valley are $100,000+ for men (76 | 47.2%) and $55,000 to $64,999 for women (73 | 51.0%).
| Income | Male | Female |
| $2,499 or less | 11 (6.8%) | 0 (0.0%) |
| $2,500 to $4,999 | 18 (11.2%) | 20 (14.0%) |
| $5,000 to $7,499 | 0 (0.0%) | 0 (0.0%) |
| $7,500 to $9,999 | 0 (0.0%) | 0 (0.0%) |
| $10,000 to $12,499 | 11 (6.8%) | 0 (0.0%) |
| $12,500 to $14,999 | 9 (5.6%) | 0 (0.0%) |
| $15,000 to $17,499 | 0 (0.0%) | 0 (0.0%) |
| $17,500 to $19,999 | 0 (0.0%) | 0 (0.0%) |
| $20,000 to $22,499 | 0 (0.0%) | 0 (0.0%) |
| $22,500 to $24,999 | 0 (0.0%) | 0 (0.0%) |
| $25,000 to $29,999 | 0 (0.0%) | 0 (0.0%) |
| $30,000 to $34,999 | 12 (7.4%) | 0 (0.0%) |
| $35,000 to $39,999 | 0 (0.0%) | 0 (0.0%) |
| $40,000 to $44,999 | 0 (0.0%) | 28 (19.6%) |
| $45,000 to $49,999 | 12 (7.4%) | 12 (8.4%) |
| $50,000 to $54,999 | 0 (0.0%) | 0 (0.0%) |
| $55,000 to $64,999 | 0 (0.0%) | 73 (51.0%) |
| $65,000 to $74,999 | 12 (7.4%) | 0 (0.0%) |
| $75,000 to $99,999 | 0 (0.0%) | 0 (0.0%) |
| $100,000+ | 76 (47.2%) | 10 (7.0%) |
| Total | 161 (100.0%) | 143 (100.0%) |
Earnings by Sex by Educational Attainment in Squirrel Mountain Valley
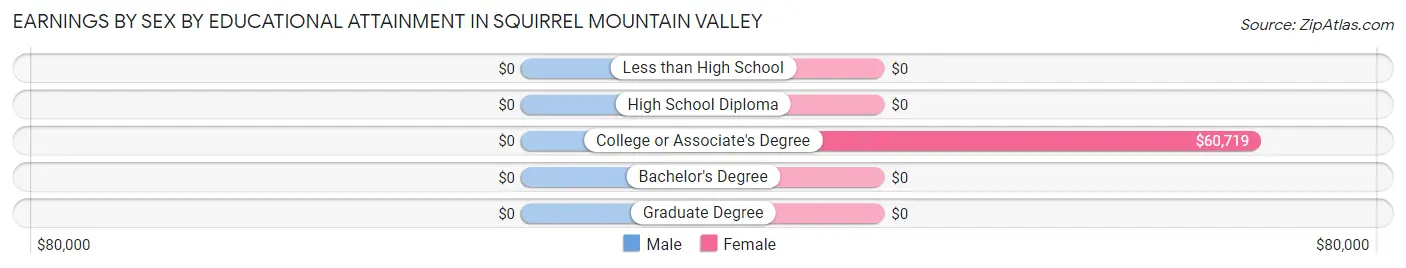
| Educational Attainment | Male Income | Female Income |
| Less than High School | - | - |
| High School Diploma | - | - |
| College or Associate's Degree | - | - |
| Bachelor's Degree | - | - |
| Graduate Degree | - | - |
| Total | - | - |
Family Income in Squirrel Mountain Valley
Family Income Brackets in Squirrel Mountain Valley
According to the Squirrel Mountain Valley family income data, there are 104 families falling into the $25,000 to $34,999 income range, which is the most common income bracket and makes up 30.1% of all families.
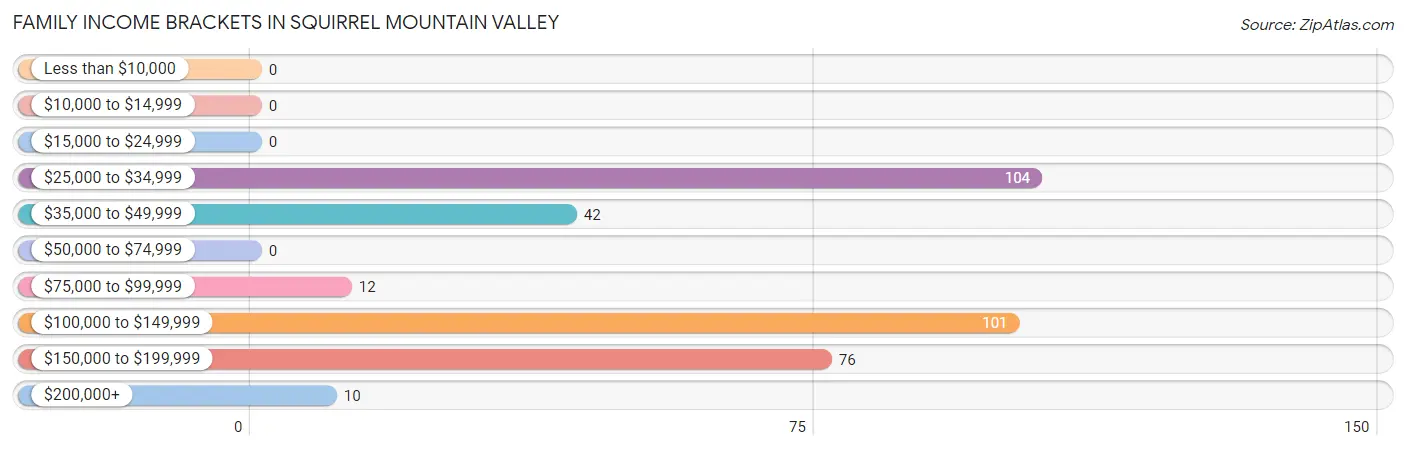
| Income Bracket | # Families | % Families |
| Less than $10,000 | 0 | 0.0% |
| $10,000 to $14,999 | 0 | 0.0% |
| $15,000 to $24,999 | 0 | 0.0% |
| $25,000 to $34,999 | 104 | 30.1% |
| $35,000 to $49,999 | 42 | 12.2% |
| $50,000 to $74,999 | 0 | 0.0% |
| $75,000 to $99,999 | 12 | 3.5% |
| $100,000 to $149,999 | 101 | 29.3% |
| $150,000 to $199,999 | 76 | 22.0% |
| $200,000+ | 10 | 2.9% |
Family Income by Famaliy Size in Squirrel Mountain Valley
4-person families (99 | 28.7%) account for the highest median family income in Squirrel Mountain Valley with $191,201 per family, while 4-person families (99 | 28.7%) have the highest median income of $47,800 per family member.
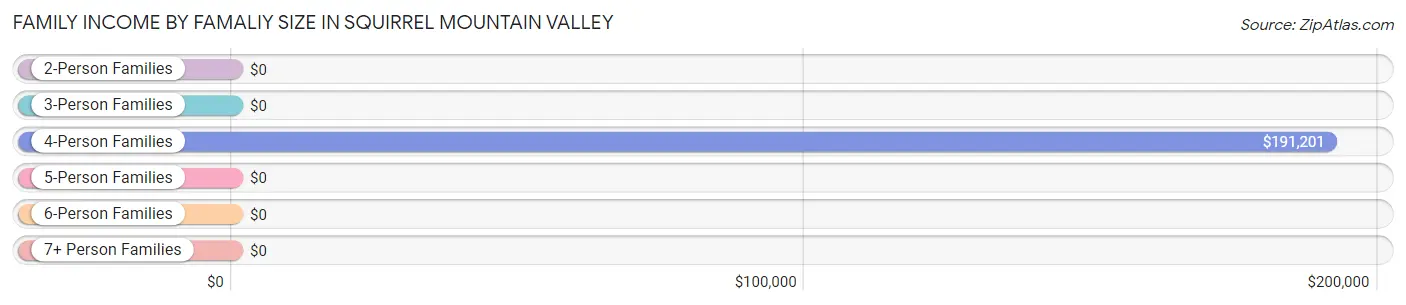
| Income Bracket | # Families | Median Income |
| 2-Person Families | 234 (67.8%) | $0 |
| 3-Person Families | 12 (3.5%) | $0 |
| 4-Person Families | 99 (28.7%) | $191,201 |
| 5-Person Families | 0 (0.0%) | $0 |
| 6-Person Families | 0 (0.0%) | $0 |
| 7+ Person Families | 0 (0.0%) | $0 |
| Total | 345 (100.0%) | $0 |
Family Income by Number of Earners in Squirrel Mountain Valley
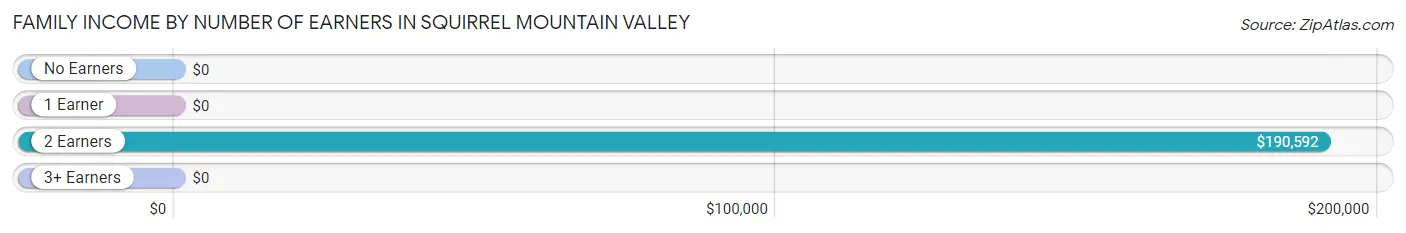
| Number of Earners | # Families | Median Income |
| No Earners | 207 (60.0%) | $0 |
| 1 Earner | 12 (3.5%) | $0 |
| 2 Earners | 116 (33.6%) | $190,592 |
| 3+ Earners | 10 (2.9%) | $0 |
| Total | 345 (100.0%) | $0 |
Household Income in Squirrel Mountain Valley
Household Income Brackets in Squirrel Mountain Valley
With 104 households falling in the category, the $25,000 to $34,999 income range is the most frequent in Squirrel Mountain Valley, accounting for 21.9% of all households.
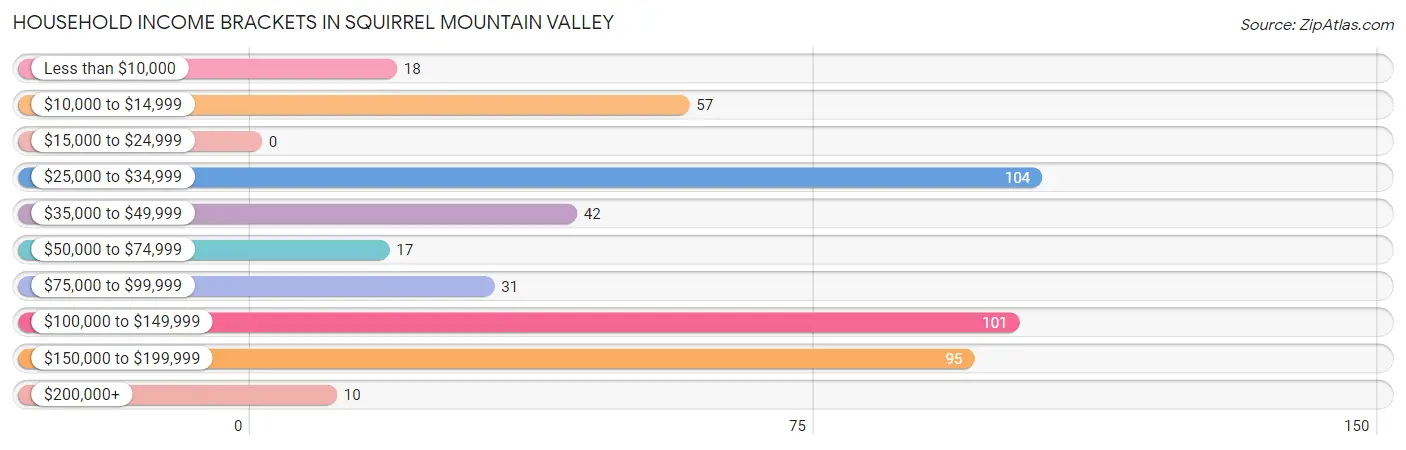
| Income Bracket | # Households | % Households |
| Less than $10,000 | 18 | 3.8% |
| $10,000 to $14,999 | 57 | 12.0% |
| $15,000 to $24,999 | 0 | 0.0% |
| $25,000 to $34,999 | 104 | 21.9% |
| $35,000 to $49,999 | 42 | 8.8% |
| $50,000 to $74,999 | 17 | 3.6% |
| $75,000 to $99,999 | 31 | 6.5% |
| $100,000 to $149,999 | 101 | 21.3% |
| $150,000 to $199,999 | 95 | 20.0% |
| $200,000+ | 10 | 2.1% |
Household Income by Householder Age in Squirrel Mountain Valley
| Income Bracket | # Households | Median Income |
| 15 to 24 Years | 0 (0.0%) | $0 |
| 25 to 44 Years | 85 (17.9%) | $0 |
| 45 to 64 Years | 121 (25.5%) | $0 |
| 65+ Years | 269 (56.6%) | $0 |
| Total | 475 (100.0%) | $0 |
Poverty in Squirrel Mountain Valley
Income Below Poverty by Sex and Age in Squirrel Mountain Valley
With 10.1% poverty level for males and 3.6% for females among the residents of Squirrel Mountain Valley, 45 to 54 year old males and 75 year old and over females are the most vulnerable to poverty, with 57 males (82.6%) and 18 females (56.2%) in their respective age groups living below the poverty level.
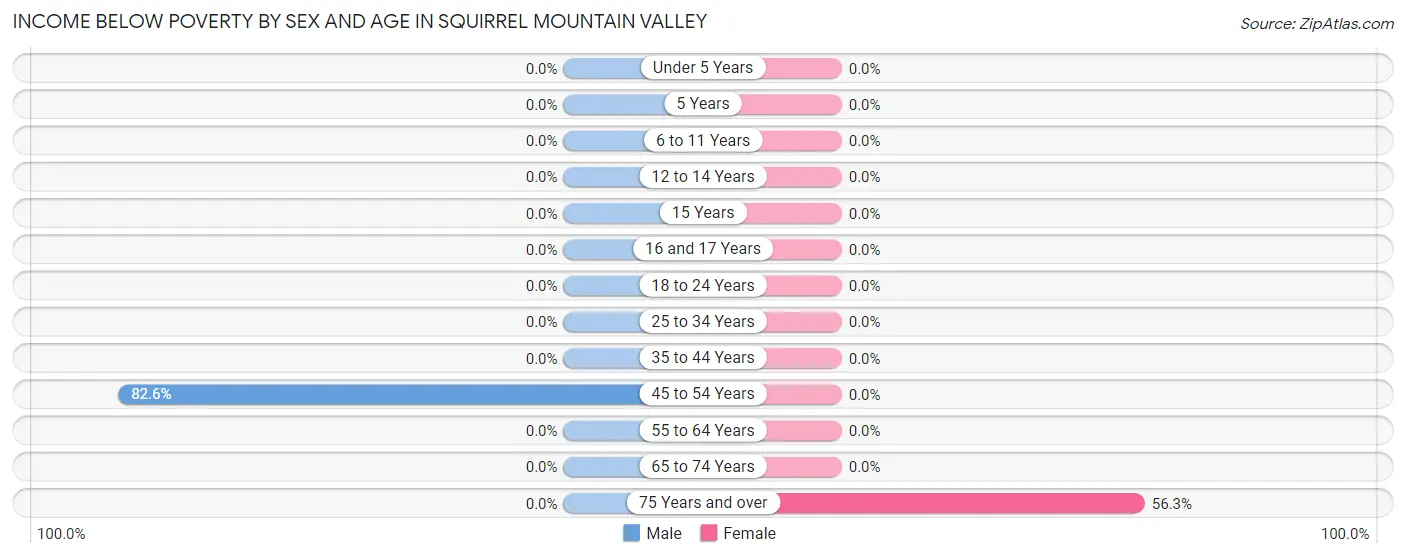
| Age Bracket | Male | Female |
| Under 5 Years | 0 (0.0%) | 0 (0.0%) |
| 5 Years | 0 (0.0%) | 0 (0.0%) |
| 6 to 11 Years | 0 (0.0%) | 0 (0.0%) |
| 12 to 14 Years | 0 (0.0%) | 0 (0.0%) |
| 15 Years | 0 (0.0%) | 0 (0.0%) |
| 16 and 17 Years | 0 (0.0%) | 0 (0.0%) |
| 18 to 24 Years | 0 (0.0%) | 0 (0.0%) |
| 25 to 34 Years | 0 (0.0%) | 0 (0.0%) |
| 35 to 44 Years | 0 (0.0%) | 0 (0.0%) |
| 45 to 54 Years | 57 (82.6%) | 0 (0.0%) |
| 55 to 64 Years | 0 (0.0%) | 0 (0.0%) |
| 65 to 74 Years | 0 (0.0%) | 0 (0.0%) |
| 75 Years and over | 0 (0.0%) | 18 (56.2%) |
| Total | 57 (10.1%) | 18 (3.6%) |
Income Above Poverty by Sex and Age in Squirrel Mountain Valley
According to the poverty statistics in Squirrel Mountain Valley, males aged 6 to 11 years and females aged under 5 years are the age groups that are most secure financially, with 100.0% of males and 100.0% of females in these age groups living above the poverty line.
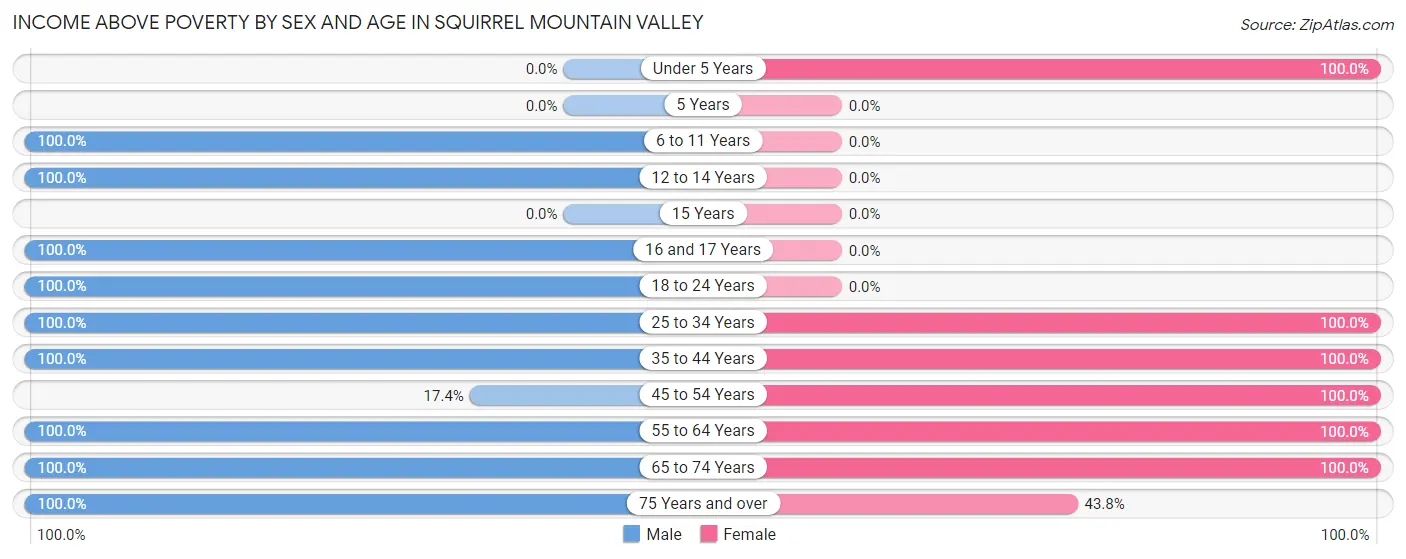
| Age Bracket | Male | Female |
| Under 5 Years | 0 (0.0%) | 80 (100.0%) |
| 5 Years | 0 (0.0%) | 0 (0.0%) |
| 6 to 11 Years | 75 (100.0%) | 0 (0.0%) |
| 12 to 14 Years | 15 (100.0%) | 0 (0.0%) |
| 15 Years | 0 (0.0%) | 0 (0.0%) |
| 16 and 17 Years | 11 (100.0%) | 0 (0.0%) |
| 18 to 24 Years | 11 (100.0%) | 0 (0.0%) |
| 25 to 34 Years | 12 (100.0%) | 20 (100.0%) |
| 35 to 44 Years | 85 (100.0%) | 82 (100.0%) |
| 45 to 54 Years | 12 (17.4%) | 29 (100.0%) |
| 55 to 64 Years | 151 (100.0%) | 120 (100.0%) |
| 65 to 74 Years | 29 (100.0%) | 142 (100.0%) |
| 75 Years and over | 108 (100.0%) | 14 (43.8%) |
| Total | 509 (89.9%) | 487 (96.4%) |
Income Below Poverty Among Married-Couple Families in Squirrel Mountain Valley
| Children | Above Poverty | Below Poverty |
| No Children | 237 (100.0%) | 0 (0.0%) |
| 1 or 2 Children | 99 (100.0%) | 0 (0.0%) |
| 3 or 4 Children | 0 (0.0%) | 0 (0.0%) |
| 5 or more Children | 0 (0.0%) | 0 (0.0%) |
| Total | 336 (100.0%) | 0 (0.0%) |
Income Below Poverty Among Single-Parent Households in Squirrel Mountain Valley
| Children | Single Father | Single Mother |
| No Children | 0 (0.0%) | 0 (0.0%) |
| 1 or 2 Children | 0 (0.0%) | 0 (0.0%) |
| 3 or 4 Children | 0 (0.0%) | 0 (0.0%) |
| 5 or more Children | 0 (0.0%) | 0 (0.0%) |
| Total | 0 (0.0%) | 0 (0.0%) |
Income Below Poverty Among Married-Couple vs Single-Parent Households in Squirrel Mountain Valley
| Children | Married-Couple Families | Single-Parent Households |
| No Children | 0 (0.0%) | 0 (0.0%) |
| 1 or 2 Children | 0 (0.0%) | 0 (0.0%) |
| 3 or 4 Children | 0 (0.0%) | 0 (0.0%) |
| 5 or more Children | 0 (0.0%) | 0 (0.0%) |
| Total | 0 (0.0%) | 0 (0.0%) |
Race in Squirrel Mountain Valley
The most populous races in Squirrel Mountain Valley are White / Caucasian (1,062 | 99.2%), and Black / African American (9 | 0.8%).
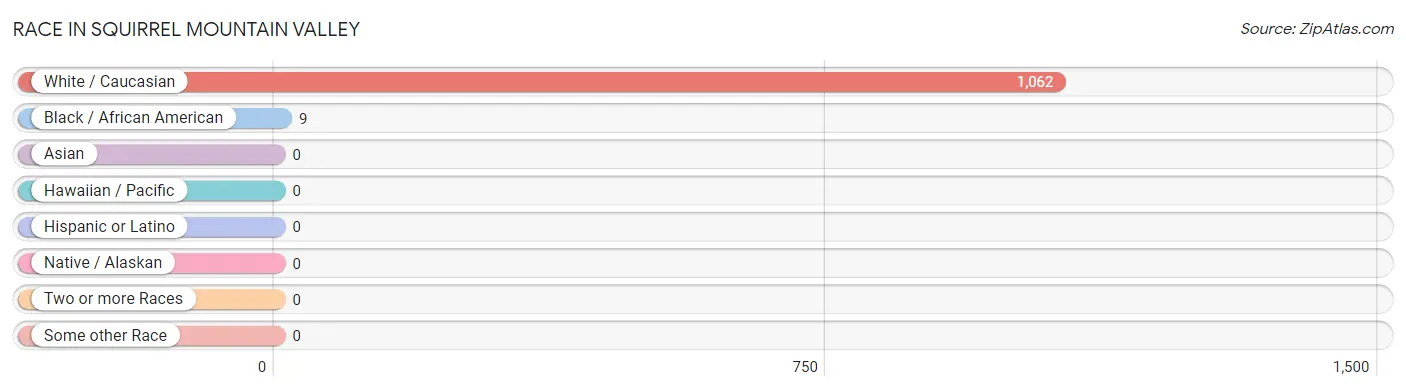
| Race | # Population | % Population |
| Asian | 0 | 0.0% |
| Black / African American | 9 | 0.8% |
| Hawaiian / Pacific | 0 | 0.0% |
| Hispanic or Latino | 0 | 0.0% |
| Native / Alaskan | 0 | 0.0% |
| White / Caucasian | 1,062 | 99.2% |
| Two or more Races | 0 | 0.0% |
| Some other Race | 0 | 0.0% |
| Total | 1,071 | 100.0% |
Ancestry in Squirrel Mountain Valley
The most populous ancestries reported in Squirrel Mountain Valley are American (227 | 21.2%), English (210 | 19.6%), Irish (94 | 8.8%), Greek (57 | 5.3%), and Italian (57 | 5.3%), together accounting for 60.2% of all Squirrel Mountain Valley residents.
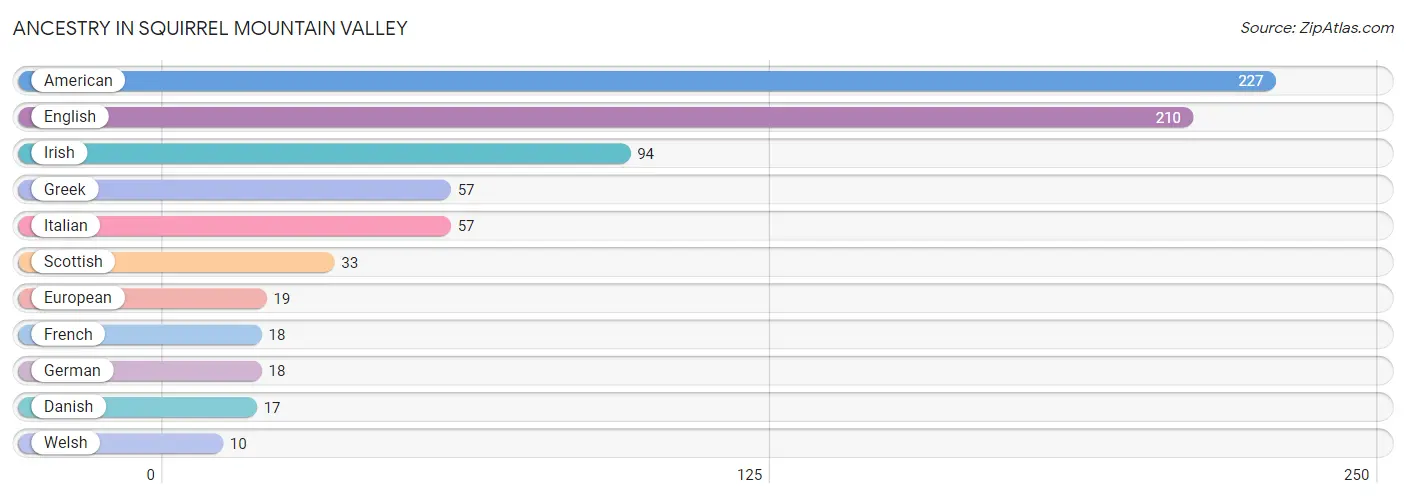
| Ancestry | # Population | % Population |
| American | 227 | 21.2% |
| Danish | 17 | 1.6% |
| English | 210 | 19.6% |
| European | 19 | 1.8% |
| French | 18 | 1.7% |
| German | 18 | 1.7% |
| Greek | 57 | 5.3% |
| Irish | 94 | 8.8% |
| Italian | 57 | 5.3% |
| Scottish | 33 | 3.1% |
| Welsh | 10 | 0.9% | View All 11 Rows |
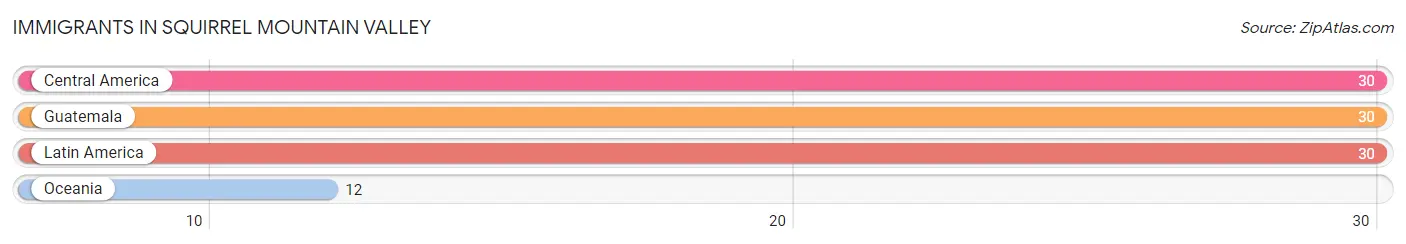
Immigrants in Squirrel Mountain Valley
The most numerous immigrant groups reported in Squirrel Mountain Valley came from Central America (30 | 2.8%), Guatemala (30 | 2.8%), Latin America (30 | 2.8%), and Oceania (12 | 1.1%), together accounting for 9.5% of all Squirrel Mountain Valley residents.
| Immigration Origin | # Population | % Population |
| Central America | 30 | 2.8% |
| Guatemala | 30 | 2.8% |
| Latin America | 30 | 2.8% |
| Oceania | 12 | 1.1% | View All 4 Rows |
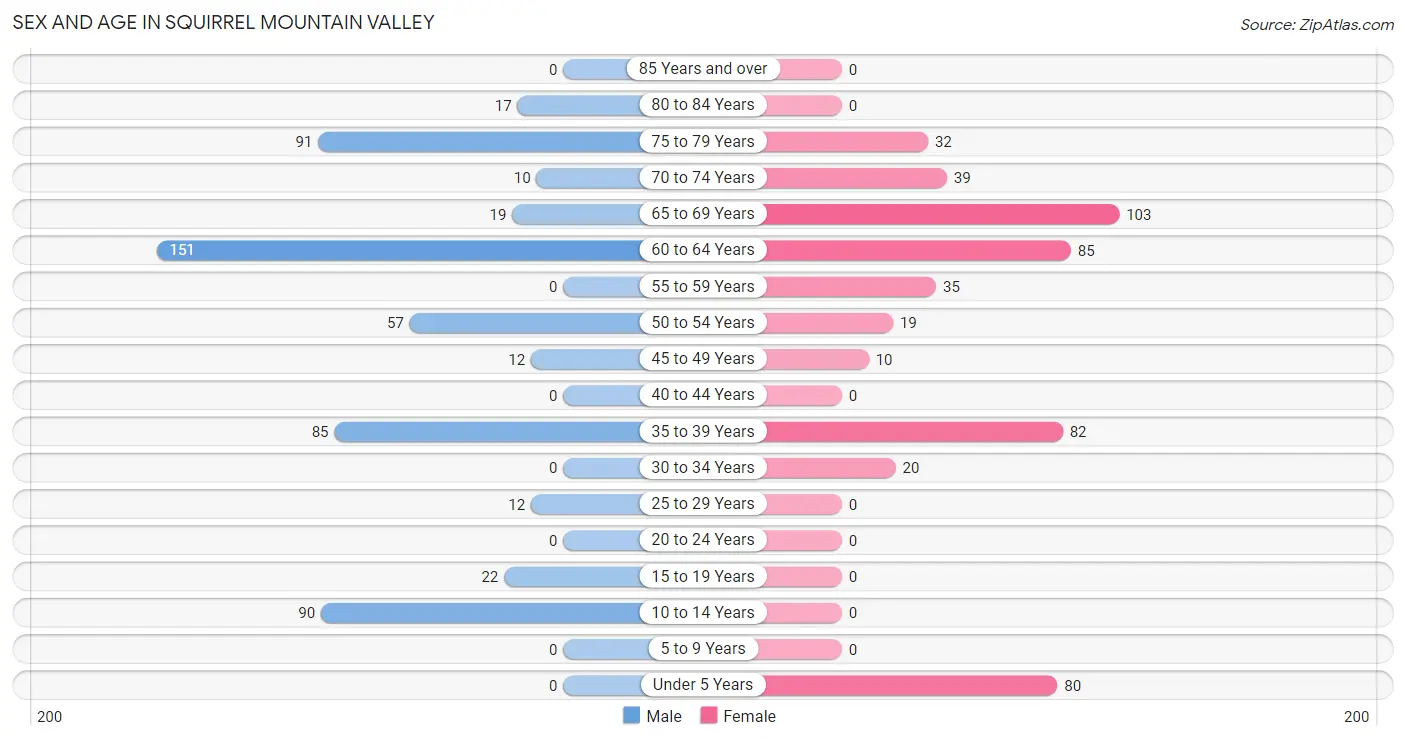
Sex and Age in Squirrel Mountain Valley
Sex and Age in Squirrel Mountain Valley
The most populous age groups in Squirrel Mountain Valley are 60 to 64 Years (151 | 26.7%) for men and 65 to 69 Years (103 | 20.4%) for women.
| Age Bracket | Male | Female |
| Under 5 Years | 0 (0.0%) | 80 (15.8%) |
| 5 to 9 Years | 0 (0.0%) | 0 (0.0%) |
| 10 to 14 Years | 90 (15.9%) | 0 (0.0%) |
| 15 to 19 Years | 22 (3.9%) | 0 (0.0%) |
| 20 to 24 Years | 0 (0.0%) | 0 (0.0%) |
| 25 to 29 Years | 12 (2.1%) | 0 (0.0%) |
| 30 to 34 Years | 0 (0.0%) | 20 (4.0%) |
| 35 to 39 Years | 85 (15.0%) | 82 (16.2%) |
| 40 to 44 Years | 0 (0.0%) | 0 (0.0%) |
| 45 to 49 Years | 12 (2.1%) | 10 (2.0%) |
| 50 to 54 Years | 57 (10.1%) | 19 (3.8%) |
| 55 to 59 Years | 0 (0.0%) | 35 (6.9%) |
| 60 to 64 Years | 151 (26.7%) | 85 (16.8%) |
| 65 to 69 Years | 19 (3.4%) | 103 (20.4%) |
| 70 to 74 Years | 10 (1.8%) | 39 (7.7%) |
| 75 to 79 Years | 91 (16.1%) | 32 (6.3%) |
| 80 to 84 Years | 17 (3.0%) | 0 (0.0%) |
| 85 Years and over | 0 (0.0%) | 0 (0.0%) |
| Total | 566 (100.0%) | 505 (100.0%) |
Families and Households in Squirrel Mountain Valley
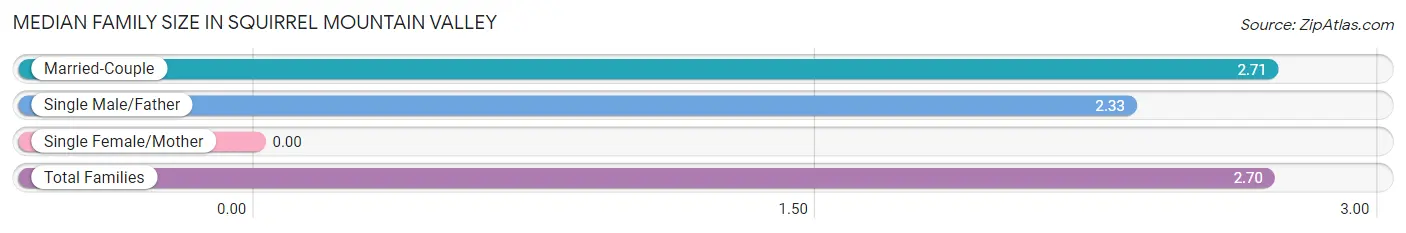
Median Family Size in Squirrel Mountain Valley
| Family Type | # Families | Family Size |
| Married-Couple | 336 (97.4%) | 2.71 |
| Single Male/Father | 9 (2.6%) | 2.33 |
| Single Female/Mother | 0 (0.0%) | - |
| Total Families | 345 (100.0%) | 2.70 |
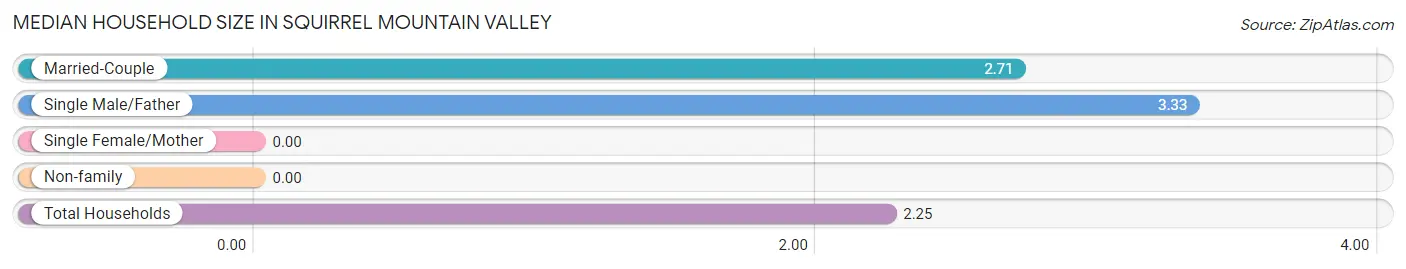
Median Household Size in Squirrel Mountain Valley
| Household Type | # Households | Household Size |
| Married-Couple | 336 (70.7%) | 2.71 |
| Single Male/Father | 9 (1.9%) | 3.33 |
| Single Female/Mother | 0 (0.0%) | - |
| Non-family | 130 (27.4%) | - |
| Total Households | 475 (100.0%) | 2.25 |
Household Size by Marriage Status in Squirrel Mountain Valley
Out of a total of 475 households in Squirrel Mountain Valley, 345 (72.6%) are family households, while 130 (27.4%) are nonfamily households. The most numerous type of family households are 2-person households, comprising 225, and the most common type of nonfamily households are 1-person households, comprising 130.
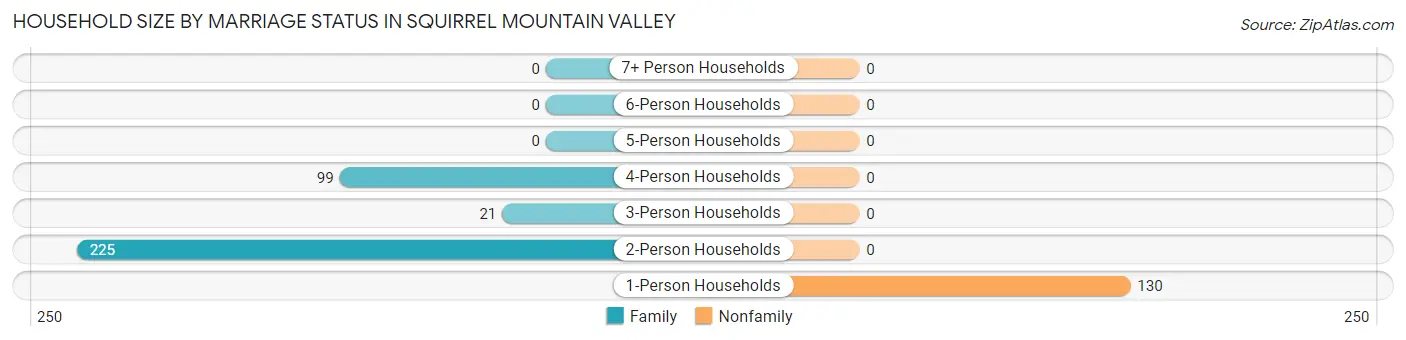
| Household Size | Family Households | Nonfamily Households |
| 1-Person Households | - | 130 (27.4%) |
| 2-Person Households | 225 (47.4%) | 0 (0.0%) |
| 3-Person Households | 21 (4.4%) | 0 (0.0%) |
| 4-Person Households | 99 (20.8%) | 0 (0.0%) |
| 5-Person Households | 0 (0.0%) | 0 (0.0%) |
| 6-Person Households | 0 (0.0%) | 0 (0.0%) |
| 7+ Person Households | 0 (0.0%) | 0 (0.0%) |
| Total | 345 (72.6%) | 130 (27.4%) |
Female Fertility in Squirrel Mountain Valley
Fertility by Age in Squirrel Mountain Valley
| Age Bracket | Women with Births | Births / 1,000 Women |
| 15 to 19 years | 0 (0.0%) | 0.0 |
| 20 to 34 years | 0 (0.0%) | 0.0 |
| 35 to 50 years | 0 (0.0%) | 0.0 |
| Total | 0 (0.0%) | 0.0 |
Fertility by Age by Marriage Status in Squirrel Mountain Valley
| Age Bracket | Married | Unmarried |
| 15 to 19 years | 0 (0.0%) | 0 (0.0%) |
| 20 to 34 years | 0 (0.0%) | 0 (0.0%) |
| 35 to 50 years | 0 (0.0%) | 0 (0.0%) |
| Total | 0 (0.0%) | 0 (0.0%) |
Fertility by Education in Squirrel Mountain Valley
| Educational Attainment | Women with Births | Births / 1,000 Women |
| Less than High School | 0 (0.0%) | 0.0 |
| High School Diploma | 0 (0.0%) | 0.0 |
| College or Associate's Degree | 0 (0.0%) | 0.0 |
| Bachelor's Degree | 0 (0.0%) | 0.0 |
| Graduate Degree | 0 (0.0%) | 0.0 |
| Total | 0 (0.0%) | 0.0 |
Fertility by Education by Marriage Status in Squirrel Mountain Valley
| Educational Attainment | Married | Unmarried |
| Less than High School | 0 (0.0%) | 0 (0.0%) |
| High School Diploma | 0 (0.0%) | 0 (0.0%) |
| College or Associate's Degree | 0 (0.0%) | 0 (0.0%) |
| Bachelor's Degree | 0 (0.0%) | 0 (0.0%) |
| Graduate Degree | 0 (0.0%) | 0 (0.0%) |
| Total | 0 (0.0%) | 0 (0.0%) |
Employment Characteristics in Squirrel Mountain Valley
Employment by Class of Employer in Squirrel Mountain Valley
Among the 257 employed individuals in Squirrel Mountain Valley, private company employees (154 | 59.9%), self-employed (not incorporated) (73 | 28.4%), and local government employees (30 | 11.7%) make up the most common classes of employment.
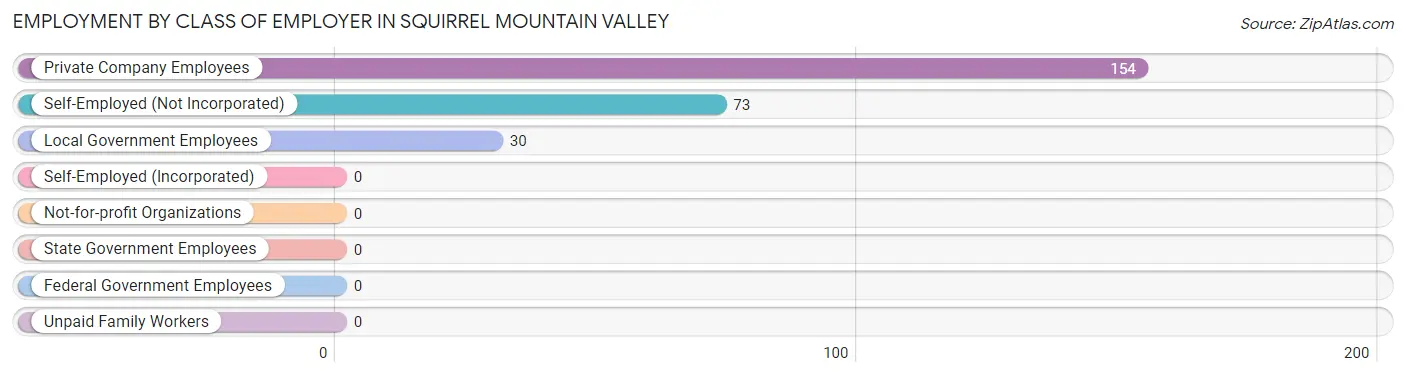
| Employer Class | # Employees | % Employees |
| Private Company Employees | 154 | 59.9% |
| Self-Employed (Incorporated) | 0 | 0.0% |
| Self-Employed (Not Incorporated) | 73 | 28.4% |
| Not-for-profit Organizations | 0 | 0.0% |
| Local Government Employees | 30 | 11.7% |
| State Government Employees | 0 | 0.0% |
| Federal Government Employees | 0 | 0.0% |
| Unpaid Family Workers | 0 | 0.0% |
| Total | 257 | 100.0% |
Employment Status by Age in Squirrel Mountain Valley
According to the labor force statistics for Squirrel Mountain Valley, out of the total population over 16 years of age (901), 32.2% or 290 individuals are in the labor force, with 11.4% or 33 of them unemployed. The age group with the highest labor force participation rate is 16 to 19 years, with 100.0% or 22 individuals in the labor force. Within the labor force, the 30 to 34 years age range has the highest percentage of unemployed individuals, with 100.0% or 20 of them being unemployed.
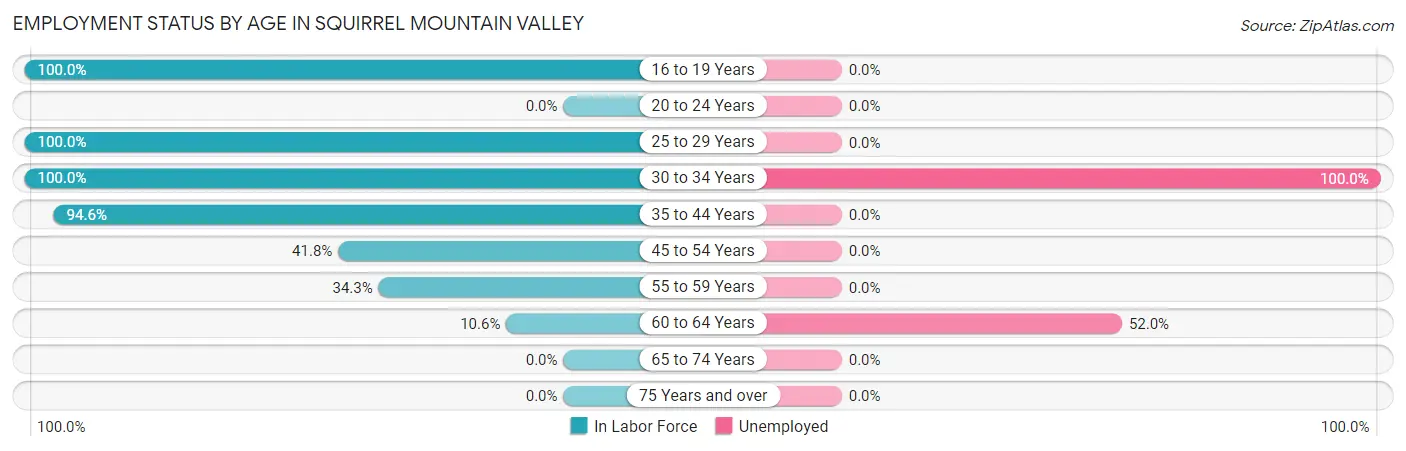
| Age Bracket | In Labor Force | Unemployed |
| 16 to 19 Years | 22 (100.0%) | 0 (0.0%) |
| 20 to 24 Years | 0 (0.0%) | 0 (0.0%) |
| 25 to 29 Years | 12 (100.0%) | 0 (0.0%) |
| 30 to 34 Years | 20 (100.0%) | 20 (100.0%) |
| 35 to 44 Years | 158 (94.6%) | 0 (0.0%) |
| 45 to 54 Years | 41 (41.8%) | 0 (0.0%) |
| 55 to 59 Years | 12 (34.3%) | 0 (0.0%) |
| 60 to 64 Years | 25 (10.6%) | 13 (52.0%) |
| 65 to 74 Years | 0 (0.0%) | 0 (0.0%) |
| 75 Years and over | 0 (0.0%) | 0 (0.0%) |
| Total | 290 (32.2%) | 33 (11.4%) |
Employment Status by Educational Attainment in Squirrel Mountain Valley
According to labor force statistics for Squirrel Mountain Valley, 47.2% of individuals (268) out of the total population between 25 and 64 years of age (568) are in the labor force, with 12.3% or 33 of them being unemployed. The group with the highest labor force participation rate are those with the educational attainment of bachelor's degree or higher, with 87.4% or 76 individuals in the labor force. Within the labor force, individuals with high school diploma education have the highest percentage of unemployment, with 60.0% or 33 of them being unemployed.
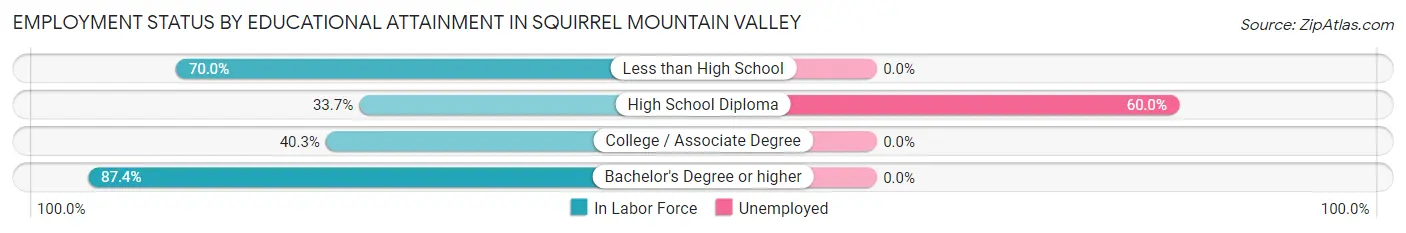
| Educational Attainment | In Labor Force | Unemployed |
| Less than High School | 21 (70.0%) | 0 (0.0%) |
| High School Diploma | 55 (33.7%) | 98 (60.0%) |
| College / Associate Degree | 116 (40.3%) | 0 (0.0%) |
| Bachelor's Degree or higher | 76 (87.4%) | 0 (0.0%) |
| Total | 268 (47.2%) | 70 (12.3%) |
Employment Occupations by Sex in Squirrel Mountain Valley
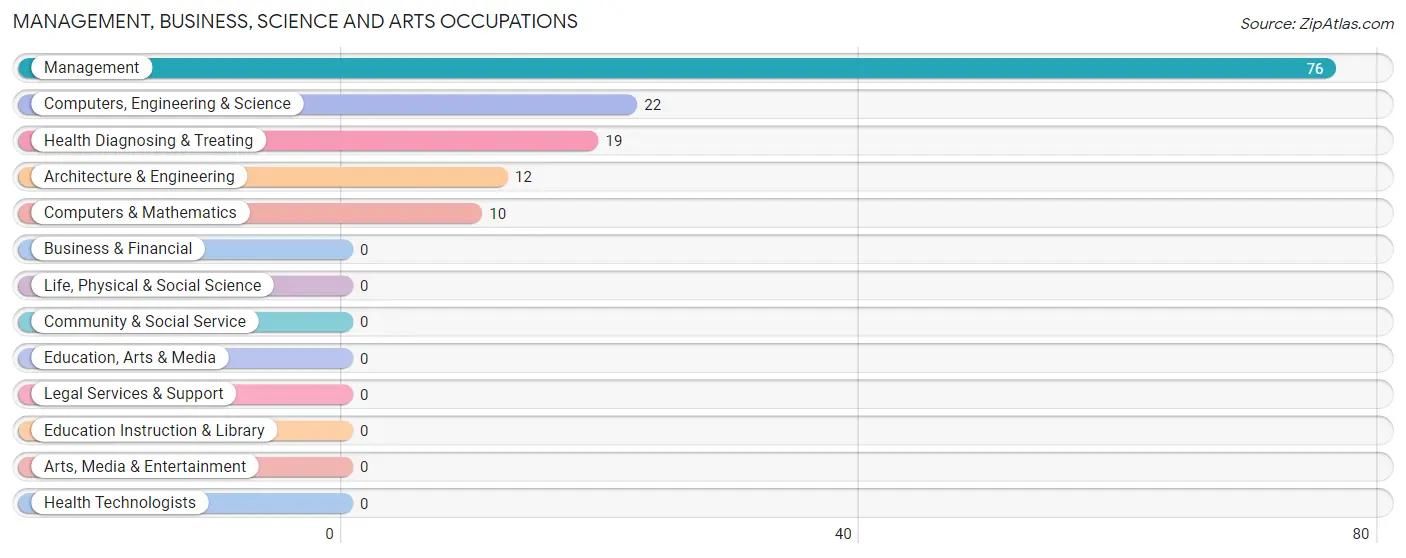
Management, Business, Science and Arts Occupations
The most common Management, Business, Science and Arts occupations in Squirrel Mountain Valley are Management (76 | 29.6%), Computers, Engineering & Science (22 | 8.6%), Health Diagnosing & Treating (19 | 7.4%), Architecture & Engineering (12 | 4.7%), and Computers & Mathematics (10 | 3.9%).
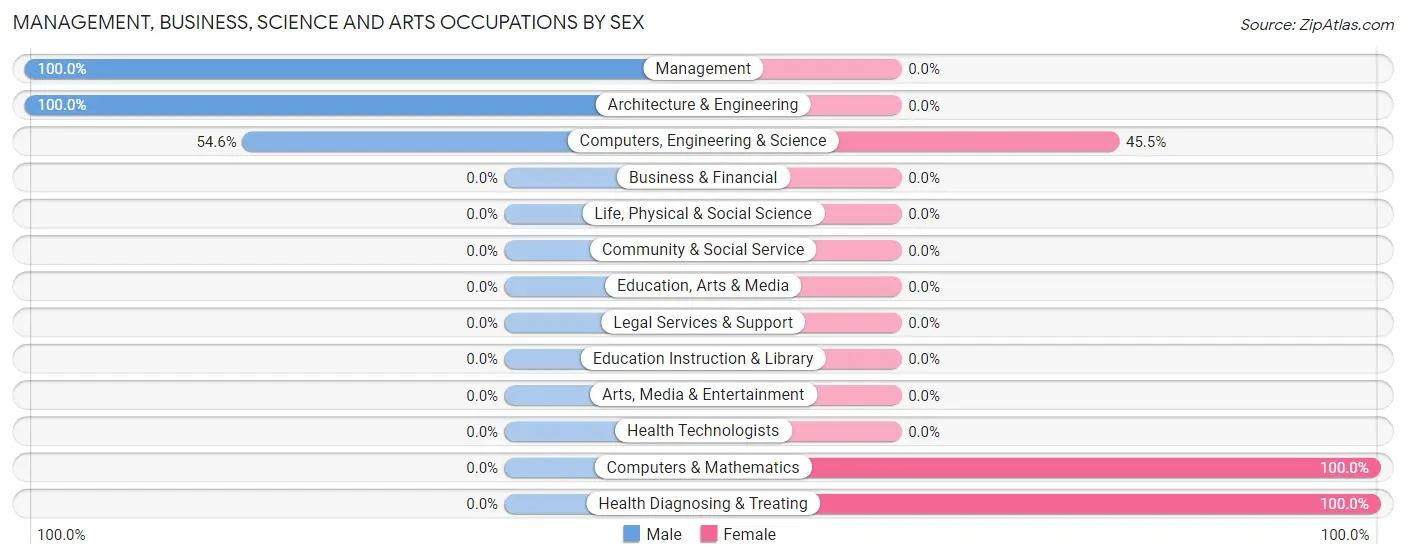
Management, Business, Science and Arts Occupations by Sex
Within the Management, Business, Science and Arts occupations in Squirrel Mountain Valley, the most male-oriented occupations are Management (100.0%), Architecture & Engineering (100.0%), and Computers, Engineering & Science (54.5%), while the most female-oriented occupations are Computers & Mathematics (100.0%), Health Diagnosing & Treating (100.0%), and Computers, Engineering & Science (45.5%).
| Occupation | Male | Female |
| Management | 76 (100.0%) | 0 (0.0%) |
| Business & Financial | 0 (0.0%) | 0 (0.0%) |
| Computers, Engineering & Science | 12 (54.5%) | 10 (45.5%) |
| Computers & Mathematics | 0 (0.0%) | 10 (100.0%) |
| Architecture & Engineering | 12 (100.0%) | 0 (0.0%) |
| Life, Physical & Social Science | 0 (0.0%) | 0 (0.0%) |
| Community & Social Service | 0 (0.0%) | 0 (0.0%) |
| Education, Arts & Media | 0 (0.0%) | 0 (0.0%) |
| Legal Services & Support | 0 (0.0%) | 0 (0.0%) |
| Education Instruction & Library | 0 (0.0%) | 0 (0.0%) |
| Arts, Media & Entertainment | 0 (0.0%) | 0 (0.0%) |
| Health Diagnosing & Treating | 0 (0.0%) | 19 (100.0%) |
| Health Technologists | 0 (0.0%) | 0 (0.0%) |
| Total (Category) | 88 (75.2%) | 29 (24.8%) |
| Total (Overall) | 143 (55.6%) | 114 (44.4%) |
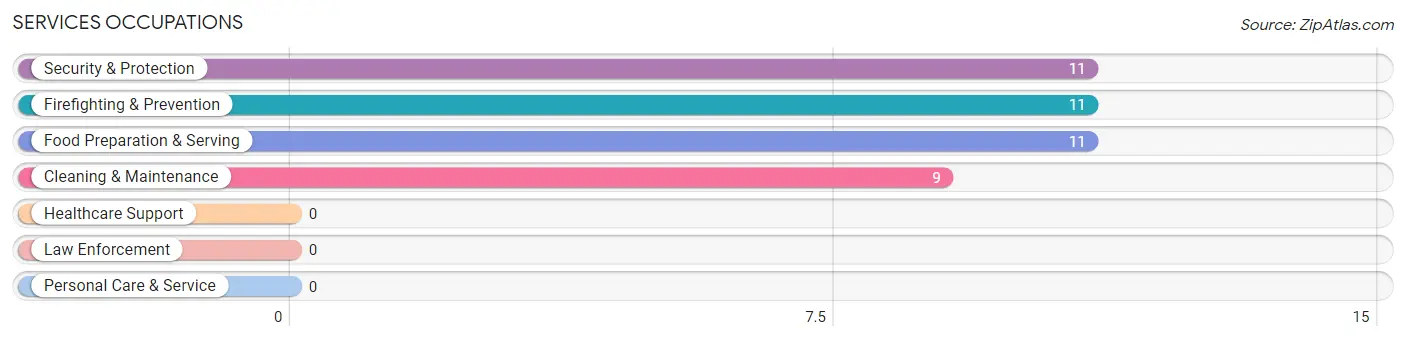
Services Occupations
The most common Services occupations in Squirrel Mountain Valley are Security & Protection (11 | 4.3%), Firefighting & Prevention (11 | 4.3%), Food Preparation & Serving (11 | 4.3%), and Cleaning & Maintenance (9 | 3.5%).
Services Occupations by Sex
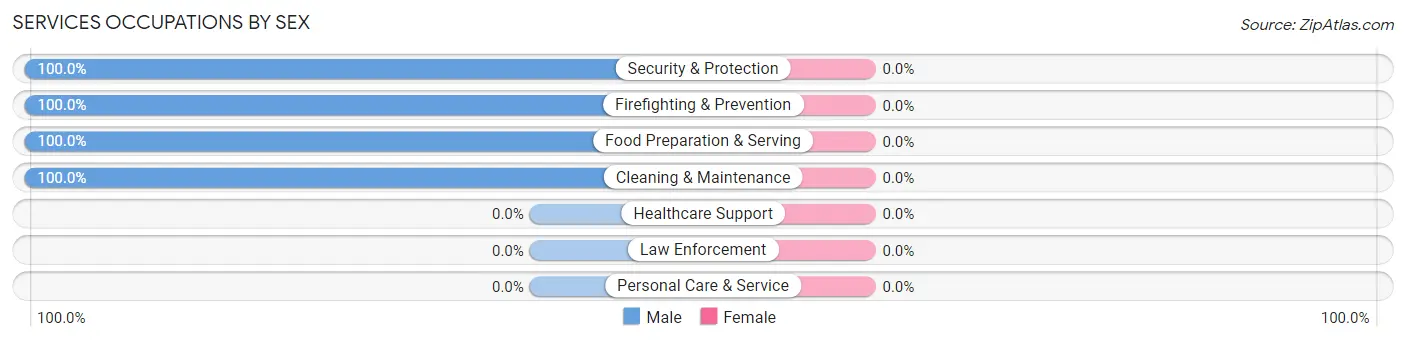
| Occupation | Male | Female |
| Healthcare Support | 0 (0.0%) | 0 (0.0%) |
| Security & Protection | 11 (100.0%) | 0 (0.0%) |
| Firefighting & Prevention | 11 (100.0%) | 0 (0.0%) |
| Law Enforcement | 0 (0.0%) | 0 (0.0%) |
| Food Preparation & Serving | 11 (100.0%) | 0 (0.0%) |
| Cleaning & Maintenance | 9 (100.0%) | 0 (0.0%) |
| Personal Care & Service | 0 (0.0%) | 0 (0.0%) |
| Total (Category) | 31 (100.0%) | 0 (0.0%) |
| Total (Overall) | 143 (55.6%) | 114 (44.4%) |
Sales and Office Occupations
The most common Sales and Office occupations in Squirrel Mountain Valley are Sales & Related (73 | 28.4%), and Office & Administration (24 | 9.3%).
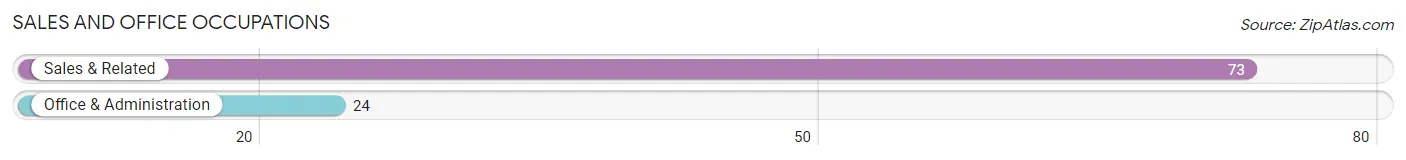
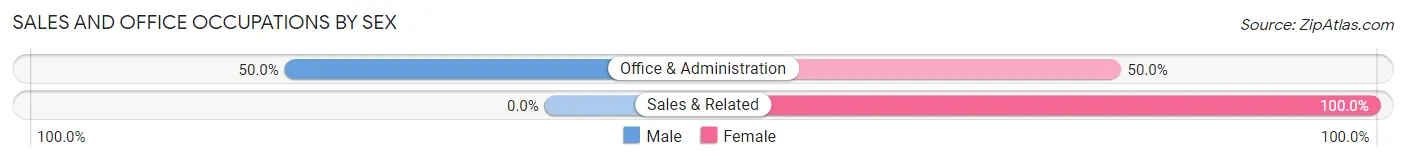
Sales and Office Occupations by Sex
| Occupation | Male | Female |
| Sales & Related | 0 (0.0%) | 73 (100.0%) |
| Office & Administration | 12 (50.0%) | 12 (50.0%) |
| Total (Category) | 12 (12.4%) | 85 (87.6%) |
| Total (Overall) | 143 (55.6%) | 114 (44.4%) |
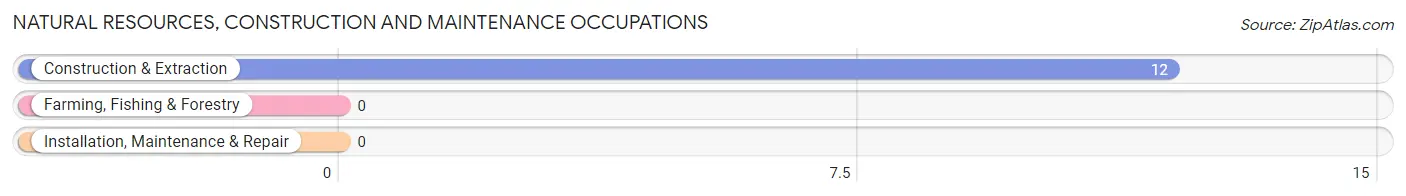
Natural Resources, Construction and Maintenance Occupations
The most common Natural Resources, Construction and Maintenance occupations in Squirrel Mountain Valley are , and Construction & Extraction (12 | 4.7%).
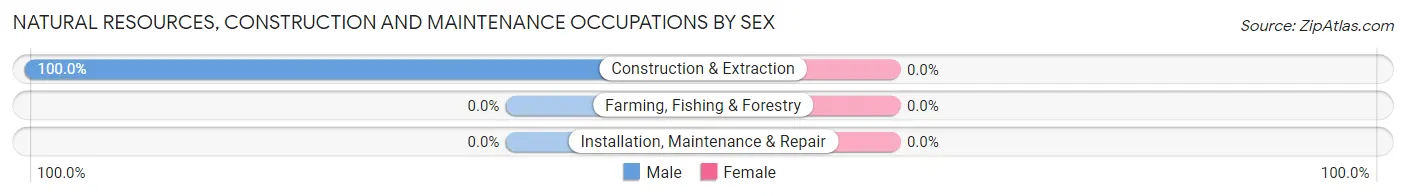
Natural Resources, Construction and Maintenance Occupations by Sex
| Occupation | Male | Female |
| Farming, Fishing & Forestry | 0 (0.0%) | 0 (0.0%) |
| Construction & Extraction | 12 (100.0%) | 0 (0.0%) |
| Installation, Maintenance & Repair | 0 (0.0%) | 0 (0.0%) |
| Total (Category) | 12 (100.0%) | 0 (0.0%) |
| Total (Overall) | 143 (55.6%) | 114 (44.4%) |
Production, Transportation and Moving Occupations
Production, Transportation and Moving Occupations by Sex
| Occupation | Male | Female |
| Production | 0 (0.0%) | 0 (0.0%) |
| Transportation | 0 (0.0%) | 0 (0.0%) |
| Material Moving | 0 (0.0%) | 0 (0.0%) |
| Total (Category) | 0 (0.0%) | 0 (0.0%) |
| Total (Overall) | 143 (55.6%) | 114 (44.4%) |
Employment Industries by Sex in Squirrel Mountain Valley
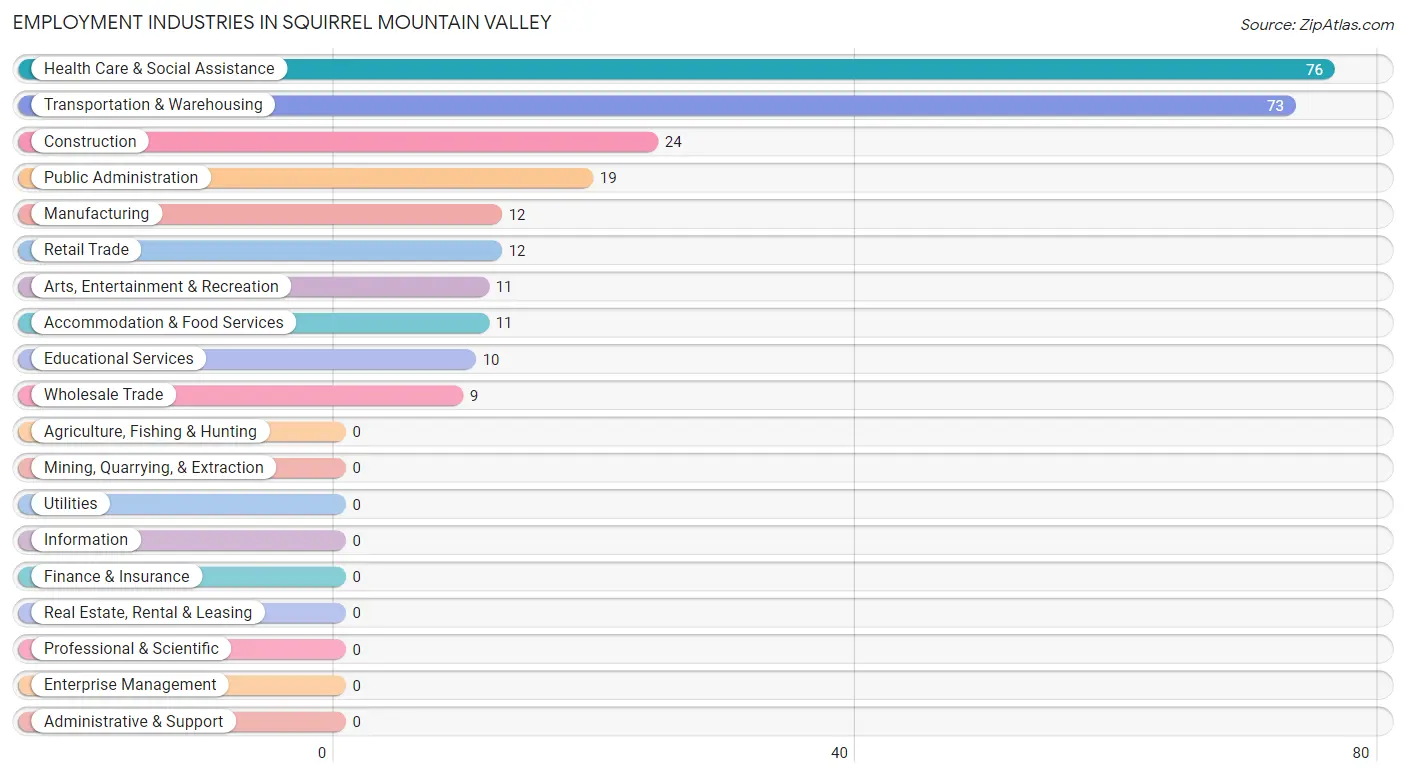
Employment Industries in Squirrel Mountain Valley
The major employment industries in Squirrel Mountain Valley include Health Care & Social Assistance (76 | 29.6%), Transportation & Warehousing (73 | 28.4%), Construction (24 | 9.3%), Public Administration (19 | 7.4%), and Manufacturing (12 | 4.7%).
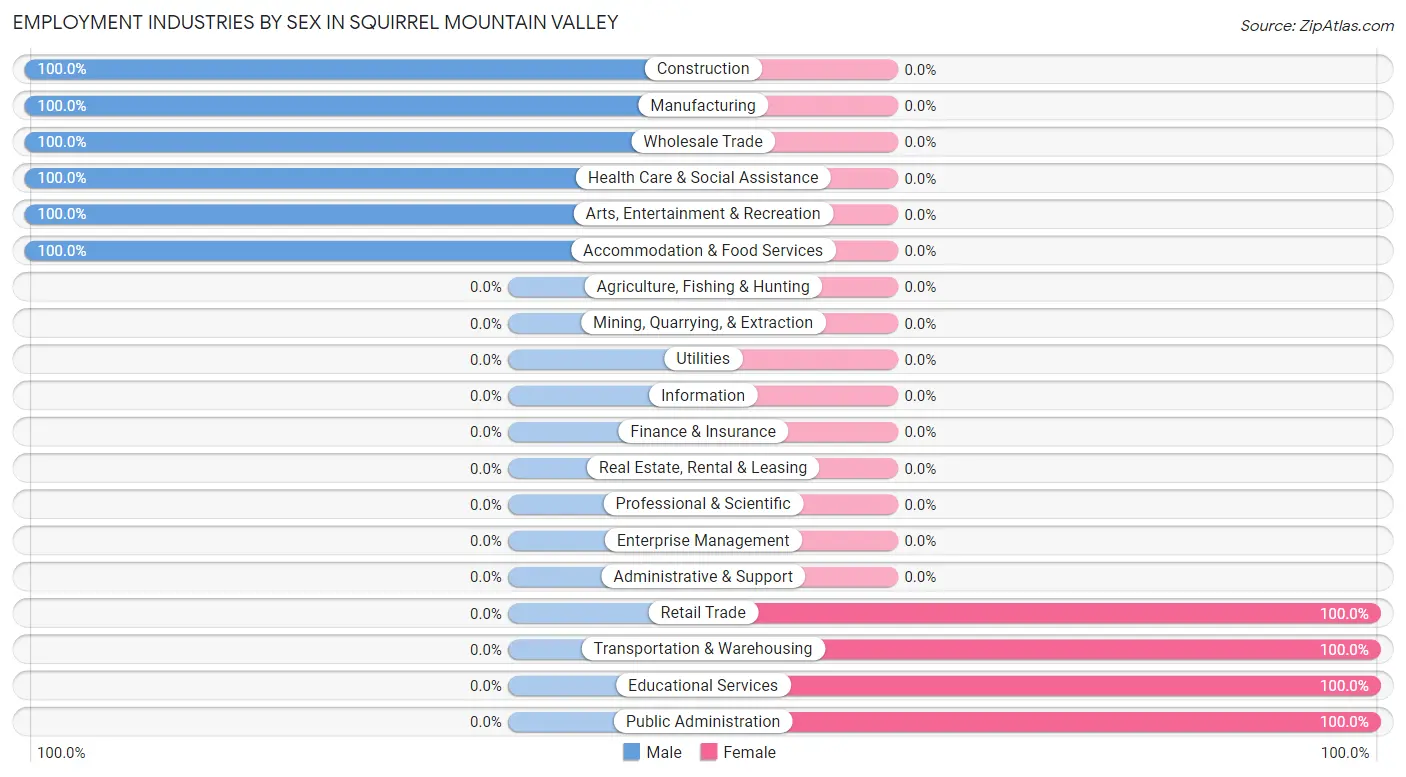
Employment Industries by Sex in Squirrel Mountain Valley
The Squirrel Mountain Valley industries that see more men than women are Construction (100.0%), Manufacturing (100.0%), and Wholesale Trade (100.0%), whereas the industries that tend to have a higher number of women are Retail Trade (100.0%), Transportation & Warehousing (100.0%), and Educational Services (100.0%).
| Industry | Male | Female |
| Agriculture, Fishing & Hunting | 0 (0.0%) | 0 (0.0%) |
| Mining, Quarrying, & Extraction | 0 (0.0%) | 0 (0.0%) |
| Construction | 24 (100.0%) | 0 (0.0%) |
| Manufacturing | 12 (100.0%) | 0 (0.0%) |
| Wholesale Trade | 9 (100.0%) | 0 (0.0%) |
| Retail Trade | 0 (0.0%) | 12 (100.0%) |
| Transportation & Warehousing | 0 (0.0%) | 73 (100.0%) |
| Utilities | 0 (0.0%) | 0 (0.0%) |
| Information | 0 (0.0%) | 0 (0.0%) |
| Finance & Insurance | 0 (0.0%) | 0 (0.0%) |
| Real Estate, Rental & Leasing | 0 (0.0%) | 0 (0.0%) |
| Professional & Scientific | 0 (0.0%) | 0 (0.0%) |
| Enterprise Management | 0 (0.0%) | 0 (0.0%) |
| Administrative & Support | 0 (0.0%) | 0 (0.0%) |
| Educational Services | 0 (0.0%) | 10 (100.0%) |
| Health Care & Social Assistance | 76 (100.0%) | 0 (0.0%) |
| Arts, Entertainment & Recreation | 11 (100.0%) | 0 (0.0%) |
| Accommodation & Food Services | 11 (100.0%) | 0 (0.0%) |
| Public Administration | 0 (0.0%) | 19 (100.0%) |
| Total | 143 (55.6%) | 114 (44.4%) |
Education in Squirrel Mountain Valley
School Enrollment in Squirrel Mountain Valley
The most common levels of schooling among the 177 students in Squirrel Mountain Valley are college / undergraduate (76 | 42.9%), elementary school (75 | 42.4%), and middle school (15 | 8.5%).
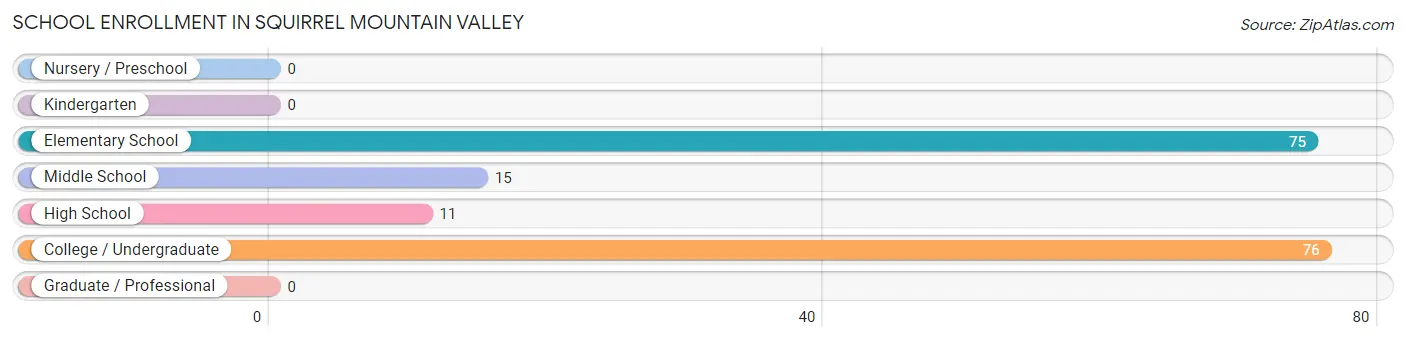
| School Level | # Students | % Students |
| Nursery / Preschool | 0 | 0.0% |
| Kindergarten | 0 | 0.0% |
| Elementary School | 75 | 42.4% |
| Middle School | 15 | 8.5% |
| High School | 11 | 6.2% |
| College / Undergraduate | 76 | 42.9% |
| Graduate / Professional | 0 | 0.0% |
| Total | 177 | 100.0% |
School Enrollment by Age by Funding Source in Squirrel Mountain Valley
Out of a total of 177 students who are enrolled in schools in Squirrel Mountain Valley, 132 (74.6%) attend a private institution, while the remaining 45 (25.4%) are enrolled in public schools. The age group of 10 to 14 year olds has the highest likelihood of being enrolled in private schools, with 75 (83.3% in the age bracket) enrolled. Conversely, the age group of 15 to 17 year olds has the lowest likelihood of being enrolled in a private school, with 11 (100.0% in the age bracket) attending a public institution.
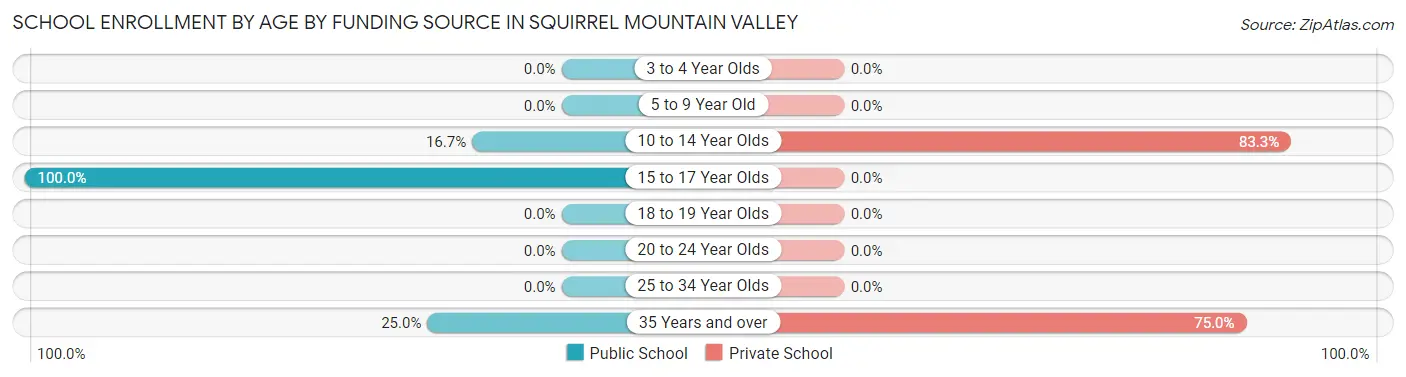
| Age Bracket | Public School | Private School |
| 3 to 4 Year Olds | 0 (0.0%) | 0 (0.0%) |
| 5 to 9 Year Old | 0 (0.0%) | 0 (0.0%) |
| 10 to 14 Year Olds | 15 (16.7%) | 75 (83.3%) |
| 15 to 17 Year Olds | 11 (100.0%) | 0 (0.0%) |
| 18 to 19 Year Olds | 0 (0.0%) | 0 (0.0%) |
| 20 to 24 Year Olds | 0 (0.0%) | 0 (0.0%) |
| 25 to 34 Year Olds | 0 (0.0%) | 0 (0.0%) |
| 35 Years and over | 19 (25.0%) | 57 (75.0%) |
| Total | 45 (25.4%) | 132 (74.6%) |
Educational Attainment by Field of Study in Squirrel Mountain Valley
Liberal arts & history (76 | 66.1%), arts & humanities (19 | 16.5%), education (11 | 9.6%), and social sciences (9 | 7.8%) are the most common fields of study among 115 individuals in Squirrel Mountain Valley who have obtained a bachelor's degree or higher.
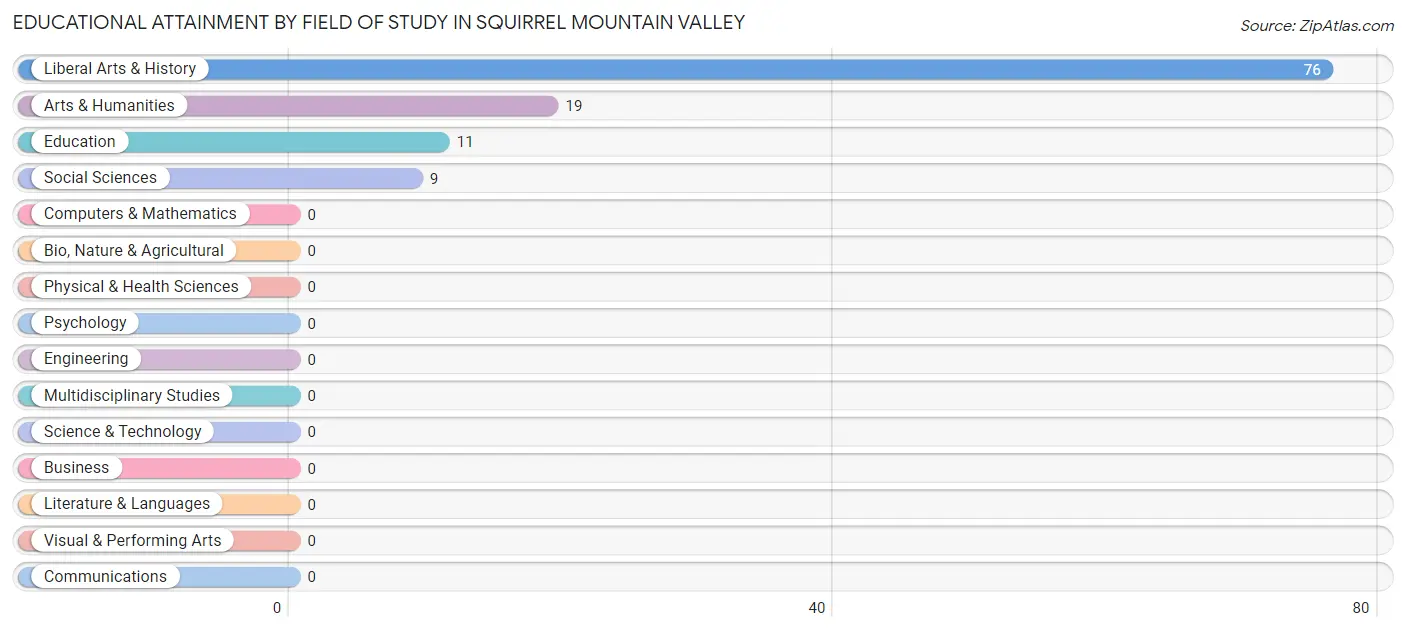
| Field of Study | # Graduates | % Graduates |
| Computers & Mathematics | 0 | 0.0% |
| Bio, Nature & Agricultural | 0 | 0.0% |
| Physical & Health Sciences | 0 | 0.0% |
| Psychology | 0 | 0.0% |
| Social Sciences | 9 | 7.8% |
| Engineering | 0 | 0.0% |
| Multidisciplinary Studies | 0 | 0.0% |
| Science & Technology | 0 | 0.0% |
| Business | 0 | 0.0% |
| Education | 11 | 9.6% |
| Literature & Languages | 0 | 0.0% |
| Liberal Arts & History | 76 | 66.1% |
| Visual & Performing Arts | 0 | 0.0% |
| Communications | 0 | 0.0% |
| Arts & Humanities | 19 | 16.5% |
| Total | 115 | 100.0% |
Transportation & Commute in Squirrel Mountain Valley
Vehicle Availability by Sex in Squirrel Mountain Valley
The most prevalent vehicle ownership categories in Squirrel Mountain Valley are males with no vehicle (76, accounting for 53.1%) and females with no vehicle (73, making up 66.7%).
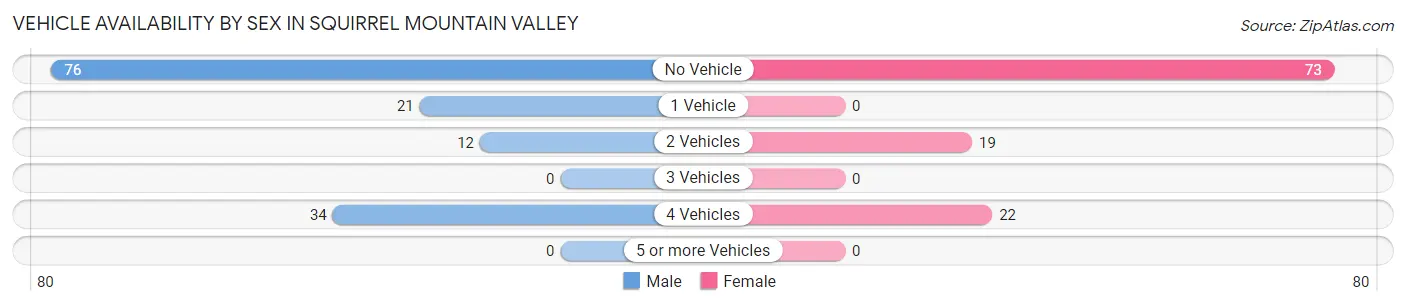
| Vehicles Available | Male | Female |
| No Vehicle | 76 (53.1%) | 73 (64.0%) |
| 1 Vehicle | 21 (14.7%) | 0 (0.0%) |
| 2 Vehicles | 12 (8.4%) | 19 (16.7%) |
| 3 Vehicles | 0 (0.0%) | 0 (0.0%) |
| 4 Vehicles | 34 (23.8%) | 22 (19.3%) |
| 5 or more Vehicles | 0 (0.0%) | 0 (0.0%) |
| Total | 143 (100.0%) | 114 (100.0%) |
Commute Time in Squirrel Mountain Valley
The most frequently occuring commute durations in Squirrel Mountain Valley are 15 to 19 minutes (98 commuters, 38.1%), 10 to 14 minutes (97 commuters, 37.7%), and 5 to 9 minutes (22 commuters, 8.6%).
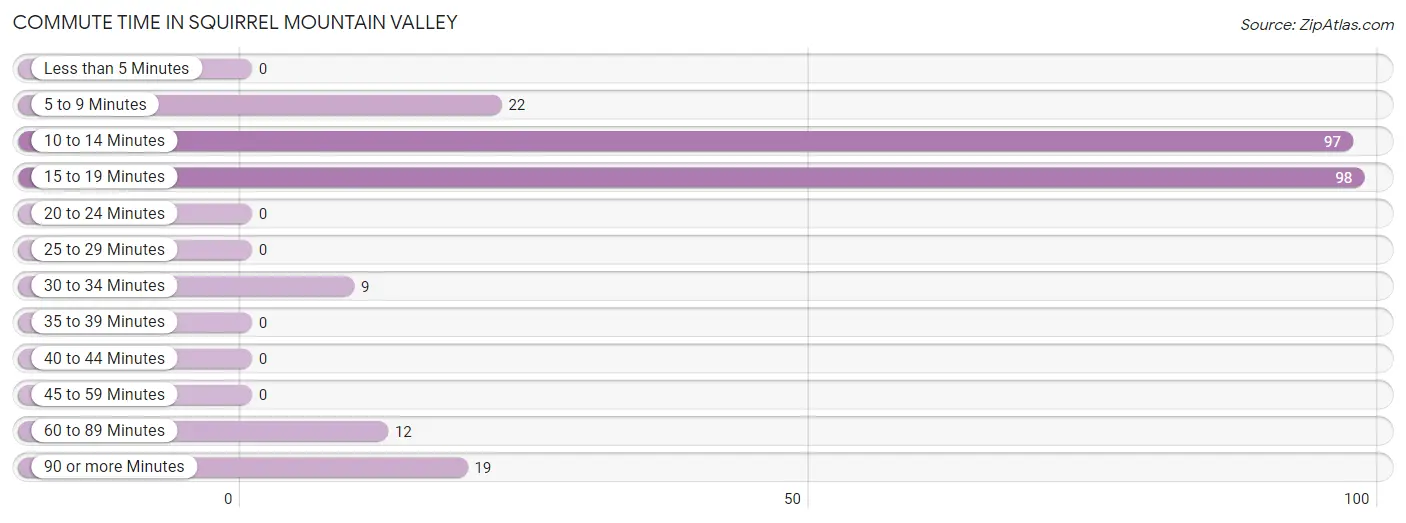
| Commute Time | # Commuters | % Commuters |
| Less than 5 Minutes | 0 | 0.0% |
| 5 to 9 Minutes | 22 | 8.6% |
| 10 to 14 Minutes | 97 | 37.7% |
| 15 to 19 Minutes | 98 | 38.1% |
| 20 to 24 Minutes | 0 | 0.0% |
| 25 to 29 Minutes | 0 | 0.0% |
| 30 to 34 Minutes | 9 | 3.5% |
| 35 to 39 Minutes | 0 | 0.0% |
| 40 to 44 Minutes | 0 | 0.0% |
| 45 to 59 Minutes | 0 | 0.0% |
| 60 to 89 Minutes | 12 | 4.7% |
| 90 or more Minutes | 19 | 7.4% |
Commute Time by Sex in Squirrel Mountain Valley
The most common commute times in Squirrel Mountain Valley are 15 to 19 minutes (88 commuters, 61.5%) for males and 10 to 14 minutes (85 commuters, 74.6%) for females.
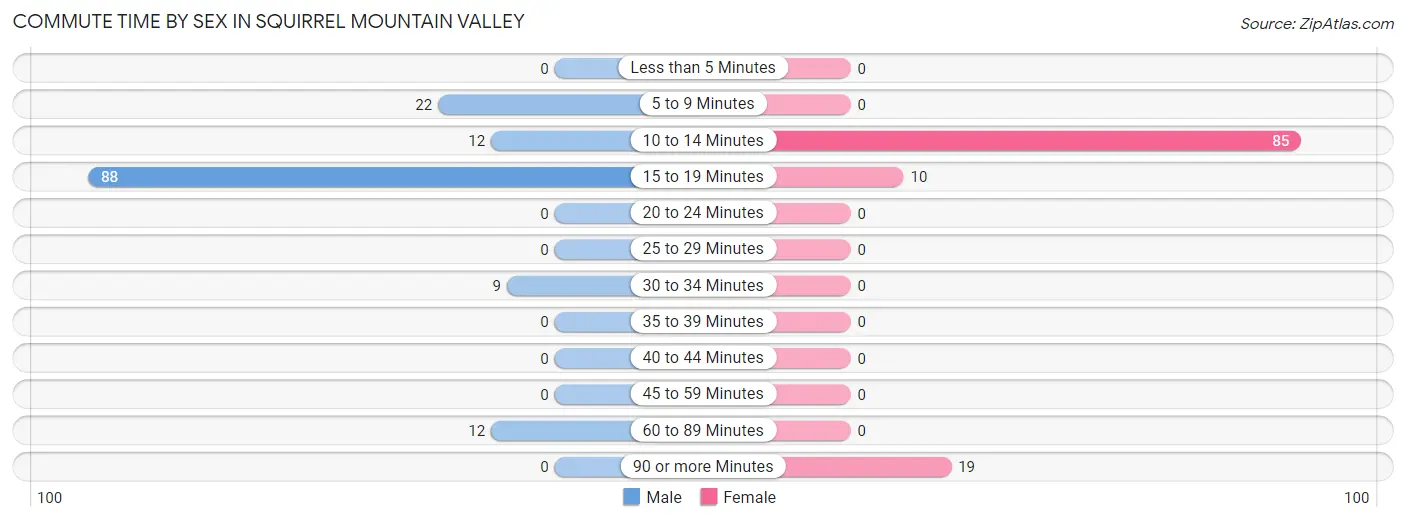
| Commute Time | Male | Female |
| Less than 5 Minutes | 0 (0.0%) | 0 (0.0%) |
| 5 to 9 Minutes | 22 (15.4%) | 0 (0.0%) |
| 10 to 14 Minutes | 12 (8.4%) | 85 (74.6%) |
| 15 to 19 Minutes | 88 (61.5%) | 10 (8.8%) |
| 20 to 24 Minutes | 0 (0.0%) | 0 (0.0%) |
| 25 to 29 Minutes | 0 (0.0%) | 0 (0.0%) |
| 30 to 34 Minutes | 9 (6.3%) | 0 (0.0%) |
| 35 to 39 Minutes | 0 (0.0%) | 0 (0.0%) |
| 40 to 44 Minutes | 0 (0.0%) | 0 (0.0%) |
| 45 to 59 Minutes | 0 (0.0%) | 0 (0.0%) |
| 60 to 89 Minutes | 12 (8.4%) | 0 (0.0%) |
| 90 or more Minutes | 0 (0.0%) | 19 (16.7%) |
Time of Departure to Work by Sex in Squirrel Mountain Valley
The most frequent times of departure to work in Squirrel Mountain Valley are 7:30 AM to 7:59 AM (76, 53.1%) for males and 7:30 AM to 7:59 AM (73, 64.0%) for females.
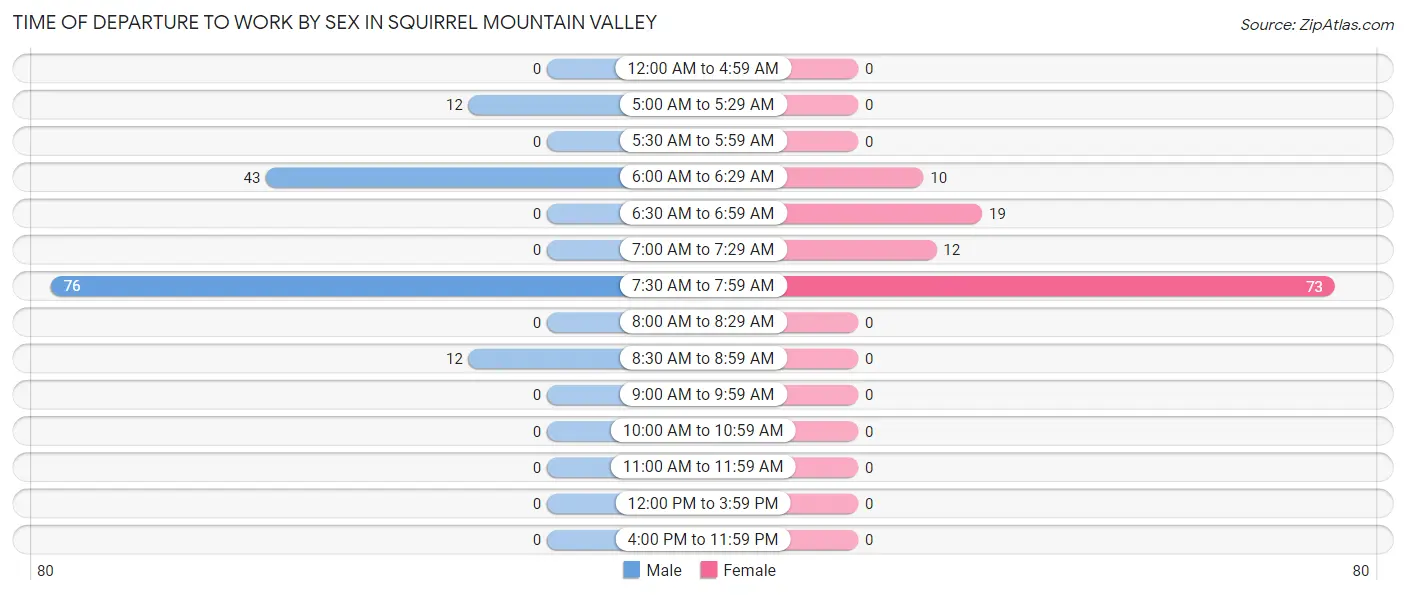
| Time of Departure | Male | Female |
| 12:00 AM to 4:59 AM | 0 (0.0%) | 0 (0.0%) |
| 5:00 AM to 5:29 AM | 12 (8.4%) | 0 (0.0%) |
| 5:30 AM to 5:59 AM | 0 (0.0%) | 0 (0.0%) |
| 6:00 AM to 6:29 AM | 43 (30.1%) | 10 (8.8%) |
| 6:30 AM to 6:59 AM | 0 (0.0%) | 19 (16.7%) |
| 7:00 AM to 7:29 AM | 0 (0.0%) | 12 (10.5%) |
| 7:30 AM to 7:59 AM | 76 (53.1%) | 73 (64.0%) |
| 8:00 AM to 8:29 AM | 0 (0.0%) | 0 (0.0%) |
| 8:30 AM to 8:59 AM | 12 (8.4%) | 0 (0.0%) |
| 9:00 AM to 9:59 AM | 0 (0.0%) | 0 (0.0%) |
| 10:00 AM to 10:59 AM | 0 (0.0%) | 0 (0.0%) |
| 11:00 AM to 11:59 AM | 0 (0.0%) | 0 (0.0%) |
| 12:00 PM to 3:59 PM | 0 (0.0%) | 0 (0.0%) |
| 4:00 PM to 11:59 PM | 0 (0.0%) | 0 (0.0%) |
| Total | 143 (100.0%) | 114 (100.0%) |
Housing Occupancy in Squirrel Mountain Valley
Occupancy by Ownership in Squirrel Mountain Valley
Of the total 475 dwellings in Squirrel Mountain Valley, owner-occupied units account for 409 (86.1%), while renter-occupied units make up 66 (13.9%).
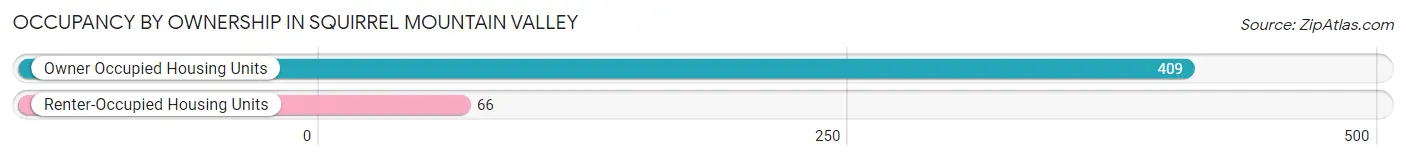
| Occupancy | # Housing Units | % Housing Units |
| Owner Occupied Housing Units | 409 | 86.1% |
| Renter-Occupied Housing Units | 66 | 13.9% |
| Total Occupied Housing Units | 475 | 100.0% |
Occupancy by Household Size in Squirrel Mountain Valley
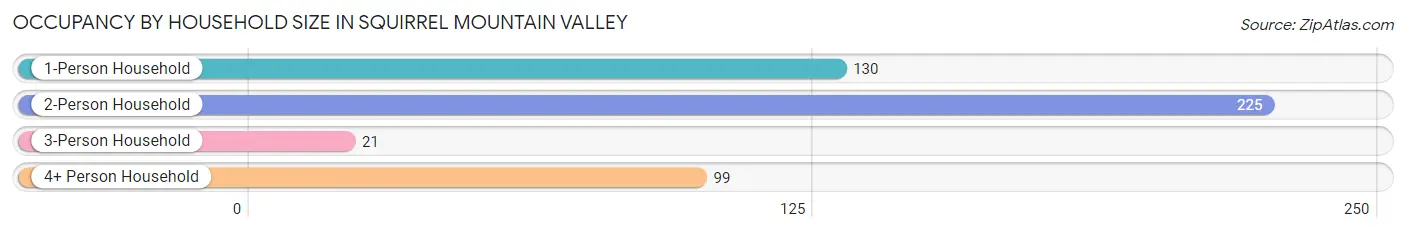
| Household Size | # Housing Units | % Housing Units |
| 1-Person Household | 130 | 27.4% |
| 2-Person Household | 225 | 47.4% |
| 3-Person Household | 21 | 4.4% |
| 4+ Person Household | 99 | 20.8% |
| Total Housing Units | 475 | 100.0% |
Occupancy by Ownership by Household Size in Squirrel Mountain Valley
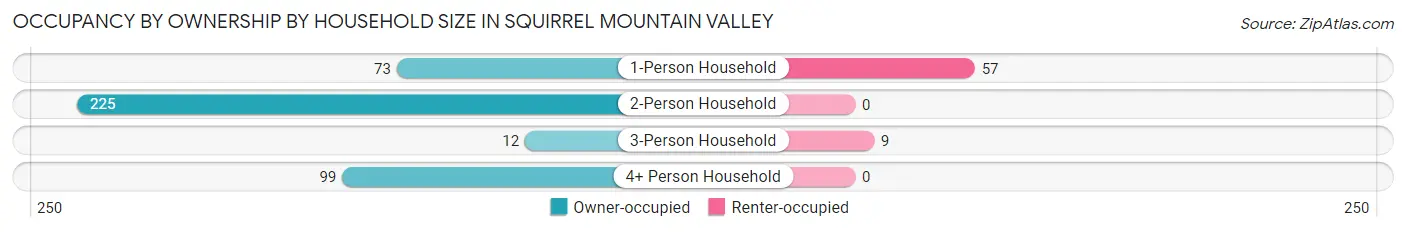
| Household Size | Owner-occupied | Renter-occupied |
| 1-Person Household | 73 (56.1%) | 57 (43.9%) |
| 2-Person Household | 225 (100.0%) | 0 (0.0%) |
| 3-Person Household | 12 (57.1%) | 9 (42.9%) |
| 4+ Person Household | 99 (100.0%) | 0 (0.0%) |
| Total Housing Units | 409 (86.1%) | 66 (13.9%) |
Occupancy by Educational Attainment in Squirrel Mountain Valley
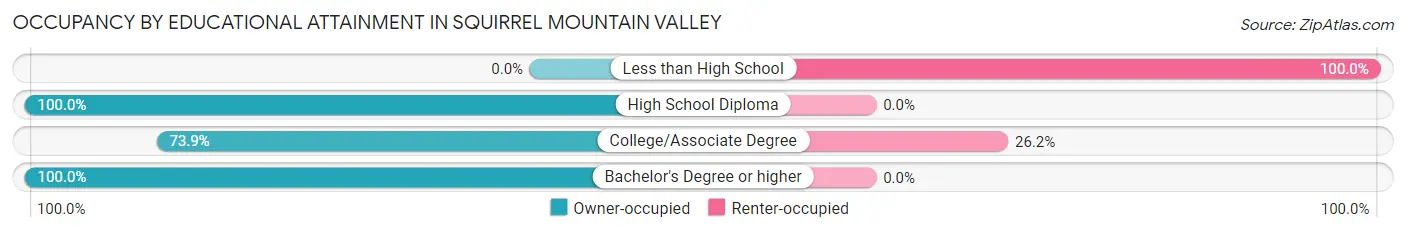
| Household Size | Owner-occupied | Renter-occupied |
| Less than High School | 0 (0.0%) | 9 (100.0%) |
| High School Diploma | 133 (100.0%) | 0 (0.0%) |
| College/Associate Degree | 161 (73.9%) | 57 (26.2%) |
| Bachelor's Degree or higher | 115 (100.0%) | 0 (0.0%) |
Occupancy by Age of Householder in Squirrel Mountain Valley
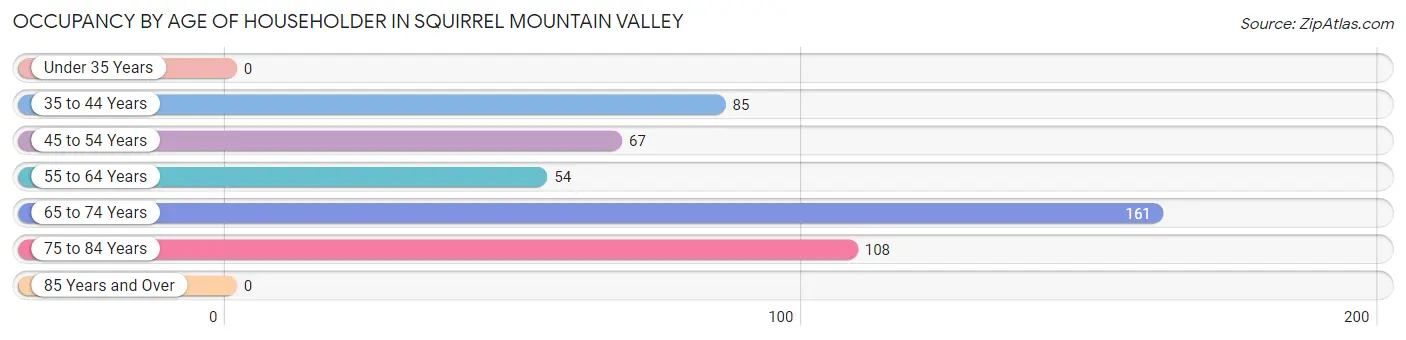
| Age Bracket | # Households | % Households |
| Under 35 Years | 0 | 0.0% |
| 35 to 44 Years | 85 | 17.9% |
| 45 to 54 Years | 67 | 14.1% |
| 55 to 64 Years | 54 | 11.4% |
| 65 to 74 Years | 161 | 33.9% |
| 75 to 84 Years | 108 | 22.7% |
| 85 Years and Over | 0 | 0.0% |
| Total | 475 | 100.0% |
Housing Finances in Squirrel Mountain Valley
Median Income by Occupancy in Squirrel Mountain Valley
| Occupancy Type | # Households | Median Income |
| Owner-Occupied | 409 (86.1%) | $0 |
| Renter-Occupied | 66 (13.9%) | $0 |
| Average | 475 (100.0%) | $0 |
Occupancy by Householder Income Bracket in Squirrel Mountain Valley
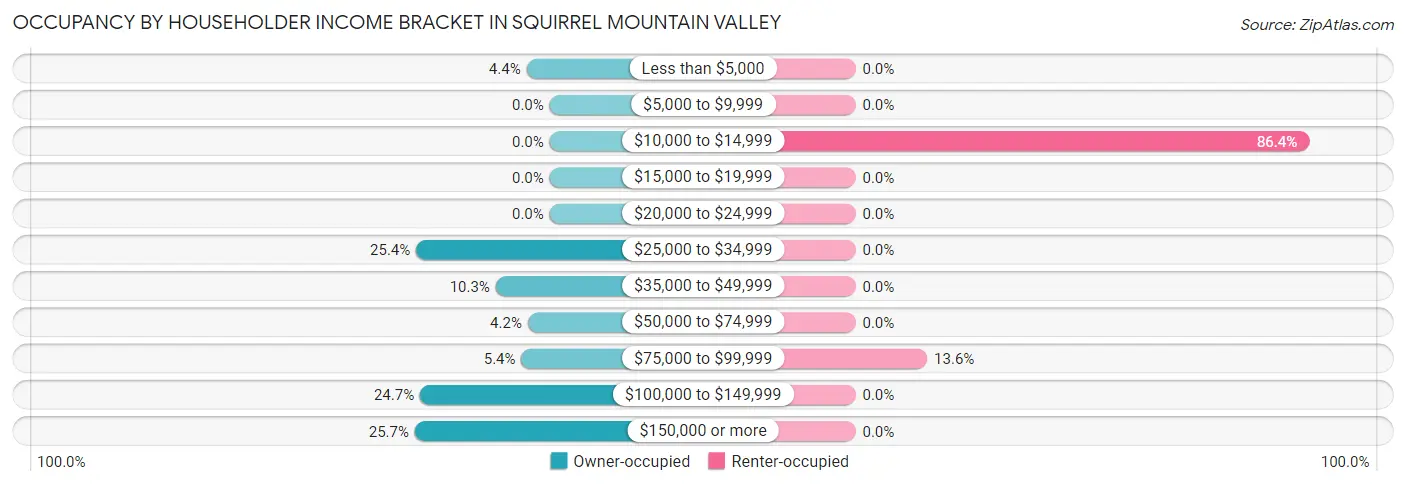
| Income Bracket | Owner-occupied | Renter-occupied |
| Less than $5,000 | 18 (4.4%) | 0 (0.0%) |
| $5,000 to $9,999 | 0 (0.0%) | 0 (0.0%) |
| $10,000 to $14,999 | 0 (0.0%) | 57 (86.4%) |
| $15,000 to $19,999 | 0 (0.0%) | 0 (0.0%) |
| $20,000 to $24,999 | 0 (0.0%) | 0 (0.0%) |
| $25,000 to $34,999 | 104 (25.4%) | 0 (0.0%) |
| $35,000 to $49,999 | 42 (10.3%) | 0 (0.0%) |
| $50,000 to $74,999 | 17 (4.2%) | 0 (0.0%) |
| $75,000 to $99,999 | 22 (5.4%) | 9 (13.6%) |
| $100,000 to $149,999 | 101 (24.7%) | 0 (0.0%) |
| $150,000 or more | 105 (25.7%) | 0 (0.0%) |
| Total | 409 (100.0%) | 66 (100.0%) |
Monthly Housing Cost Tiers in Squirrel Mountain Valley
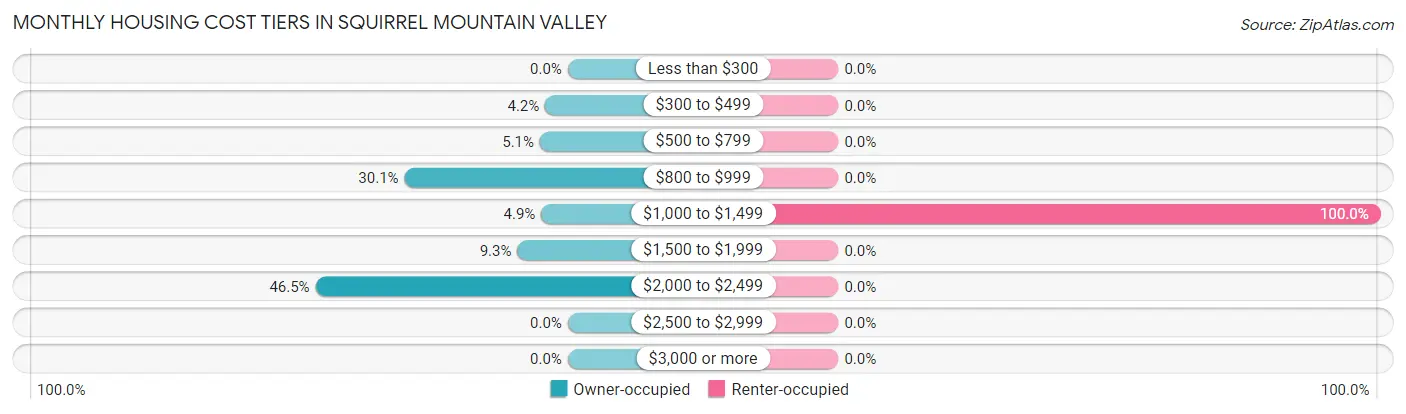
| Monthly Cost | Owner-occupied | Renter-occupied |
| Less than $300 | 0 (0.0%) | 0 (0.0%) |
| $300 to $499 | 17 (4.2%) | 0 (0.0%) |
| $500 to $799 | 21 (5.1%) | 0 (0.0%) |
| $800 to $999 | 123 (30.1%) | 0 (0.0%) |
| $1,000 to $1,499 | 20 (4.9%) | 66 (100.0%) |
| $1,500 to $1,999 | 38 (9.3%) | 0 (0.0%) |
| $2,000 to $2,499 | 190 (46.5%) | 0 (0.0%) |
| $2,500 to $2,999 | 0 (0.0%) | 0 (0.0%) |
| $3,000 or more | 0 (0.0%) | 0 (0.0%) |
| Total | 409 (100.0%) | 66 (100.0%) |
Physical Housing Characteristics in Squirrel Mountain Valley
Housing Structures in Squirrel Mountain Valley
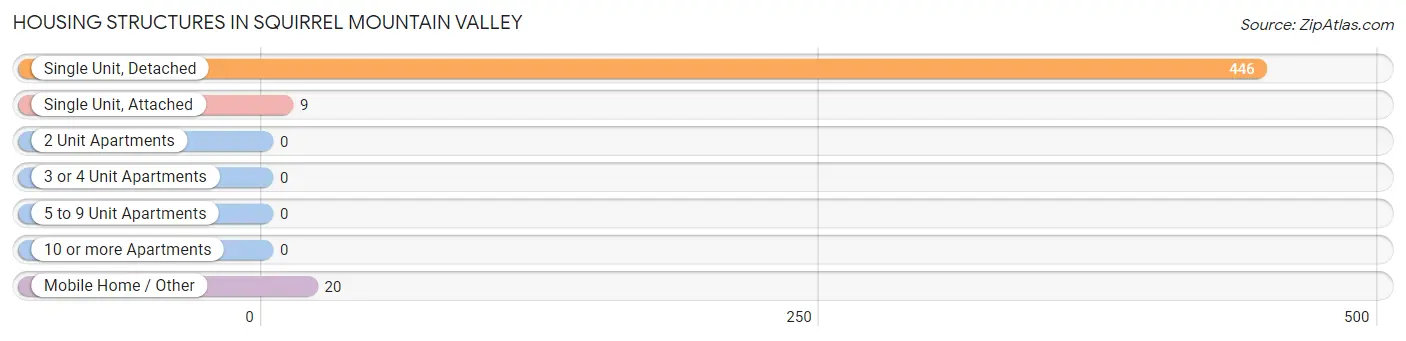
| Structure Type | # Housing Units | % Housing Units |
| Single Unit, Detached | 446 | 93.9% |
| Single Unit, Attached | 9 | 1.9% |
| 2 Unit Apartments | 0 | 0.0% |
| 3 or 4 Unit Apartments | 0 | 0.0% |
| 5 to 9 Unit Apartments | 0 | 0.0% |
| 10 or more Apartments | 0 | 0.0% |
| Mobile Home / Other | 20 | 4.2% |
| Total | 475 | 100.0% |
Housing Structures by Occupancy in Squirrel Mountain Valley
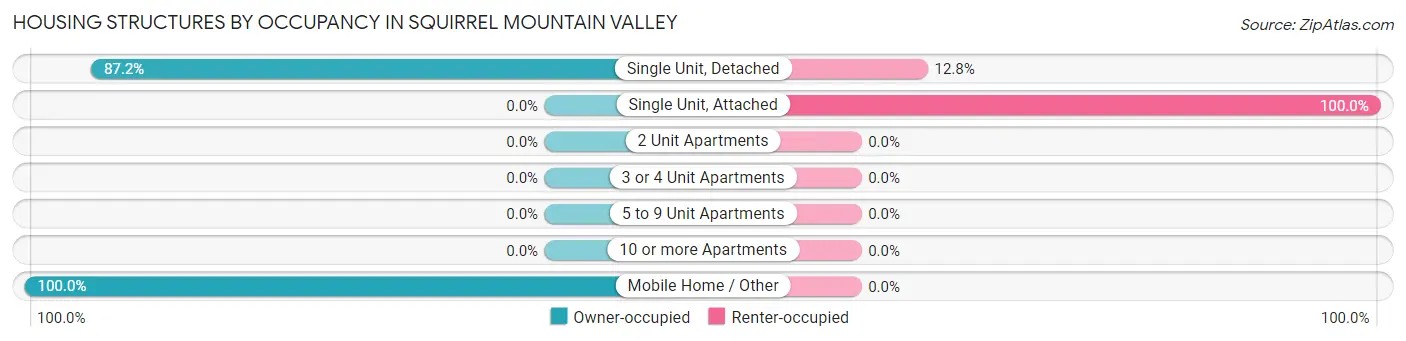
| Structure Type | Owner-occupied | Renter-occupied |
| Single Unit, Detached | 389 (87.2%) | 57 (12.8%) |
| Single Unit, Attached | 0 (0.0%) | 9 (100.0%) |
| 2 Unit Apartments | 0 (0.0%) | 0 (0.0%) |
| 3 or 4 Unit Apartments | 0 (0.0%) | 0 (0.0%) |
| 5 to 9 Unit Apartments | 0 (0.0%) | 0 (0.0%) |
| 10 or more Apartments | 0 (0.0%) | 0 (0.0%) |
| Mobile Home / Other | 20 (100.0%) | 0 (0.0%) |
| Total | 409 (86.1%) | 66 (13.9%) |
Housing Structures by Number of Rooms in Squirrel Mountain Valley
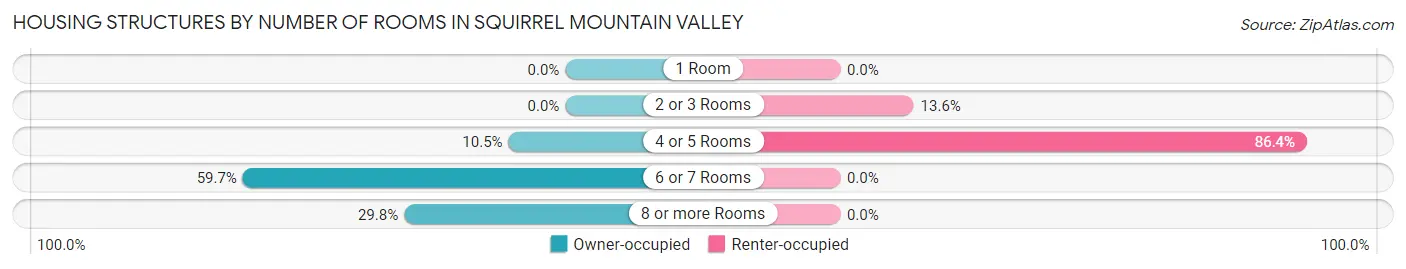
| Number of Rooms | Owner-occupied | Renter-occupied |
| 1 Room | 0 (0.0%) | 0 (0.0%) |
| 2 or 3 Rooms | 0 (0.0%) | 9 (13.6%) |
| 4 or 5 Rooms | 43 (10.5%) | 57 (86.4%) |
| 6 or 7 Rooms | 244 (59.7%) | 0 (0.0%) |
| 8 or more Rooms | 122 (29.8%) | 0 (0.0%) |
| Total | 409 (100.0%) | 66 (100.0%) |
Housing Structure by Heating Type in Squirrel Mountain Valley
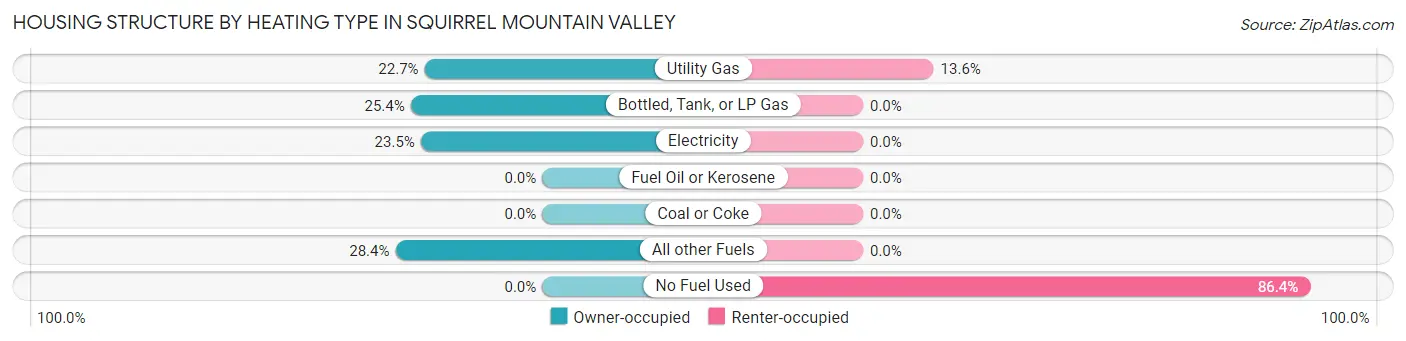
| Heating Type | Owner-occupied | Renter-occupied |
| Utility Gas | 93 (22.7%) | 9 (13.6%) |
| Bottled, Tank, or LP Gas | 104 (25.4%) | 0 (0.0%) |
| Electricity | 96 (23.5%) | 0 (0.0%) |
| Fuel Oil or Kerosene | 0 (0.0%) | 0 (0.0%) |
| Coal or Coke | 0 (0.0%) | 0 (0.0%) |
| All other Fuels | 116 (28.4%) | 0 (0.0%) |
| No Fuel Used | 0 (0.0%) | 57 (86.4%) |
| Total | 409 (100.0%) | 66 (100.0%) |
Household Vehicle Usage in Squirrel Mountain Valley
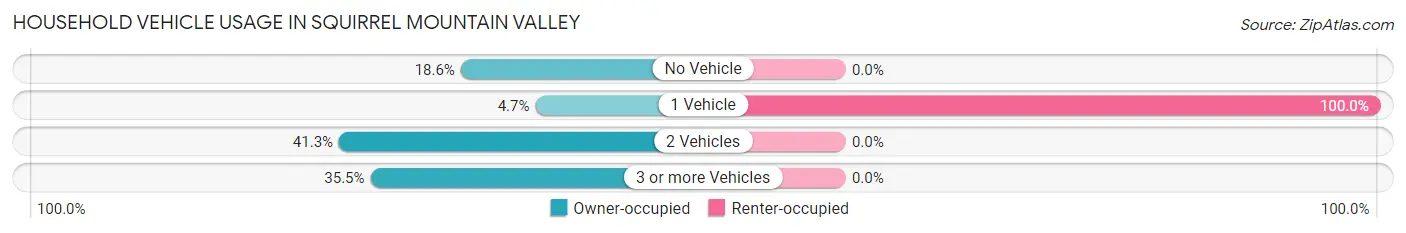
| Vehicles per Household | Owner-occupied | Renter-occupied |
| No Vehicle | 76 (18.6%) | 0 (0.0%) |
| 1 Vehicle | 19 (4.6%) | 66 (100.0%) |
| 2 Vehicles | 169 (41.3%) | 0 (0.0%) |
| 3 or more Vehicles | 145 (35.4%) | 0 (0.0%) |
| Total | 409 (100.0%) | 66 (100.0%) |
Real Estate & Mortgages in Squirrel Mountain Valley
Real Estate and Mortgage Overview in Squirrel Mountain Valley
| Characteristic | Without Mortgage | With Mortgage |
| Housing Units | 180 | 229 |
| Median Property Value | $508,100 | $328,000 |
| Median Household Income | - | - |
| Monthly Housing Costs | $924 | $0 |
| Real Estate Taxes | $3,196 | $0 |
Property Value by Mortgage Status in Squirrel Mountain Valley
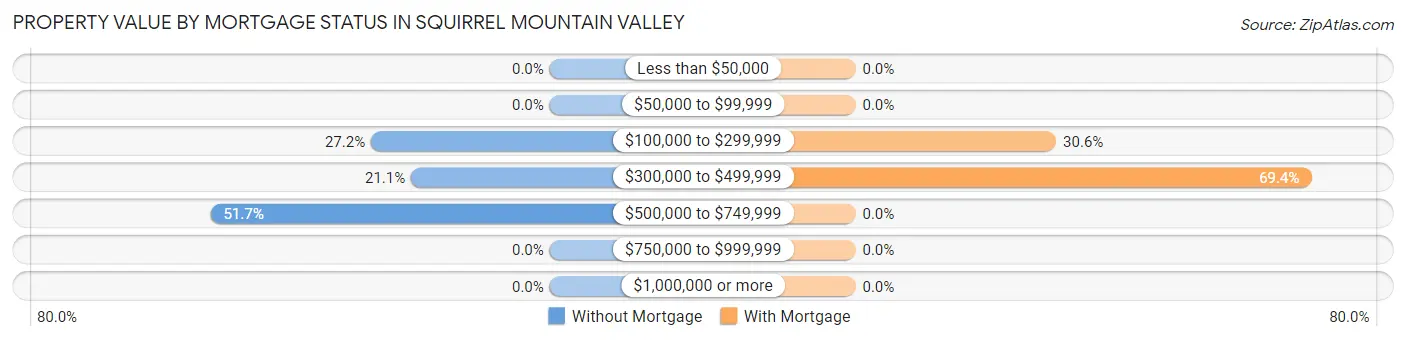
| Property Value | Without Mortgage | With Mortgage |
| Less than $50,000 | 0 (0.0%) | 0 (0.0%) |
| $50,000 to $99,999 | 0 (0.0%) | 0 (0.0%) |
| $100,000 to $299,999 | 49 (27.2%) | 70 (30.6%) |
| $300,000 to $499,999 | 38 (21.1%) | 159 (69.4%) |
| $500,000 to $749,999 | 93 (51.7%) | 0 (0.0%) |
| $750,000 to $999,999 | 0 (0.0%) | 0 (0.0%) |
| $1,000,000 or more | 0 (0.0%) | 0 (0.0%) |
| Total | 180 (100.0%) | 229 (100.0%) |
Household Income by Mortgage Status in Squirrel Mountain Valley
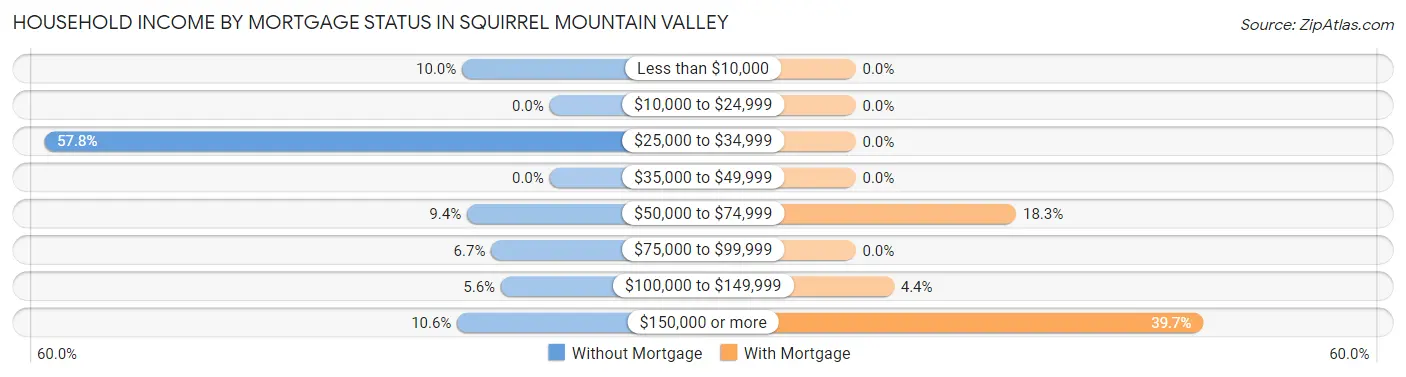
| Household Income | Without Mortgage | With Mortgage |
| Less than $10,000 | 18 (10.0%) | 0 (0.0%) |
| $10,000 to $24,999 | 0 (0.0%) | 0 (0.0%) |
| $25,000 to $34,999 | 104 (57.8%) | 0 (0.0%) |
| $35,000 to $49,999 | 0 (0.0%) | 0 (0.0%) |
| $50,000 to $74,999 | 17 (9.4%) | 42 (18.3%) |
| $75,000 to $99,999 | 12 (6.7%) | 0 (0.0%) |
| $100,000 to $149,999 | 10 (5.6%) | 10 (4.4%) |
| $150,000 or more | 19 (10.6%) | 91 (39.7%) |
| Total | 180 (100.0%) | 229 (100.0%) |
Property Value to Household Income Ratio in Squirrel Mountain Valley
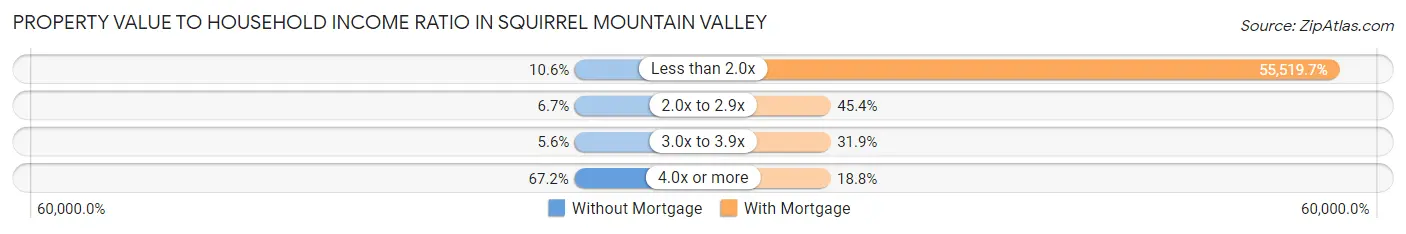
| Value-to-Income Ratio | Without Mortgage | With Mortgage |
| Less than 2.0x | 19 (10.6%) | 127,140 (55,519.7%) |
| 2.0x to 2.9x | 12 (6.7%) | 104 (45.4%) |
| 3.0x to 3.9x | 10 (5.6%) | 73 (31.9%) |
| 4.0x or more | 121 (67.2%) | 43 (18.8%) |
| Total | 180 (100.0%) | 229 (100.0%) |
Real Estate Taxes by Mortgage Status in Squirrel Mountain Valley
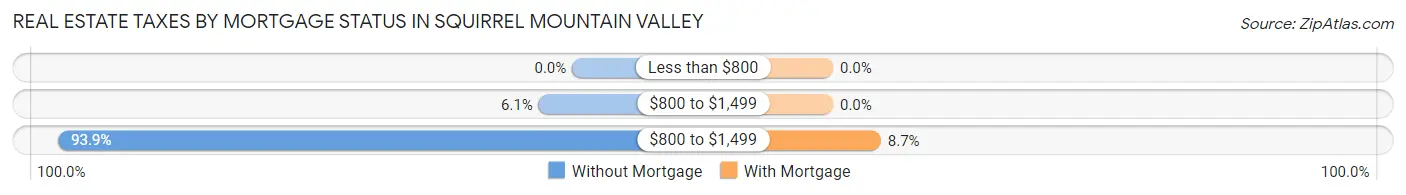
| Property Taxes | Without Mortgage | With Mortgage |
| Less than $800 | 0 (0.0%) | 0 (0.0%) |
| $800 to $1,499 | 11 (6.1%) | 0 (0.0%) |
| $800 to $1,499 | 169 (93.9%) | 20 (8.7%) |
| Total | 180 (100.0%) | 229 (100.0%) |
Health & Disability in Squirrel Mountain Valley
Health Insurance Coverage by Age in Squirrel Mountain Valley
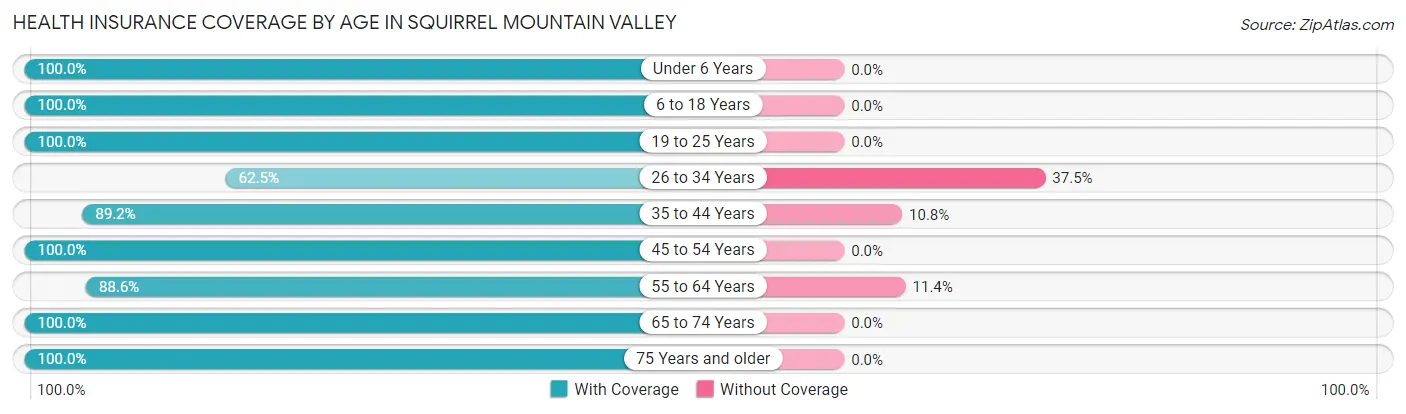
| Age Bracket | With Coverage | Without Coverage |
| Under 6 Years | 80 (100.0%) | 0 (0.0%) |
| 6 to 18 Years | 101 (100.0%) | 0 (0.0%) |
| 19 to 25 Years | 11 (100.0%) | 0 (0.0%) |
| 26 to 34 Years | 20 (62.5%) | 12 (37.5%) |
| 35 to 44 Years | 149 (89.2%) | 18 (10.8%) |
| 45 to 54 Years | 98 (100.0%) | 0 (0.0%) |
| 55 to 64 Years | 240 (88.6%) | 31 (11.4%) |
| 65 to 74 Years | 171 (100.0%) | 0 (0.0%) |
| 75 Years and older | 140 (100.0%) | 0 (0.0%) |
| Total | 1,010 (94.3%) | 61 (5.7%) |
Health Insurance Coverage by Citizenship Status in Squirrel Mountain Valley
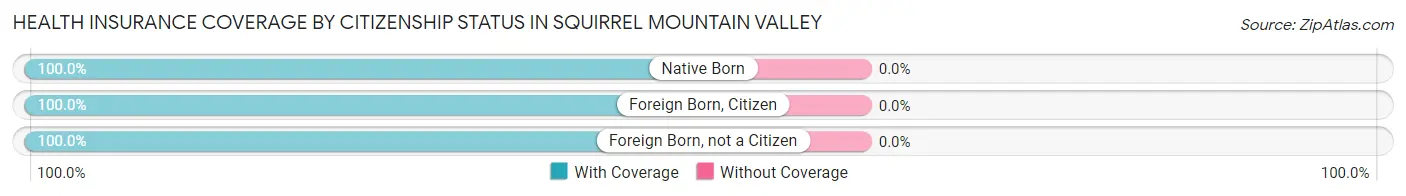
| Citizenship Status | With Coverage | Without Coverage |
| Native Born | 80 (100.0%) | 0 (0.0%) |
| Foreign Born, Citizen | 101 (100.0%) | 0 (0.0%) |
| Foreign Born, not a Citizen | 11 (100.0%) | 0 (0.0%) |
Health Insurance Coverage by Household Income in Squirrel Mountain Valley
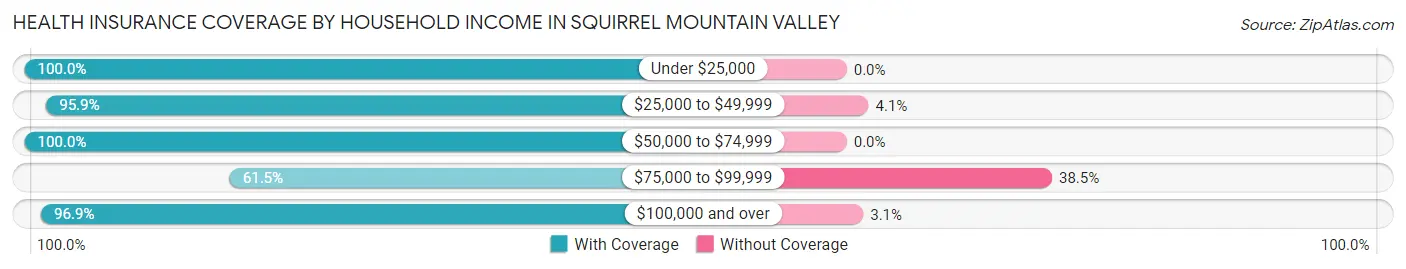
| Household Income | With Coverage | Without Coverage |
| Under $25,000 | 75 (100.0%) | 0 (0.0%) |
| $25,000 to $49,999 | 306 (95.9%) | 13 (4.1%) |
| $50,000 to $74,999 | 17 (100.0%) | 0 (0.0%) |
| $75,000 to $99,999 | 48 (61.5%) | 30 (38.5%) |
| $100,000 and over | 564 (96.9%) | 18 (3.1%) |
Public vs Private Health Insurance Coverage by Age in Squirrel Mountain Valley
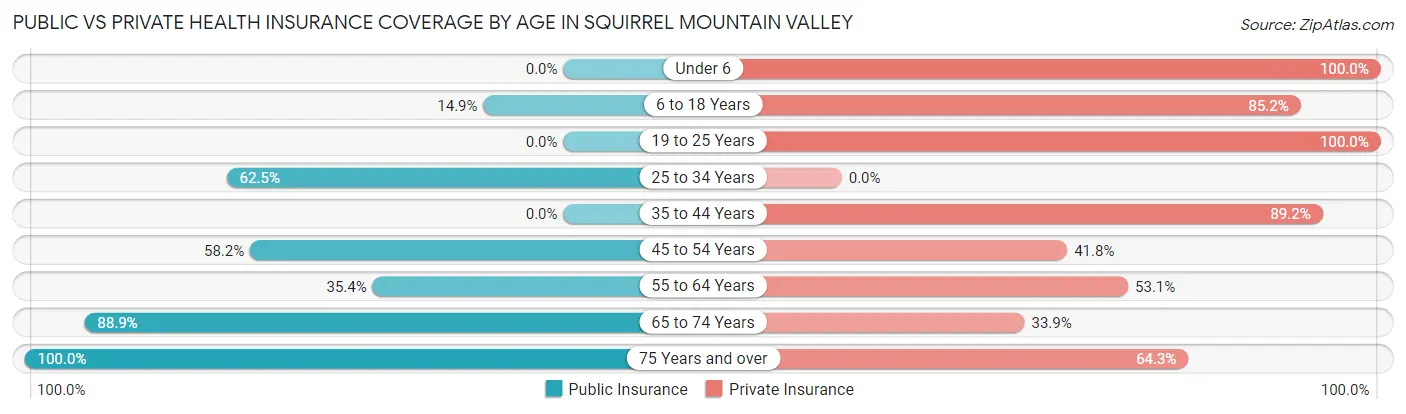
| Age Bracket | Public Insurance | Private Insurance |
| Under 6 | 0 (0.0%) | 80 (100.0%) |
| 6 to 18 Years | 15 (14.8%) | 86 (85.2%) |
| 19 to 25 Years | 0 (0.0%) | 11 (100.0%) |
| 25 to 34 Years | 20 (62.5%) | 0 (0.0%) |
| 35 to 44 Years | 0 (0.0%) | 149 (89.2%) |
| 45 to 54 Years | 57 (58.2%) | 41 (41.8%) |
| 55 to 64 Years | 96 (35.4%) | 144 (53.1%) |
| 65 to 74 Years | 152 (88.9%) | 58 (33.9%) |
| 75 Years and over | 140 (100.0%) | 90 (64.3%) |
| Total | 480 (44.8%) | 659 (61.5%) |
Disability Status by Sex by Age in Squirrel Mountain Valley
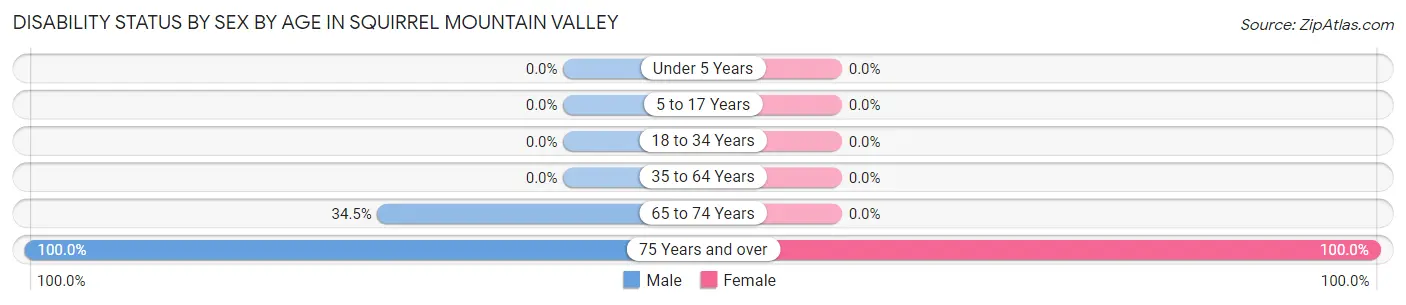
| Age Bracket | Male | Female |
| Under 5 Years | 0 (0.0%) | 0 (0.0%) |
| 5 to 17 Years | 0 (0.0%) | 0 (0.0%) |
| 18 to 34 Years | 0 (0.0%) | 0 (0.0%) |
| 35 to 64 Years | 0 (0.0%) | 0 (0.0%) |
| 65 to 74 Years | 10 (34.5%) | 0 (0.0%) |
| 75 Years and over | 108 (100.0%) | 32 (100.0%) |
Disability Class by Sex by Age in Squirrel Mountain Valley
Disability Class: Hearing Difficulty
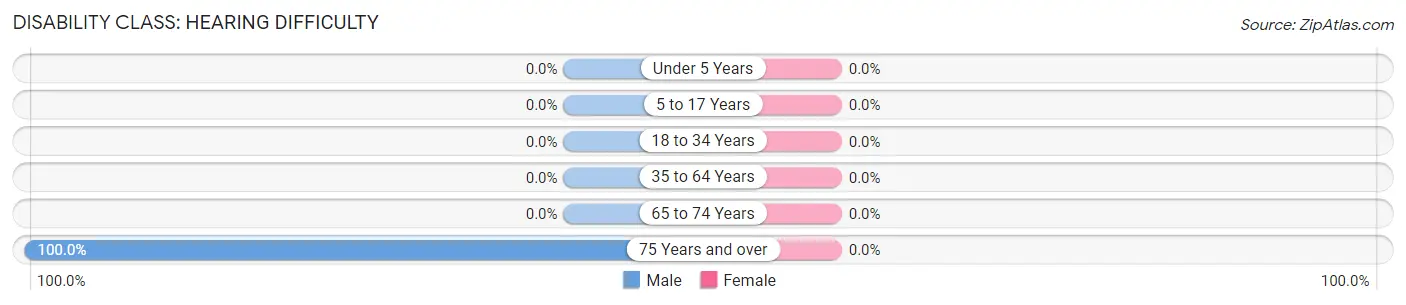
| Age Bracket | Male | Female |
| Under 5 Years | 0 (0.0%) | 0 (0.0%) |
| 5 to 17 Years | 0 (0.0%) | 0 (0.0%) |
| 18 to 34 Years | 0 (0.0%) | 0 (0.0%) |
| 35 to 64 Years | 0 (0.0%) | 0 (0.0%) |
| 65 to 74 Years | 0 (0.0%) | 0 (0.0%) |
| 75 Years and over | 108 (100.0%) | 0 (0.0%) |
Disability Class: Vision Difficulty
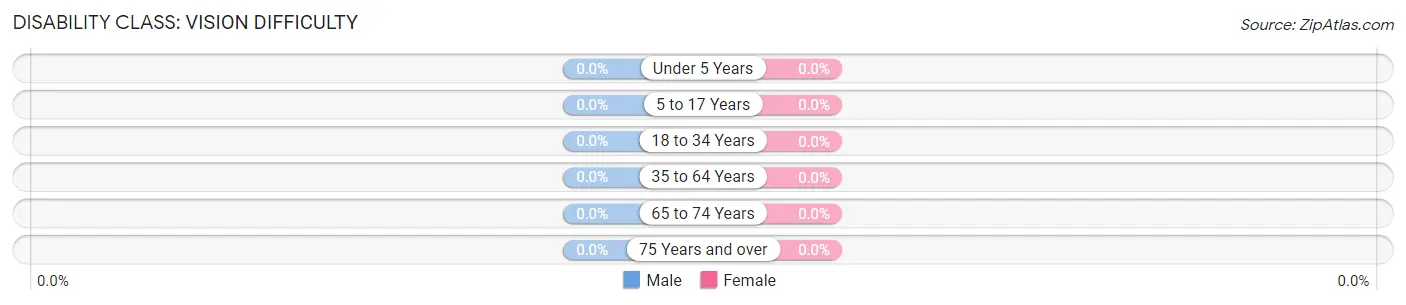
| Age Bracket | Male | Female |
| Under 5 Years | 0 (0.0%) | 0 (0.0%) |
| 5 to 17 Years | 0 (0.0%) | 0 (0.0%) |
| 18 to 34 Years | 0 (0.0%) | 0 (0.0%) |
| 35 to 64 Years | 0 (0.0%) | 0 (0.0%) |
| 65 to 74 Years | 0 (0.0%) | 0 (0.0%) |
| 75 Years and over | 0 (0.0%) | 0 (0.0%) |
Disability Class: Cognitive Difficulty
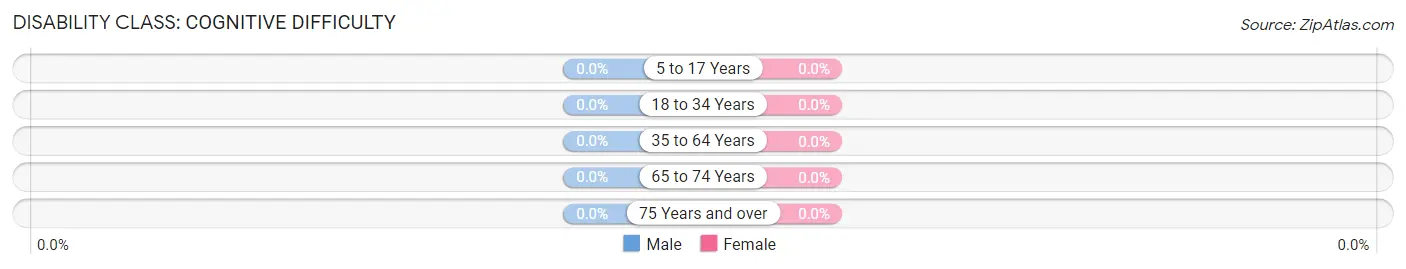
| Age Bracket | Male | Female |
| 5 to 17 Years | 0 (0.0%) | 0 (0.0%) |
| 18 to 34 Years | 0 (0.0%) | 0 (0.0%) |
| 35 to 64 Years | 0 (0.0%) | 0 (0.0%) |
| 65 to 74 Years | 0 (0.0%) | 0 (0.0%) |
| 75 Years and over | 0 (0.0%) | 0 (0.0%) |
Disability Class: Ambulatory Difficulty
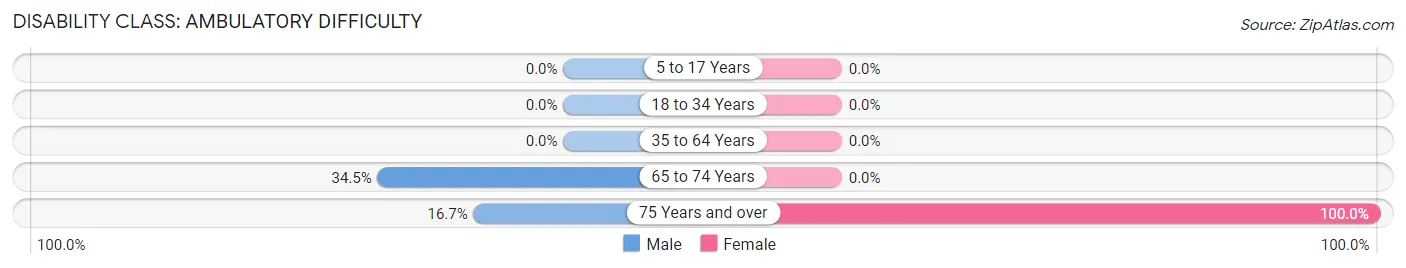
| Age Bracket | Male | Female |
| 5 to 17 Years | 0 (0.0%) | 0 (0.0%) |
| 18 to 34 Years | 0 (0.0%) | 0 (0.0%) |
| 35 to 64 Years | 0 (0.0%) | 0 (0.0%) |
| 65 to 74 Years | 10 (34.5%) | 0 (0.0%) |
| 75 Years and over | 18 (16.7%) | 32 (100.0%) |
Disability Class: Self-Care Difficulty
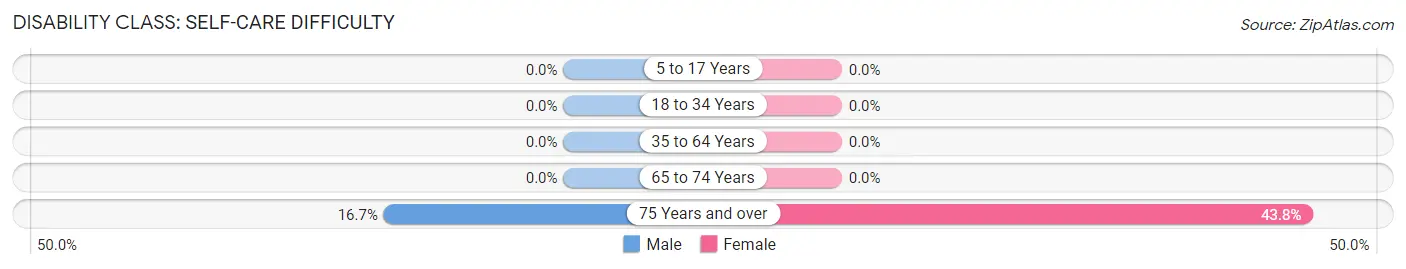
| Age Bracket | Male | Female |
| 5 to 17 Years | 0 (0.0%) | 0 (0.0%) |
| 18 to 34 Years | 0 (0.0%) | 0 (0.0%) |
| 35 to 64 Years | 0 (0.0%) | 0 (0.0%) |
| 65 to 74 Years | 0 (0.0%) | 0 (0.0%) |
| 75 Years and over | 18 (16.7%) | 14 (43.8%) |
Technology Access in Squirrel Mountain Valley
Computing Device Access in Squirrel Mountain Valley
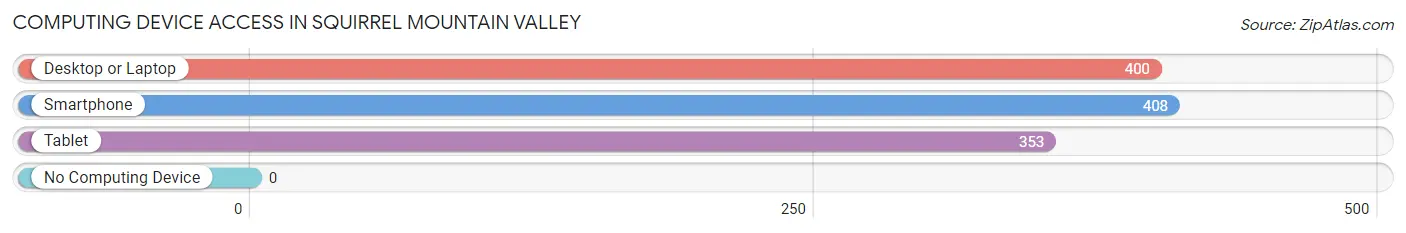
| Device Type | # Households | % Households |
| Desktop or Laptop | 400 | 84.2% |
| Smartphone | 408 | 85.9% |
| Tablet | 353 | 74.3% |
| No Computing Device | 0 | 0.0% |
| Total | 475 | 100.0% |
Internet Access in Squirrel Mountain Valley
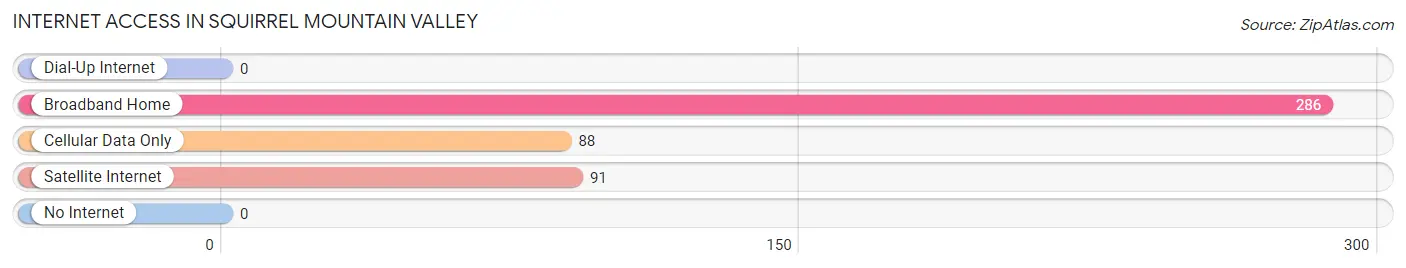
| Internet Type | # Households | % Households |
| Dial-Up Internet | 0 | 0.0% |
| Broadband Home | 286 | 60.2% |
| Cellular Data Only | 88 | 18.5% |
| Satellite Internet | 91 | 19.2% |
| No Internet | 0 | 0.0% |
| Total | 475 | 100.0% |
Squirrel Mountain Valley Summary
Squirrel Mountain Valley is a small, rural community located in the San Bernardino Mountains of Southern California. It is situated in the San Bernardino National Forest, approximately 25 miles east of the city of San Bernardino. The valley is surrounded by the San Bernardino National Forest and is home to a variety of wildlife, including deer, coyotes, and mountain lions.
Geography
Squirrel Mountain Valley is located in the San Bernardino Mountains of Southern California. It is situated in the San Bernardino National Forest, approximately 25 miles east of the city of San Bernardino. The valley is surrounded by the San Bernardino National Forest and is home to a variety of wildlife, including deer, coyotes, and mountain lions. The valley is approximately 4,000 feet above sea level and is located in the Mojave Desert. The valley is characterized by its rugged terrain, with steep hills and deep canyons. The valley is also home to a variety of plant life, including Joshua trees, pinyon pines, and juniper trees.
History
The area that is now known as Squirrel Mountain Valley has been inhabited by Native Americans for thousands of years. The Serrano and Cahuilla tribes were the primary inhabitants of the area, and they used the valley for hunting and gathering. The first European settlers arrived in the area in the late 1800s, and the valley was soon populated by ranchers and farmers. The valley was also home to a number of mining operations, which were active until the early 1900s.
Economy
The economy of Squirrel Mountain Valley is largely based on tourism and recreation. The valley is home to a number of campgrounds, hiking trails, and other outdoor activities. The valley is also home to a number of small businesses, including restaurants, stores, and other services. The valley is also home to a number of small farms, which produce a variety of fruits and vegetables.
Demographics
As of the 2010 census, the population of Squirrel Mountain Valley was 1,845. The population is primarily white (90.2%), with a small percentage of Hispanic (4.2%) and African American (2.2%) residents. The median household income in the valley is $45,000, and the median home value is $250,000. The unemployment rate in the valley is 5.2%.
Conclusion
Squirrel Mountain Valley is a small, rural community located in the San Bernardino Mountains of Southern California. It is situated in the San Bernardino National Forest, approximately 25 miles east of the city of San Bernardino. The valley is surrounded by the San Bernardino National Forest and is home to a variety of wildlife, including deer, coyotes, and mountain lions. The economy of the valley is largely based on tourism and recreation, and the population is primarily white. The median household income in the valley is $45,000, and the median home value is $250,000.
Common Questions
What is Per Capita Income in Squirrel Mountain Valley?
Per Capita income in Squirrel Mountain Valley is $40,016.
What is Inequality or Gini Index in Squirrel Mountain Valley?
Inequality or Gini Index in Squirrel Mountain Valley is 0.43.
What is the Total Population of Squirrel Mountain Valley?
Total Population of Squirrel Mountain Valley is 1,071.
What is the Total Male Population of Squirrel Mountain Valley?
Total Male Population of Squirrel Mountain Valley is 566.
What is the Total Female Population of Squirrel Mountain Valley?
Total Female Population of Squirrel Mountain Valley is 505.
What is the Ratio of Males per 100 Females in Squirrel Mountain Valley?
There are 112.08 Males per 100 Females in Squirrel Mountain Valley.
What is the Ratio of Females per 100 Males in Squirrel Mountain Valley?
There are 89.22 Females per 100 Males in Squirrel Mountain Valley.
What is the Median Population Age in Squirrel Mountain Valley?
Median Population Age in Squirrel Mountain Valley is 60.4 Years.
What is the Average Family Size in Squirrel Mountain Valley
Average Family Size in Squirrel Mountain Valley is 2.7 People.
What is the Average Household Size in Squirrel Mountain Valley
Average Household Size in Squirrel Mountain Valley is 2.2 People.
How Large is the Labor Force in Squirrel Mountain Valley?
There are 290 People in the Labor Forcein in Squirrel Mountain Valley.
What is the Percentage of People in the Labor Force in Squirrel Mountain Valley?
32.2% of People are in the Labor Force in Squirrel Mountain Valley.
What is the Unemployment Rate in Squirrel Mountain Valley?
Unemployment Rate in Squirrel Mountain Valley is 11.4%.