Cities with the Highest Percentage of Population with a Degree in Liberal Arts and History in New Jersey
RELATED REPORTS & OPTIONS
Liberal Arts and History
New Jersey
Compare Cities
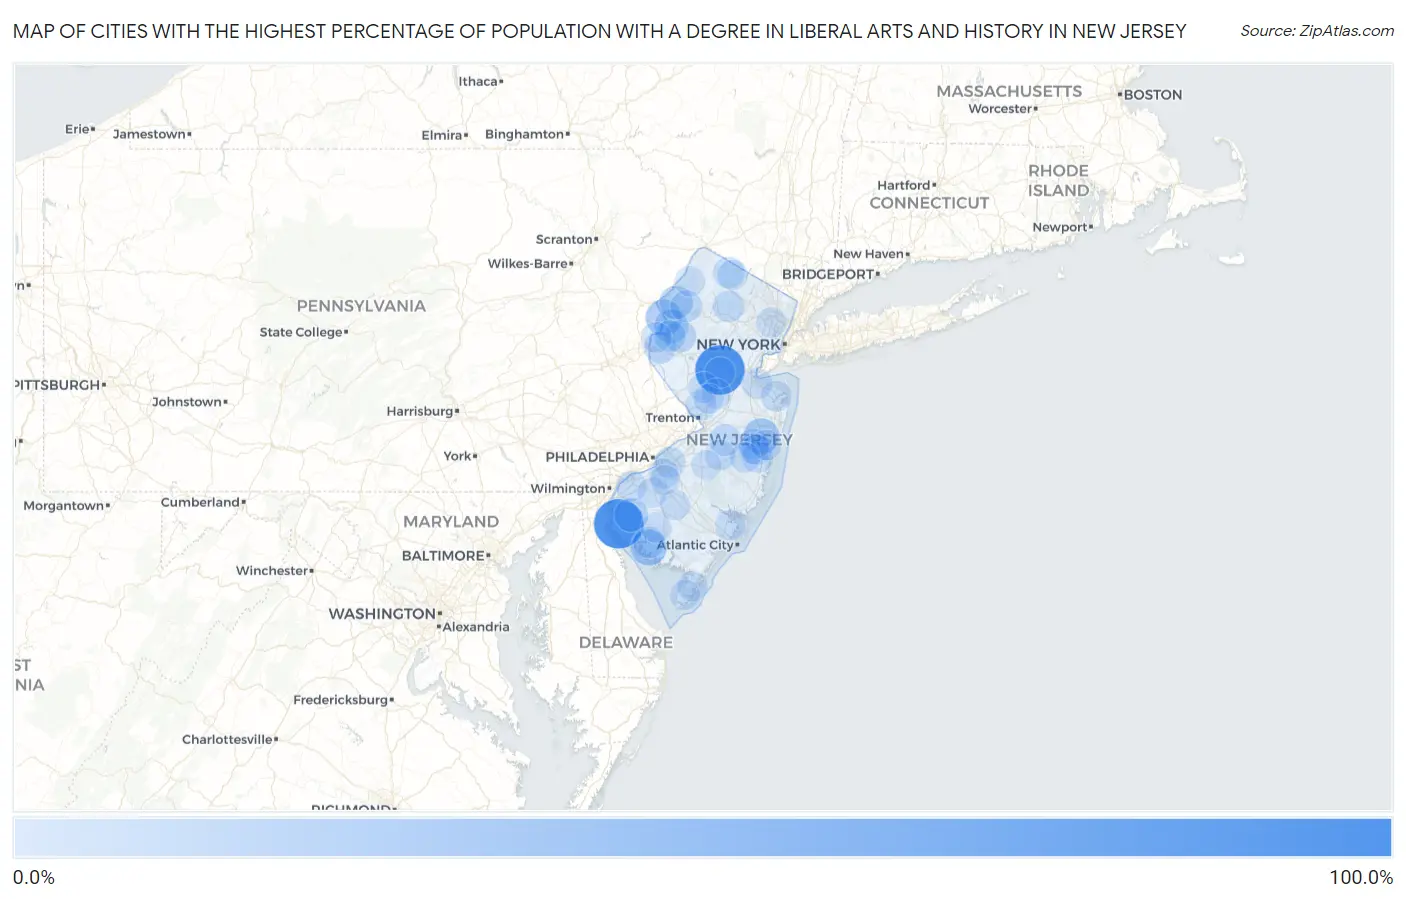
Map of Cities with the Highest Percentage of Population with a Degree in Liberal Arts and History in New Jersey
0.0%
100.0%
Cities with the Highest Percentage of Population with a Degree in Liberal Arts and History in New Jersey
| City | % Graduates | vs State | vs National | |
| 1. | Hancocks Bridge | 100.0% | 4.6%(+95.4)#1 | 4.9%(+95.1)#14 |
| 2. | Zarephath | 100.0% | 4.6%(+95.4)#2 | 4.9%(+95.1)#62 |
| 3. | Richland | 81.4% | 4.6%(+76.8)#3 | 4.9%(+76.5)#103 |
| 4. | Kean University | 55.6% | 4.6%(+51.0)#4 | 4.9%(+50.7)#194 |
| 5. | Seeley | 54.8% | 4.6%(+50.2)#5 | 4.9%(+49.9)#203 |
| 6. | Delmont | 53.3% | 4.6%(+48.8)#6 | 4.9%(+48.5)#210 |
| 7. | Ramapo College Of New Jersey | 51.0% | 4.6%(+46.4)#7 | 4.9%(+46.1)#220 |
| 8. | Lamington | 50.0% | 4.6%(+45.4)#8 | 4.9%(+45.1)#250 |
| 9. | Tavistock Borough | 40.0% | 4.6%(+35.4)#9 | 4.9%(+35.1)#388 |
| 10. | William Paterson University Of New Jersey | 39.3% | 4.6%(+34.7)#10 | 4.9%(+34.4)#394 |
| 11. | Cedarville | 36.6% | 4.6%(+32.0)#11 | 4.9%(+31.7)#447 |
| 12. | Delaware | 36.4% | 4.6%(+31.8)#12 | 4.9%(+31.5)#451 |
| 13. | Lakewood | 34.9% | 4.6%(+30.3)#13 | 4.9%(+30.0)#486 |
| 14. | Buttzville | 27.3% | 4.6%(+22.7)#14 | 4.9%(+22.4)#779 |
| 15. | Alloway | 26.4% | 4.6%(+21.8)#15 | 4.9%(+21.5)#823 |
| 16. | Union | 24.9% | 4.6%(+20.3)#16 | 4.9%(+20.0)#928 |
| 17. | Blairstown | 24.0% | 4.6%(+19.4)#17 | 4.9%(+19.1)#967 |
| 18. | Absecon Highlands | 19.9% | 4.6%(+15.4)#18 | 4.9%(+15.1)#1,309 |
| 19. | Renaissance At Monroe | 19.1% | 4.6%(+14.5)#19 | 4.9%(+14.2)#1,381 |
| 20. | Sunset Lake | 18.9% | 4.6%(+14.3)#20 | 4.9%(+14.0)#1,413 |
| 21. | Stewartsville | 18.2% | 4.6%(+13.6)#21 | 4.9%(+13.3)#1,482 |
| 22. | Dividing Creek | 17.9% | 4.6%(+13.3)#22 | 4.9%(+13.0)#1,532 |
| 23. | Anderson | 17.8% | 4.6%(+13.2)#23 | 4.9%(+12.9)#1,542 |
| 24. | Johnsonburg | 16.8% | 4.6%(+12.2)#24 | 4.9%(+11.9)#1,687 |
| 25. | Lakehurst Borough | 16.6% | 4.6%(+12.1)#25 | 4.9%(+11.8)#1,761 |
| 26. | Neshanic | 16.6% | 4.6%(+12.0)#26 | 4.9%(+11.7)#1,764 |
| 27. | Malaga | 16.4% | 4.6%(+11.8)#27 | 4.9%(+11.5)#1,784 |
| 28. | New Egypt | 16.4% | 4.6%(+11.8)#28 | 4.9%(+11.5)#1,785 |
| 29. | Fairton | 16.0% | 4.6%(+11.4)#29 | 4.9%(+11.1)#1,852 |
| 30. | Branchville Borough | 15.9% | 4.6%(+11.4)#30 | 4.9%(+11.1)#1,867 |
| 31. | Cape May Point Borough | 15.4% | 4.6%(+10.9)#31 | 4.9%(+10.6)#1,953 |
| 32. | Lake Telemark | 15.1% | 4.6%(+10.6)#32 | 4.9%(+10.3)#2,025 |
| 33. | Brass Castle | 14.9% | 4.6%(+10.4)#33 | 4.9%(+10.1)#2,059 |
| 34. | Ampere North | 14.1% | 4.6%(+9.49)#34 | 4.9%(+9.19)#2,288 |
| 35. | Vernon Center | 14.1% | 4.6%(+9.49)#35 | 4.9%(+9.19)#2,290 |
| 36. | Ellisburg | 13.9% | 4.6%(+9.29)#36 | 4.9%(+8.99)#2,341 |
| 37. | Washington Borough | 13.5% | 4.6%(+8.91)#37 | 4.9%(+8.61)#2,458 |
| 38. | Millstone Borough | 13.2% | 4.6%(+8.63)#38 | 4.9%(+8.33)#2,556 |
| 39. | Holiday City South | 12.9% | 4.6%(+8.37)#39 | 4.9%(+8.07)#2,630 |
| 40. | Brooklawn Borough | 12.8% | 4.6%(+8.21)#40 | 4.9%(+7.90)#2,678 |
| 41. | Sewell | 12.3% | 4.6%(+7.74)#41 | 4.9%(+7.43)#2,854 |
| 42. | South Toms River Borough | 12.3% | 4.6%(+7.69)#42 | 4.9%(+7.39)#2,865 |
| 43. | Harmony | 12.2% | 4.6%(+7.68)#43 | 4.9%(+7.37)#2,875 |
| 44. | Fairview | 12.2% | 4.6%(+7.63)#44 | 4.9%(+7.32)#2,884 |
| 45. | Mantoloking Borough | 12.2% | 4.6%(+7.60)#45 | 4.9%(+7.30)#2,902 |
| 46. | Beckett | 12.1% | 4.6%(+7.53)#46 | 4.9%(+7.23)#2,926 |
| 47. | Lawrenceville | 12.0% | 4.6%(+7.45)#47 | 4.9%(+7.14)#2,959 |
| 48. | Swedesboro Borough | 12.0% | 4.6%(+7.44)#48 | 4.9%(+7.14)#2,961 |
| 49. | Skillman | 12.0% | 4.6%(+7.43)#49 | 4.9%(+7.13)#2,978 |
| 50. | Island Heights Borough | 12.0% | 4.6%(+7.40)#50 | 4.9%(+7.10)#2,990 |
| 51. | Macopin | 11.8% | 4.6%(+7.20)#51 | 4.9%(+6.89)#3,064 |
| 52. | Stirling | 11.7% | 4.6%(+7.16)#52 | 4.9%(+6.86)#3,098 |
| 53. | Browns Mills | 11.5% | 4.6%(+6.95)#53 | 4.9%(+6.65)#3,181 |
| 54. | Cedar Glen West | 11.3% | 4.6%(+6.76)#54 | 4.9%(+6.46)#3,258 |
| 55. | Netcong Borough | 11.3% | 4.6%(+6.73)#55 | 4.9%(+6.43)#3,267 |
| 56. | Rosenhayn | 11.3% | 4.6%(+6.72)#56 | 4.9%(+6.42)#3,270 |
| 57. | Victory Lakes | 11.2% | 4.6%(+6.66)#57 | 4.9%(+6.35)#3,297 |
| 58. | Sea Bright Borough | 11.2% | 4.6%(+6.64)#58 | 4.9%(+6.33)#3,306 |
| 59. | Laurence Harbor | 11.2% | 4.6%(+6.59)#59 | 4.9%(+6.29)#3,319 |
| 60. | Leisure Village West | 11.1% | 4.6%(+6.54)#60 | 4.9%(+6.24)#3,334 |
| 61. | Pine Lake Park | 11.1% | 4.6%(+6.52)#61 | 4.9%(+6.22)#3,396 |
| 62. | Leisure Village East | 11.1% | 4.6%(+6.48)#62 | 4.9%(+6.18)#3,403 |
| 63. | Crandon Lakes | 11.0% | 4.6%(+6.43)#63 | 4.9%(+6.12)#3,430 |
| 64. | Haworth Borough | 11.0% | 4.6%(+6.39)#64 | 4.9%(+6.08)#3,453 |
| 65. | Keansburg Borough | 10.9% | 4.6%(+6.35)#65 | 4.9%(+6.05)#3,469 |
| 66. | Barnegat Light Borough | 10.9% | 4.6%(+6.29)#66 | 4.9%(+5.99)#3,502 |
| 67. | Hopewell Borough | 10.8% | 4.6%(+6.26)#67 | 4.9%(+5.96)#3,518 |
| 68. | Kingston | 10.8% | 4.6%(+6.23)#68 | 4.9%(+5.92)#3,544 |
| 69. | Weston | 10.7% | 4.6%(+6.18)#69 | 4.9%(+5.87)#3,561 |
| 70. | Neptune City Borough | 10.7% | 4.6%(+6.12)#70 | 4.9%(+5.81)#3,587 |
| 71. | Saddle River Borough | 10.6% | 4.6%(+6.01)#71 | 4.9%(+5.71)#3,649 |
| 72. | Crestwood Village | 10.6% | 4.6%(+6.00)#72 | 4.9%(+5.70)#3,654 |
| 73. | Richwood | 10.5% | 4.6%(+5.97)#73 | 4.9%(+5.67)#3,671 |
| 74. | Ocean Gate Borough | 10.4% | 4.6%(+5.85)#74 | 4.9%(+5.55)#3,750 |
| 75. | Cape May Court House | 10.4% | 4.6%(+5.84)#75 | 4.9%(+5.54)#3,758 |
| 76. | Deal Borough | 10.3% | 4.6%(+5.78)#76 | 4.9%(+5.47)#3,787 |
| 77. | West Wildwood Borough | 10.2% | 4.6%(+5.60)#77 | 4.9%(+5.30)#3,883 |
| 78. | Clearbrook | 10.1% | 4.6%(+5.56)#78 | 4.9%(+5.25)#3,905 |
| 79. | Northvale Borough | 10.1% | 4.6%(+5.53)#79 | 4.9%(+5.22)#3,922 |
| 80. | Highland Lakes | 10.1% | 4.6%(+5.50)#80 | 4.9%(+5.20)#3,937 |
| 81. | Passaic | 9.9% | 4.6%(+5.29)#81 | 4.9%(+4.99)#4,070 |
| 82. | Glen Ridge Borough | 9.8% | 4.6%(+5.26)#82 | 4.9%(+4.96)#4,090 |
| 83. | Smithville | 9.8% | 4.6%(+5.21)#83 | 4.9%(+4.91)#4,116 |
| 84. | Brookside | 9.8% | 4.6%(+5.21)#84 | 4.9%(+4.91)#4,118 |
| 85. | Glendora | 9.8% | 4.6%(+5.19)#85 | 4.9%(+4.89)#4,131 |
| 86. | Frenchtown Borough | 9.6% | 4.6%(+5.06)#86 | 4.9%(+4.76)#4,230 |
| 87. | Seaville | 9.6% | 4.6%(+5.06)#87 | 4.9%(+4.75)#4,232 |
| 88. | English Creek | 9.6% | 4.6%(+5.00)#88 | 4.9%(+4.70)#4,276 |
| 89. | Westville Borough | 9.6% | 4.6%(+4.99)#89 | 4.9%(+4.69)#4,284 |
| 90. | Allenhurst Borough | 9.5% | 4.6%(+4.95)#90 | 4.9%(+4.65)#4,311 |
| 91. | Bay Head Borough | 9.5% | 4.6%(+4.93)#91 | 4.9%(+4.63)#4,337 |
| 92. | Mickleton | 9.5% | 4.6%(+4.92)#92 | 4.9%(+4.62)#4,345 |
| 93. | Princeton | 9.4% | 4.6%(+4.87)#93 | 4.9%(+4.57)#4,371 |
| 94. | Rio Grande | 9.4% | 4.6%(+4.87)#94 | 4.9%(+4.57)#4,372 |
| 95. | Leisuretowne | 9.4% | 4.6%(+4.84)#95 | 4.9%(+4.54)#4,391 |
| 96. | Collingswood Borough | 9.3% | 4.6%(+4.75)#96 | 4.9%(+4.44)#4,462 |
| 97. | Wrightstown Borough | 9.3% | 4.6%(+4.69)#97 | 4.9%(+4.39)#4,504 |
| 98. | Blackwood | 9.1% | 4.6%(+4.52)#98 | 4.9%(+4.22)#4,622 |
| 99. | Lavallette Borough | 9.0% | 4.6%(+4.44)#99 | 4.9%(+4.14)#4,723 |
| 100. | Franklin Lakes Borough | 9.0% | 4.6%(+4.39)#100 | 4.9%(+4.09)#4,764 |
Common Questions
What are the Top 10 Cities with the Highest Percentage of Population with a Degree in Liberal Arts and History in New Jersey?
Top 10 Cities with the Highest Percentage of Population with a Degree in Liberal Arts and History in New Jersey are:
#1
100.0%
#2
100.0%
#3
36.6%
#4
36.4%
#5
34.9%
#6
27.3%
#7
26.4%
#8
24.0%
#9
18.2%
#10
17.8%
What city has the Highest Percentage of Population with a Degree in Liberal Arts and History in New Jersey?
Hancocks Bridge has the Highest Percentage of Population with a Degree in Liberal Arts and History in New Jersey with 100.0%.
What is the Percentage of Population with a Degree in Liberal Arts and History in the State of New Jersey?
Percentage of Population with a Degree in Liberal Arts and History in New Jersey is 4.6%.
What is the Percentage of Population with a Degree in Liberal Arts and History in the United States?
Percentage of Population with a Degree in Liberal Arts and History in the United States is 4.9%.