Cities with the Highest Percentage of Population with a Degree in Liberal Arts and History in Minnesota
RELATED REPORTS & OPTIONS
Liberal Arts and History
Minnesota
Compare Cities
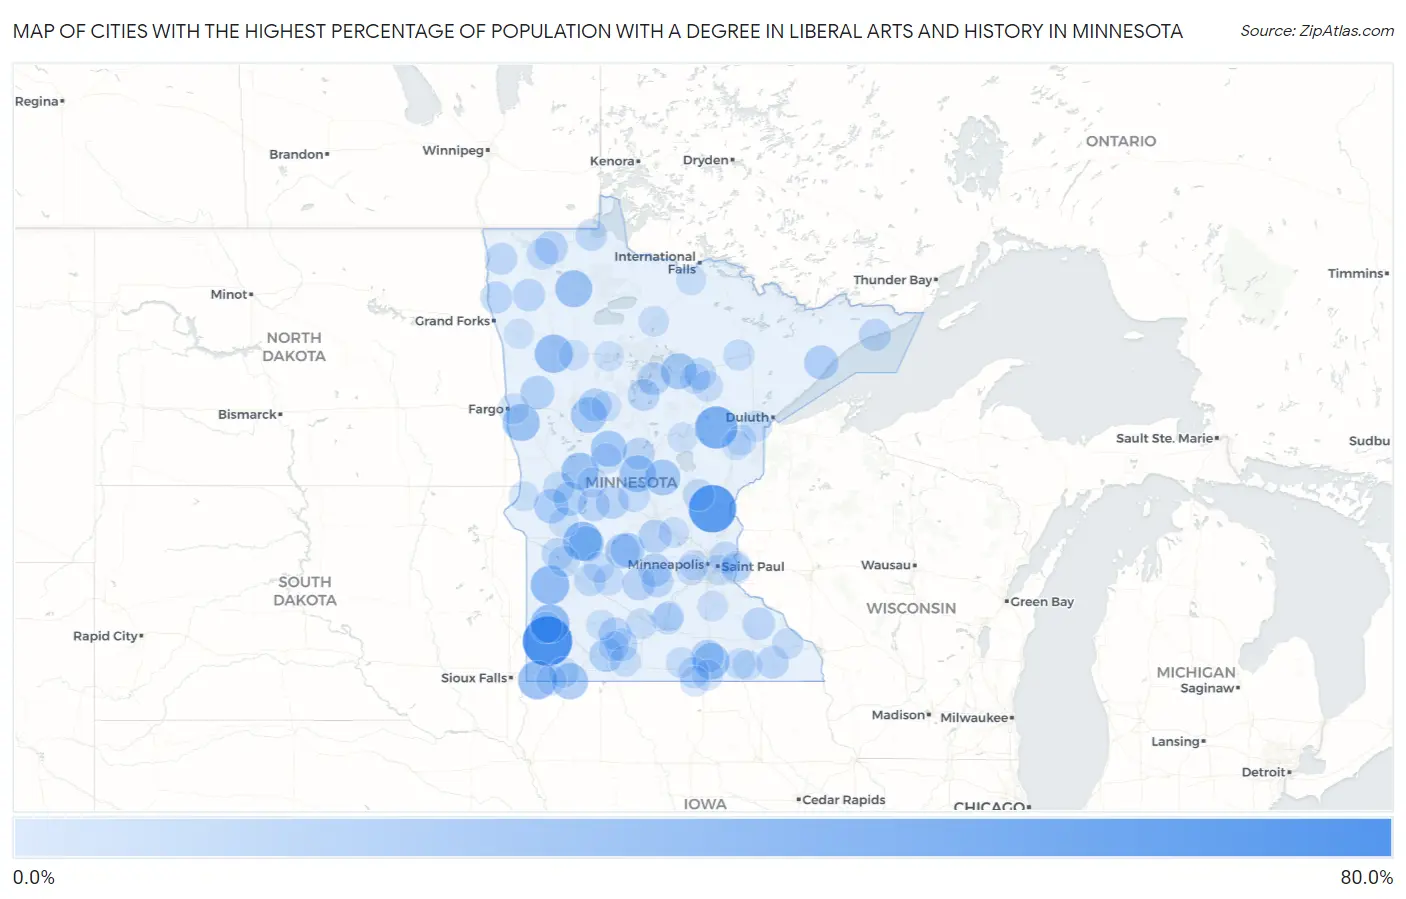
Map of Cities with the Highest Percentage of Population with a Degree in Liberal Arts and History in Minnesota
0.0%
80.0%
Cities with the Highest Percentage of Population with a Degree in Liberal Arts and History in Minnesota
| City | % Graduates | vs State | vs National | |
| 1. | Woodstock | 66.7% | 4.4%(+62.3)#1 | 4.9%(+61.8)#143 |
| 2. | Stanchfield | 60.0% | 4.4%(+55.6)#2 | 4.9%(+55.1)#178 |
| 3. | Tamarack | 44.4% | 4.4%(+40.1)#3 | 4.9%(+39.6)#315 |
| 4. | St. John's University | 39.9% | 4.4%(+35.5)#4 | 4.9%(+35.0)#389 |
| 5. | St Leo | 33.3% | 4.4%(+29.0)#5 | 4.9%(+28.5)#536 |
| 6. | Steen | 33.3% | 4.4%(+29.0)#6 | 4.9%(+28.5)#546 |
| 7. | De Graff | 33.3% | 4.4%(+29.0)#7 | 4.9%(+28.5)#549 |
| 8. | Florence | 33.3% | 4.4%(+29.0)#8 | 4.9%(+28.5)#565 |
| 9. | Winger | 32.0% | 4.4%(+27.6)#9 | 4.9%(+27.1)#593 |
| 10. | Grygla | 28.6% | 4.4%(+24.2)#10 | 4.9%(+23.7)#711 |
| 11. | Baker | 28.6% | 4.4%(+24.2)#11 | 4.9%(+23.7)#721 |
| 12. | Urbank | 28.6% | 4.4%(+24.2)#12 | 4.9%(+23.7)#723 |
| 13. | Randall | 27.0% | 4.4%(+22.6)#13 | 4.9%(+22.2)#788 |
| 14. | Hollandale | 26.8% | 4.4%(+22.5)#14 | 4.9%(+22.0)#797 |
| 15. | Bigelow | 26.3% | 4.4%(+21.9)#15 | 4.9%(+21.4)#827 |
| 16. | Verndale | 25.4% | 4.4%(+21.0)#16 | 4.9%(+20.6)#873 |
| 17. | Zemple | 25.0% | 4.4%(+20.6)#17 | 4.9%(+20.1)#913 |
| 18. | Lastrup | 25.0% | 4.4%(+20.6)#18 | 4.9%(+20.1)#915 |
| 19. | Wolf Lake | 25.0% | 4.4%(+20.6)#19 | 4.9%(+20.1)#920 |
| 20. | Murdock | 23.1% | 4.4%(+18.7)#20 | 4.9%(+18.2)#1,028 |
| 21. | Atwater | 21.5% | 4.4%(+17.1)#21 | 4.9%(+16.6)#1,146 |
| 22. | Donnelly | 21.1% | 4.4%(+16.7)#22 | 4.9%(+16.2)#1,188 |
| 23. | Grove City | 20.6% | 4.4%(+16.3)#23 | 4.9%(+15.8)#1,221 |
| 24. | Finland | 20.0% | 4.4%(+15.6)#24 | 4.9%(+15.1)#1,291 |
| 25. | Kensington | 19.0% | 4.4%(+14.7)#25 | 4.9%(+14.2)#1,394 |
| 26. | Ulen | 19.0% | 4.4%(+14.6)#26 | 4.9%(+14.1)#1,402 |
| 27. | Fish Lake | 18.8% | 4.4%(+14.4)#27 | 4.9%(+13.9)#1,428 |
| 28. | Fairhaven | 17.4% | 4.4%(+13.0)#28 | 4.9%(+12.5)#1,599 |
| 29. | Silver Lake | 17.3% | 4.4%(+12.9)#29 | 4.9%(+12.4)#1,611 |
| 30. | Osage | 17.1% | 4.4%(+12.8)#30 | 4.9%(+12.3)#1,638 |
| 31. | Stewart | 16.7% | 4.4%(+12.3)#31 | 4.9%(+11.8)#1,705 |
| 32. | Badger | 16.7% | 4.4%(+12.3)#32 | 4.9%(+11.8)#1,709 |
| 33. | Geneva | 16.7% | 4.4%(+12.3)#33 | 4.9%(+11.8)#1,716 |
| 34. | Federal Dam | 16.7% | 4.4%(+12.3)#34 | 4.9%(+11.8)#1,735 |
| 35. | Sauk Centre | 16.3% | 4.4%(+11.9)#35 | 4.9%(+11.4)#1,807 |
| 36. | Butterfield | 15.6% | 4.4%(+11.2)#36 | 4.9%(+10.7)#1,936 |
| 37. | Comfrey | 15.4% | 4.4%(+11.0)#37 | 4.9%(+10.5)#1,974 |
| 38. | Villard | 15.4% | 4.4%(+11.0)#38 | 4.9%(+10.5)#1,979 |
| 39. | Hammond | 15.4% | 4.4%(+11.0)#39 | 4.9%(+10.5)#1,987 |
| 40. | Viking | 15.4% | 4.4%(+11.0)#40 | 4.9%(+10.5)#1,988 |
| 41. | Fountain | 15.1% | 4.4%(+10.7)#41 | 4.9%(+10.2)#2,031 |
| 42. | Grand Marais | 14.6% | 4.4%(+10.2)#42 | 4.9%(+9.70)#2,140 |
| 43. | Alvarado | 14.3% | 4.4%(+9.91)#43 | 4.9%(+9.41)#2,219 |
| 44. | Whipholt | 14.3% | 4.4%(+9.91)#44 | 4.9%(+9.41)#2,250 |
| 45. | Glencoe | 14.2% | 4.4%(+9.85)#45 | 4.9%(+9.36)#2,262 |
| 46. | Pillager | 14.0% | 4.4%(+9.66)#46 | 4.9%(+9.16)#2,294 |
| 47. | Bovey | 13.8% | 4.4%(+9.47)#47 | 4.9%(+8.97)#2,346 |
| 48. | Kennedy | 13.8% | 4.4%(+9.42)#48 | 4.9%(+8.92)#2,364 |
| 49. | Sacred Heart | 13.6% | 4.4%(+9.26)#49 | 4.9%(+8.76)#2,404 |
| 50. | Milan | 13.6% | 4.4%(+9.26)#50 | 4.9%(+8.76)#2,412 |
| 51. | Willernie | 13.5% | 4.4%(+9.11)#51 | 4.9%(+8.62)#2,455 |
| 52. | Warroad | 13.4% | 4.4%(+9.04)#52 | 4.9%(+8.55)#2,480 |
| 53. | Ogilvie | 13.3% | 4.4%(+8.96)#53 | 4.9%(+8.46)#2,509 |
| 54. | Greenbush | 13.1% | 4.4%(+8.71)#54 | 4.9%(+8.21)#2,585 |
| 55. | Upsala | 12.8% | 4.4%(+8.39)#55 | 4.9%(+7.89)#2,683 |
| 56. | Ruthton | 12.5% | 4.4%(+8.12)#56 | 4.9%(+7.63)#2,786 |
| 57. | Watson | 12.5% | 4.4%(+8.12)#57 | 4.9%(+7.63)#2,789 |
| 58. | Kasota | 12.3% | 4.4%(+7.97)#58 | 4.9%(+7.47)#2,838 |
| 59. | Barrett | 12.1% | 4.4%(+7.74)#59 | 4.9%(+7.25)#2,919 |
| 60. | Carlton | 11.8% | 4.4%(+7.39)#60 | 4.9%(+6.89)#3,066 |
| 61. | Trimont | 11.1% | 4.4%(+6.73)#61 | 4.9%(+6.24)#3,344 |
| 62. | Dexter | 11.1% | 4.4%(+6.73)#62 | 4.9%(+6.24)#3,366 |
| 63. | Kinney | 11.1% | 4.4%(+6.73)#63 | 4.9%(+6.24)#3,382 |
| 64. | Conger | 11.1% | 4.4%(+6.73)#64 | 4.9%(+6.24)#3,385 |
| 65. | Dilworth | 10.9% | 4.4%(+6.52)#65 | 4.9%(+6.03)#3,481 |
| 66. | Lewiston | 10.8% | 4.4%(+6.47)#66 | 4.9%(+5.97)#3,512 |
| 67. | Glenville | 10.8% | 4.4%(+6.39)#67 | 4.9%(+5.90)#3,555 |
| 68. | Searles | 10.7% | 4.4%(+6.34)#68 | 4.9%(+5.84)#3,576 |
| 69. | Warba | 10.5% | 4.4%(+6.15)#69 | 4.9%(+5.65)#3,702 |
| 70. | Olivia | 10.4% | 4.4%(+6.07)#70 | 4.9%(+5.58)#3,735 |
| 71. | Wells | 10.3% | 4.4%(+5.94)#71 | 4.9%(+5.45)#3,803 |
| 72. | Prinsburg | 10.3% | 4.4%(+5.88)#72 | 4.9%(+5.38)#3,836 |
| 73. | West St Paul | 10.2% | 4.4%(+5.78)#73 | 4.9%(+5.28)#3,890 |
| 74. | Bertha | 10.1% | 4.4%(+5.77)#74 | 4.9%(+5.27)#3,896 |
| 75. | St Marys Point | 10.1% | 4.4%(+5.73)#75 | 4.9%(+5.24)#3,915 |
| 76. | Barnum | 10.0% | 4.4%(+5.62)#76 | 4.9%(+5.13)#3,988 |
| 77. | Rushmore | 10.0% | 4.4%(+5.62)#77 | 4.9%(+5.13)#3,998 |
| 78. | Mizpah | 10.0% | 4.4%(+5.62)#78 | 4.9%(+5.13)#4,022 |
| 79. | Ellsworth | 9.7% | 4.4%(+5.30)#79 | 4.9%(+4.81)#4,193 |
| 80. | Emmons | 9.7% | 4.4%(+5.30)#80 | 4.9%(+4.81)#4,199 |
| 81. | Northfield | 9.6% | 4.4%(+5.25)#81 | 4.9%(+4.75)#4,234 |
| 82. | La Prairie | 9.6% | 4.4%(+5.21)#82 | 4.9%(+4.72)#4,264 |
| 83. | Becker | 9.6% | 4.4%(+5.21)#83 | 4.9%(+4.71)#4,268 |
| 84. | Excelsior | 9.6% | 4.4%(+5.21)#84 | 4.9%(+4.71)#4,269 |
| 85. | Lakeland | 9.5% | 4.4%(+5.09)#85 | 4.9%(+4.60)#4,352 |
| 86. | Mountain Lake | 9.3% | 4.4%(+4.92)#86 | 4.9%(+4.43)#4,471 |
| 87. | Wheaton | 9.2% | 4.4%(+4.87)#87 | 4.9%(+4.38)#4,515 |
| 88. | St Peter | 9.2% | 4.4%(+4.81)#88 | 4.9%(+4.31)#4,568 |
| 89. | Littlefork | 9.1% | 4.4%(+4.71)#89 | 4.9%(+4.22)#4,637 |
| 90. | Carlos | 9.1% | 4.4%(+4.71)#90 | 4.9%(+4.22)#4,650 |
| 91. | Sanborn | 9.1% | 4.4%(+4.71)#91 | 4.9%(+4.22)#4,654 |
| 92. | Lengby | 9.1% | 4.4%(+4.71)#92 | 4.9%(+4.22)#4,684 |
| 93. | Wayzata | 8.9% | 4.4%(+4.55)#93 | 4.9%(+4.06)#4,786 |
| 94. | Grand Meadow | 8.9% | 4.4%(+4.54)#94 | 4.9%(+4.05)#4,807 |
| 95. | Moose Lake | 8.9% | 4.4%(+4.50)#95 | 4.9%(+4.00)#4,832 |
| 96. | Hancock | 8.8% | 4.4%(+4.45)#96 | 4.9%(+3.95)#4,855 |
| 97. | Aitkin | 8.8% | 4.4%(+4.43)#97 | 4.9%(+3.94)#4,876 |
| 98. | Wilton | 8.7% | 4.4%(+4.32)#98 | 4.9%(+3.82)#4,987 |
| 99. | Park Rapids | 8.5% | 4.4%(+4.16)#99 | 4.9%(+3.66)#5,109 |
| 100. | Crookston | 8.5% | 4.4%(+4.14)#100 | 4.9%(+3.65)#5,121 |
Common Questions
What are the Top 10 Cities with the Highest Percentage of Population with a Degree in Liberal Arts and History in Minnesota?
Top 10 Cities with the Highest Percentage of Population with a Degree in Liberal Arts and History in Minnesota are:
What city has the Highest Percentage of Population with a Degree in Liberal Arts and History in Minnesota?
Woodstock has the Highest Percentage of Population with a Degree in Liberal Arts and History in Minnesota with 66.7%.
What is the Percentage of Population with a Degree in Liberal Arts and History in the State of Minnesota?
Percentage of Population with a Degree in Liberal Arts and History in Minnesota is 4.4%.
What is the Percentage of Population with a Degree in Liberal Arts and History in the United States?
Percentage of Population with a Degree in Liberal Arts and History in the United States is 4.9%.