Zip Codes with the Highest Percentage of Population with a Degree in Liberal Arts and History in Perris, CA
RELATED REPORTS & OPTIONS
Liberal Arts and History
Perris
Compare Zip Codes
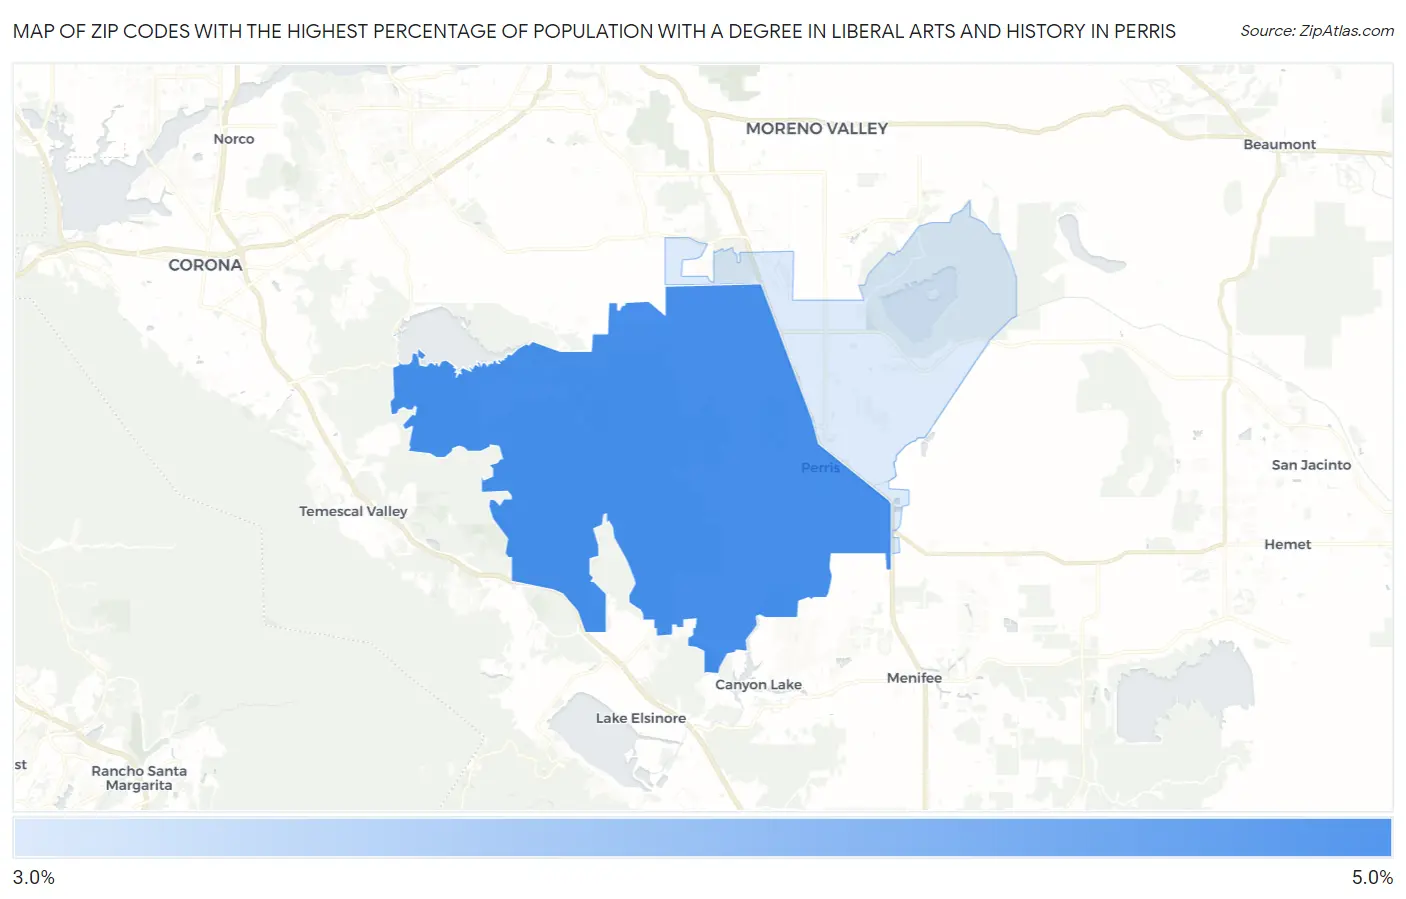
Map of Zip Codes with the Highest Percentage of Population with a Degree in Liberal Arts and History in Perris
3.9%
4.1%
Zip Codes with the Highest Percentage of Population with a Degree in Liberal Arts and History in Perris, CA
| Zip Code | % Graduates | vs State | vs National | |
| 1. | 92570 | 4.1% | 5.5%(-1.38)#1,160 | 4.9%(-0.758)#14,349 |
| 2. | 92571 | 3.9% | 5.5%(-1.56)#1,199 | 4.9%(-0.934)#15,027 |
1
Common Questions
What are the Top Zip Codes with the Highest Percentage of Population with a Degree in Liberal Arts and History in Perris, CA?
Top Zip Codes with the Highest Percentage of Population with a Degree in Liberal Arts and History in Perris, CA are:
What zip code has the Highest Percentage of Population with a Degree in Liberal Arts and History in Perris, CA?
92570 has the Highest Percentage of Population with a Degree in Liberal Arts and History in Perris, CA with 4.1%.
What is the Percentage of Population with a Degree in Liberal Arts and History in Perris, CA?
Percentage of Population with a Degree in Liberal Arts and History in Perris is 3.4%.
What is the Percentage of Population with a Degree in Liberal Arts and History in California?
Percentage of Population with a Degree in Liberal Arts and History in California is 5.5%.
What is the Percentage of Population with a Degree in Liberal Arts and History in the United States?
Percentage of Population with a Degree in Liberal Arts and History in the United States is 4.9%.