Cities with the Highest Percentage of Population with a Degree in Liberal Arts and History in New York
RELATED REPORTS & OPTIONS
Liberal Arts and History
New York
Compare Cities
Map of Cities with the Highest Percentage of Population with a Degree in Liberal Arts and History in New York
0.0%
100.0%
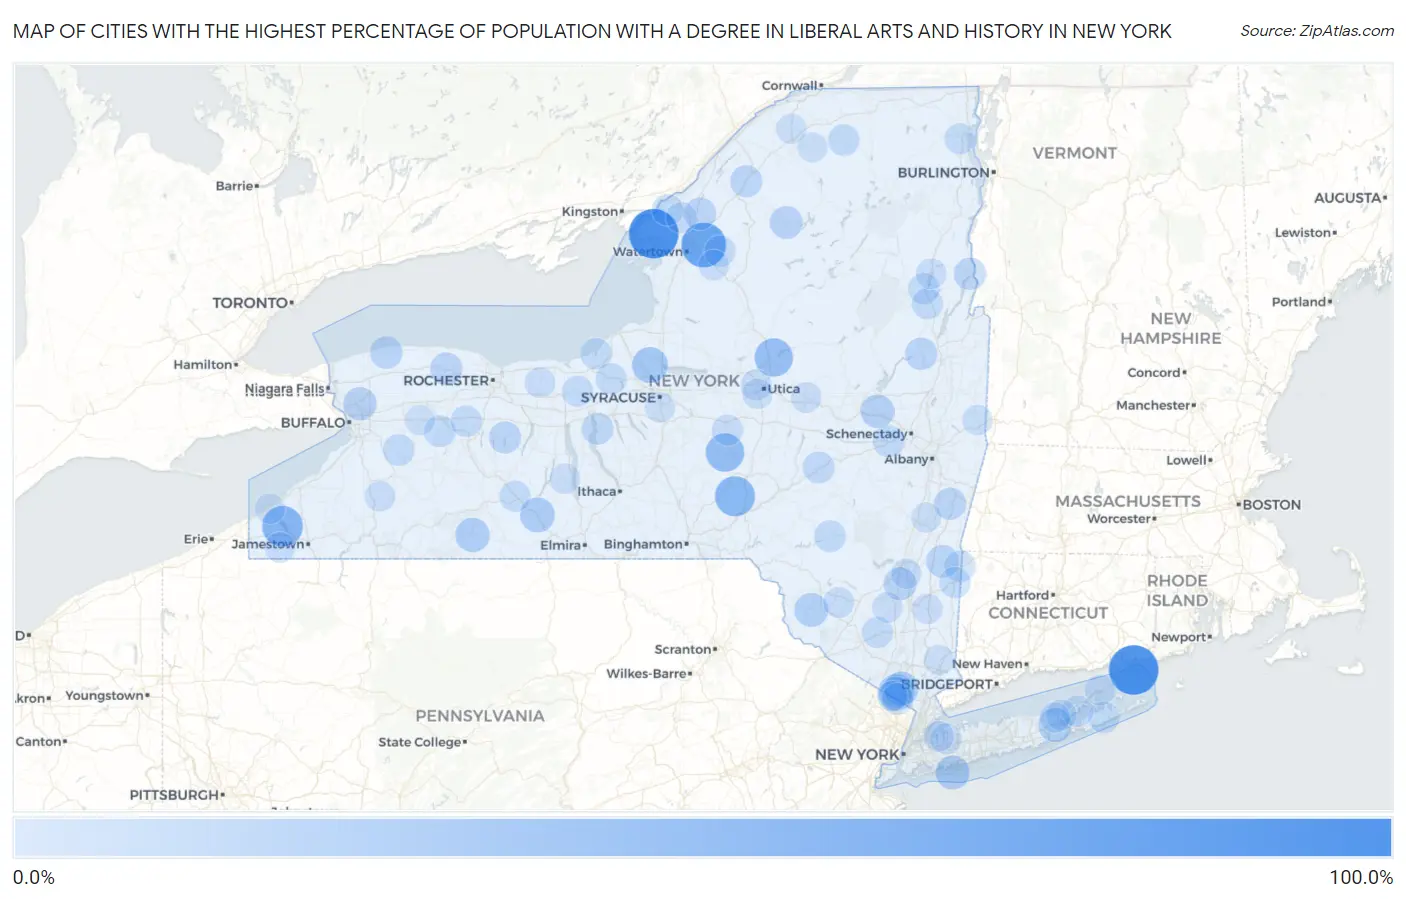
Cities with the Highest Percentage of Population with a Degree in Liberal Arts and History in New York
| City | % Graduates | vs State | vs National | |
| 1. | St. John Fisher College | 100.0% | 5.7%(+94.3)#1 | 4.9%(+95.1)#2 |
| 2. | Three Mile Bay | 100.0% | 5.7%(+94.3)#2 | 4.9%(+95.1)#67 |
| 3. | Fishers Island | 100.0% | 5.7%(+94.3)#3 | 4.9%(+95.1)#72 |
| 4. | Felts Mills | 77.8% | 5.7%(+72.1)#4 | 4.9%(+72.9)#112 |
| 5. | Copake | 76.7% | 5.7%(+71.0)#5 | 4.9%(+71.9)#113 |
| 6. | Chautauqua | 59.6% | 5.7%(+53.8)#6 | 4.9%(+54.7)#181 |
| 7. | Guilford | 56.2% | 5.7%(+50.5)#7 | 4.9%(+51.4)#192 |
| 8. | Smyrna | 50.0% | 5.7%(+44.3)#8 | 4.9%(+45.1)#251 |
| 9. | Prospect | 48.1% | 5.7%(+42.4)#9 | 4.9%(+43.3)#285 |
| 10. | Barrytown | 41.7% | 5.7%(+35.9)#10 | 4.9%(+36.8)#360 |
| 11. | North Granville | 40.0% | 5.7%(+34.3)#11 | 4.9%(+35.1)#375 |
| 12. | Kaser | 38.9% | 5.7%(+33.2)#12 | 4.9%(+34.0)#398 |
| 13. | Sand Ridge | 37.6% | 5.7%(+31.9)#13 | 4.9%(+32.8)#415 |
| 14. | Hamilton College | 33.3% | 5.7%(+27.6)#14 | 4.9%(+28.5)#517 |
| 15. | Portlandville | 33.3% | 5.7%(+27.6)#15 | 4.9%(+28.5)#543 |
| 16. | Savona | 33.0% | 5.7%(+27.2)#16 | 4.9%(+28.1)#569 |
| 17. | New Square | 31.4% | 5.7%(+25.7)#17 | 4.9%(+26.6)#612 |
| 18. | Hartwick Seminary | 31.2% | 5.7%(+25.5)#18 | 4.9%(+26.4)#621 |
| 19. | Andover | 30.5% | 5.7%(+24.8)#19 | 4.9%(+25.7)#640 |
| 20. | Point Lookout | 30.0% | 5.7%(+24.3)#20 | 4.9%(+25.1)#663 |
| 21. | Smallwood | 29.2% | 5.7%(+23.5)#21 | 4.9%(+24.3)#690 |
| 22. | Riverside | 28.8% | 5.7%(+23.1)#22 | 4.9%(+24.0)#699 |
| 23. | Fort Johnson | 27.4% | 5.7%(+21.7)#23 | 4.9%(+22.5)#766 |
| 24. | Wells Bridge | 27.3% | 5.7%(+21.6)#24 | 4.9%(+22.4)#774 |
| 25. | University At Buffalo | 26.5% | 5.7%(+20.8)#25 | 4.9%(+21.6)#817 |
| 26. | Kauneonga Lake | 26.0% | 5.7%(+20.3)#26 | 4.9%(+21.2)#843 |
| 27. | Brooktondale | 25.6% | 5.7%(+19.9)#27 | 4.9%(+20.8)#864 |
| 28. | Star Lake | 25.0% | 5.7%(+19.3)#28 | 4.9%(+20.1)#890 |
| 29. | Upper Red Hook | 25.0% | 5.7%(+19.3)#29 | 4.9%(+20.1)#916 |
| 30. | Rifton | 24.7% | 5.7%(+19.0)#30 | 4.9%(+19.8)#929 |
| 31. | Pine Plains | 23.6% | 5.7%(+17.8)#31 | 4.9%(+18.7)#990 |
| 32. | Barker | 23.4% | 5.7%(+17.7)#32 | 4.9%(+18.6)#1,001 |
| 33. | Bard College | 23.2% | 5.7%(+17.5)#33 | 4.9%(+18.3)#1,021 |
| 34. | Theresa | 23.0% | 5.7%(+17.2)#34 | 4.9%(+18.1)#1,036 |
| 35. | Holley | 22.6% | 5.7%(+16.8)#35 | 4.9%(+17.7)#1,060 |
| 36. | Lake Luzerne | 22.4% | 5.7%(+16.6)#36 | 4.9%(+17.5)#1,071 |
| 37. | Fallsburg | 22.3% | 5.7%(+16.6)#37 | 4.9%(+17.4)#1,072 |
| 38. | Ticonderoga | 22.1% | 5.7%(+16.4)#38 | 4.9%(+17.2)#1,104 |
| 39. | Chatham | 21.7% | 5.7%(+16.0)#39 | 4.9%(+16.9)#1,128 |
| 40. | Honeoye | 21.4% | 5.7%(+15.7)#40 | 4.9%(+16.6)#1,149 |
| 41. | Richville | 21.4% | 5.7%(+15.7)#41 | 4.9%(+16.6)#1,156 |
| 42. | Union Springs | 20.5% | 5.7%(+14.7)#42 | 4.9%(+15.6)#1,228 |
| 43. | Worcester | 20.4% | 5.7%(+14.6)#43 | 4.9%(+15.5)#1,246 |
| 44. | Margaretville | 19.6% | 5.7%(+13.9)#44 | 4.9%(+14.8)#1,326 |
| 45. | Duanesburg | 19.3% | 5.7%(+13.6)#45 | 4.9%(+14.4)#1,356 |
| 46. | Strykersville | 19.3% | 5.7%(+13.6)#46 | 4.9%(+14.4)#1,358 |
| 47. | Wyoming | 19.0% | 5.7%(+13.3)#47 | 4.9%(+14.2)#1,392 |
| 48. | Fly Creek | 19.0% | 5.7%(+13.3)#48 | 4.9%(+14.1)#1,398 |
| 49. | Monsey | 18.9% | 5.7%(+13.2)#49 | 4.9%(+14.0)#1,410 |
| 50. | Chestnut Ridge | 18.8% | 5.7%(+13.1)#50 | 4.9%(+13.9)#1,419 |
| 51. | St Regis Falls | 18.8% | 5.7%(+13.0)#51 | 4.9%(+13.9)#1,425 |
| 52. | Clayton | 18.3% | 5.7%(+12.6)#52 | 4.9%(+13.4)#1,465 |
| 53. | West Carthage | 18.2% | 5.7%(+12.5)#53 | 4.9%(+13.3)#1,472 |
| 54. | Fowlerville | 18.2% | 5.7%(+12.5)#54 | 4.9%(+13.3)#1,490 |
| 55. | New Suffolk | 18.0% | 5.7%(+12.3)#55 | 4.9%(+13.1)#1,514 |
| 56. | Wainscott | 18.0% | 5.7%(+12.3)#56 | 4.9%(+13.1)#1,518 |
| 57. | Millerton | 17.9% | 5.7%(+12.2)#57 | 4.9%(+13.0)#1,527 |
| 58. | Fair Haven | 17.9% | 5.7%(+12.2)#58 | 4.9%(+13.0)#1,528 |
| 59. | Cato | 17.6% | 5.7%(+11.9)#59 | 4.9%(+12.8)#1,557 |
| 60. | Montgomery | 17.5% | 5.7%(+11.8)#60 | 4.9%(+12.6)#1,572 |
| 61. | Clyde | 17.5% | 5.7%(+11.7)#61 | 4.9%(+12.6)#1,578 |
| 62. | Pottersville | 17.4% | 5.7%(+11.7)#62 | 4.9%(+12.5)#1,604 |
| 63. | Wingdale | 17.3% | 5.7%(+11.6)#63 | 4.9%(+12.4)#1,613 |
| 64. | Chestertown | 17.3% | 5.7%(+11.6)#64 | 4.9%(+12.4)#1,615 |
| 65. | Avoca | 17.1% | 5.7%(+11.3)#65 | 4.9%(+12.2)#1,652 |
| 66. | Plattsburgh West | 17.0% | 5.7%(+11.3)#66 | 4.9%(+12.1)#1,657 |
| 67. | Amenia | 16.8% | 5.7%(+11.1)#67 | 4.9%(+11.9)#1,685 |
| 68. | Hamilton | 16.6% | 5.7%(+10.9)#68 | 4.9%(+11.8)#1,759 |
| 69. | Greenvale | 16.5% | 5.7%(+10.8)#69 | 4.9%(+11.7)#1,767 |
| 70. | Ruby | 16.3% | 5.7%(+10.5)#70 | 4.9%(+11.4)#1,804 |
| 71. | La Fargeville | 15.9% | 5.7%(+10.2)#71 | 4.9%(+11.0)#1,869 |
| 72. | Whitesboro | 15.9% | 5.7%(+10.1)#72 | 4.9%(+11.0)#1,879 |
| 73. | Woodridge | 15.5% | 5.7%(+9.73)#73 | 4.9%(+10.6)#1,952 |
| 74. | Willsboro Point | 15.2% | 5.7%(+9.45)#74 | 4.9%(+10.3)#2,017 |
| 75. | West Valley | 14.9% | 5.7%(+9.22)#75 | 4.9%(+10.1)#2,057 |
| 76. | Panama | 14.9% | 5.7%(+9.21)#76 | 4.9%(+10.1)#2,060 |
| 77. | Orient | 14.8% | 5.7%(+9.11)#77 | 4.9%(+9.95)#2,078 |
| 78. | Dundee | 14.8% | 5.7%(+9.08)#78 | 4.9%(+9.92)#2,086 |
| 79. | Marion | 14.8% | 5.7%(+9.06)#79 | 4.9%(+9.91)#2,088 |
| 80. | Schroon Lake | 14.8% | 5.7%(+9.05)#80 | 4.9%(+9.90)#2,090 |
| 81. | Northville | 14.7% | 5.7%(+9.00)#81 | 4.9%(+9.85)#2,101 |
| 82. | Little Falls | 14.6% | 5.7%(+8.87)#82 | 4.9%(+9.72)#2,129 |
| 83. | Copenhagen | 14.4% | 5.7%(+8.70)#83 | 4.9%(+9.55)#2,169 |
| 84. | Baxter Estates | 14.3% | 5.7%(+8.57)#84 | 4.9%(+9.41)#2,194 |
| 85. | Freedom Plains | 14.3% | 5.7%(+8.57)#85 | 4.9%(+9.41)#2,198 |
| 86. | Gardiner | 14.3% | 5.7%(+8.57)#86 | 4.9%(+9.41)#2,199 |
| 87. | New Hartford | 14.1% | 5.7%(+8.41)#87 | 4.9%(+9.25)#2,275 |
| 88. | Port Ewen | 14.1% | 5.7%(+8.35)#88 | 4.9%(+9.19)#2,287 |
| 89. | Airmont | 14.0% | 5.7%(+8.28)#89 | 4.9%(+9.12)#2,306 |
| 90. | Hoosick Falls | 13.9% | 5.7%(+8.20)#90 | 4.9%(+9.04)#2,326 |
| 91. | Parishville | 13.8% | 5.7%(+8.04)#91 | 4.9%(+8.89)#2,374 |
| 92. | Norwood | 13.7% | 5.7%(+7.99)#92 | 4.9%(+8.83)#2,388 |
| 93. | Alexander | 13.6% | 5.7%(+7.92)#93 | 4.9%(+8.76)#2,407 |
| 94. | Heritage Hills | 13.6% | 5.7%(+7.89)#94 | 4.9%(+8.73)#2,433 |
| 95. | Sleepy Hollow Lake | 13.6% | 5.7%(+7.86)#95 | 4.9%(+8.71)#2,436 |
| 96. | Athens | 13.4% | 5.7%(+7.72)#96 | 4.9%(+8.57)#2,469 |
| 97. | Riverhead | 13.4% | 5.7%(+7.71)#97 | 4.9%(+8.55)#2,476 |
| 98. | Hankins | 13.3% | 5.7%(+7.61)#98 | 4.9%(+8.46)#2,523 |
| 99. | Nedrow | 13.2% | 5.7%(+7.48)#99 | 4.9%(+8.33)#2,555 |
| 100. | Westfield | 13.2% | 5.7%(+7.45)#100 | 4.9%(+8.30)#2,562 |
Common Questions
What are the Top 10 Cities with the Highest Percentage of Population with a Degree in Liberal Arts and History in New York?
Top 10 Cities with the Highest Percentage of Population with a Degree in Liberal Arts and History in New York are:
#1
100.0%
#2
100.0%
#3
77.8%
#4
59.6%
#5
56.2%
#6
50.0%
#7
48.1%
#8
38.9%
#9
37.6%
#10
33.0%
What city has the Highest Percentage of Population with a Degree in Liberal Arts and History in New York?
Three Mile Bay has the Highest Percentage of Population with a Degree in Liberal Arts and History in New York with 100.0%.
What is the Percentage of Population with a Degree in Liberal Arts and History in the State of New York?
Percentage of Population with a Degree in Liberal Arts and History in New York is 5.7%.
What is the Percentage of Population with a Degree in Liberal Arts and History in the United States?
Percentage of Population with a Degree in Liberal Arts and History in the United States is 4.9%.