Cities with the Highest Percentage of Population with a Degree in Liberal Arts and History in Virginia
RELATED REPORTS & OPTIONS
Liberal Arts and History
Virginia
Compare Cities
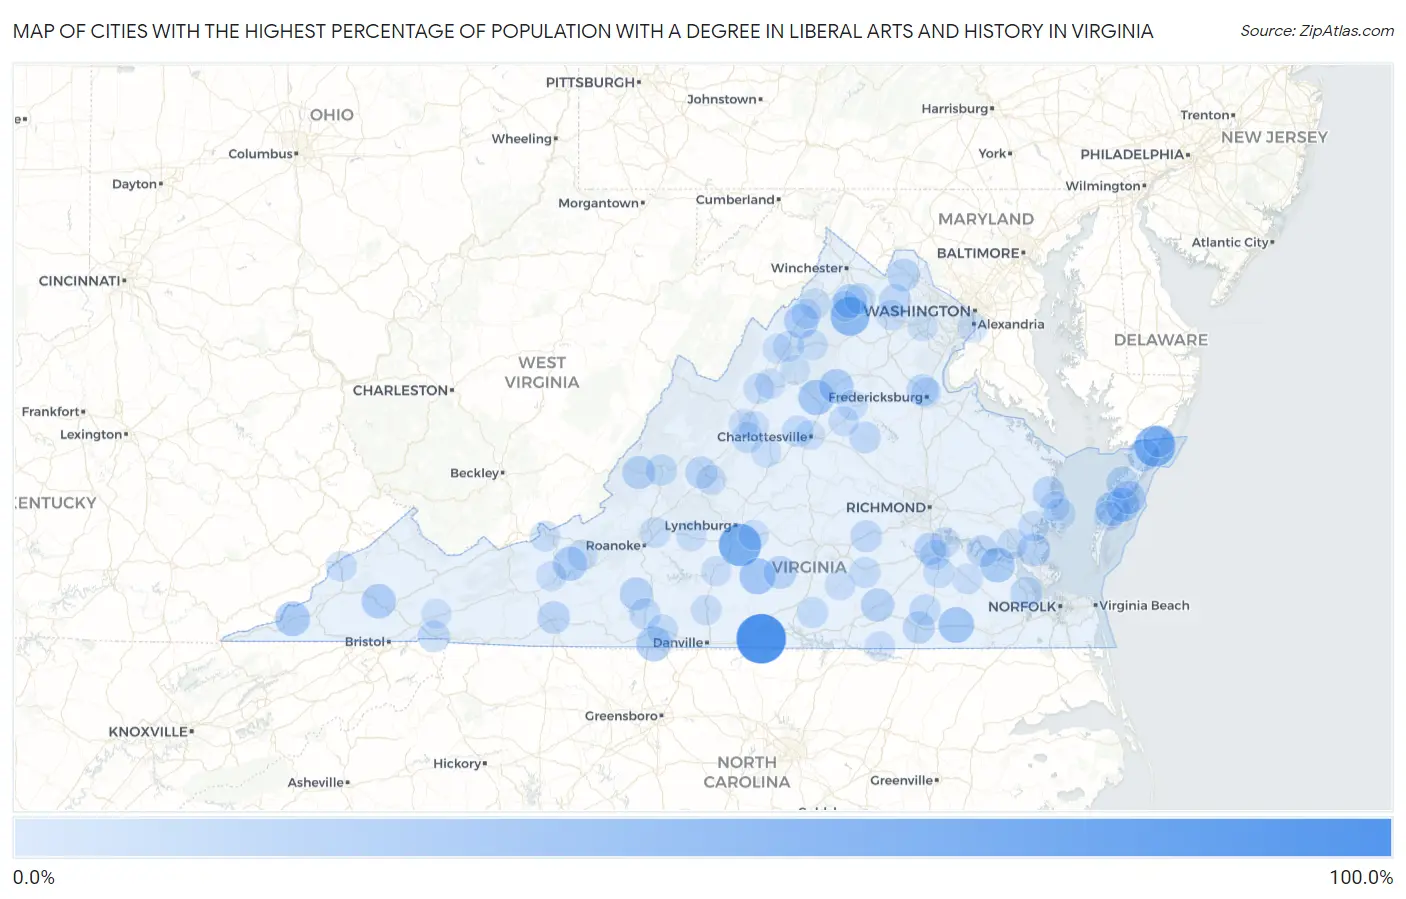
Map of Cities with the Highest Percentage of Population with a Degree in Liberal Arts and History in Virginia
0.0%
100.0%
Cities with the Highest Percentage of Population with a Degree in Liberal Arts and History in Virginia
| City | % Graduates | vs State | vs National | |
| 1. | Cluster Springs | 86.0% | 5.9%(+80.2)#1 | 4.9%(+81.1)#98 |
| 2. | The University Of Virginia's College At Wise | 63.0% | 5.9%(+57.1)#2 | 4.9%(+58.1)#155 |
| 3. | Mcdowell | 60.0% | 5.9%(+54.1)#3 | 4.9%(+55.1)#180 |
| 4. | Rustburg | 57.0% | 5.9%(+51.2)#4 | 4.9%(+52.2)#190 |
| 5. | Horntown | 50.7% | 5.9%(+44.8)#5 | 4.9%(+45.8)#221 |
| 6. | Rose Hill Cdp Lee County | 50.0% | 5.9%(+44.1)#6 | 4.9%(+45.1)#228 |
| 7. | Chester Gap | 43.7% | 5.9%(+37.8)#7 | 4.9%(+38.8)#325 |
| 8. | Upperville | 37.0% | 5.9%(+31.2)#8 | 4.9%(+32.2)#432 |
| 9. | Brookneal | 32.1% | 5.9%(+26.2)#9 | 4.9%(+27.2)#591 |
| 10. | Stickleyville | 31.2% | 5.9%(+25.4)#10 | 4.9%(+26.4)#622 |
| 11. | Capron | 30.8% | 5.9%(+24.9)#11 | 4.9%(+25.9)#634 |
| 12. | Stanardsville | 30.2% | 5.9%(+24.4)#12 | 4.9%(+25.4)#651 |
| 13. | Ridgeway | 28.0% | 5.9%(+22.1)#13 | 4.9%(+23.1)#739 |
| 14. | Pennington Gap | 27.7% | 5.9%(+21.9)#14 | 4.9%(+22.9)#751 |
| 15. | Surry | 27.3% | 5.9%(+21.4)#15 | 4.9%(+22.4)#775 |
| 16. | Madison | 26.0% | 5.9%(+20.1)#16 | 4.9%(+21.1)#849 |
| 17. | Exmore | 25.5% | 5.9%(+19.7)#17 | 4.9%(+20.6)#869 |
| 18. | Castlewood | 25.4% | 5.9%(+19.6)#18 | 4.9%(+20.6)#872 |
| 19. | Edinburg | 25.2% | 5.9%(+19.3)#19 | 4.9%(+20.3)#882 |
| 20. | New River | 24.9% | 5.9%(+19.0)#20 | 4.9%(+20.0)#927 |
| 21. | Quinby | 24.6% | 5.9%(+18.7)#21 | 4.9%(+19.7)#935 |
| 22. | Mallow | 24.3% | 5.9%(+18.5)#22 | 4.9%(+19.5)#948 |
| 23. | Shenandoah Shores | 23.7% | 5.9%(+17.8)#23 | 4.9%(+18.8)#984 |
| 24. | Wachapreague | 21.5% | 5.9%(+15.7)#24 | 4.9%(+16.7)#1,141 |
| 25. | Alberta | 21.4% | 5.9%(+15.6)#25 | 4.9%(+16.6)#1,154 |
| 26. | Covington | 20.8% | 5.9%(+14.9)#26 | 4.9%(+15.9)#1,207 |
| 27. | Ferrum | 20.7% | 5.9%(+14.9)#27 | 4.9%(+15.9)#1,212 |
| 28. | Phenix | 20.0% | 5.9%(+14.1)#28 | 4.9%(+15.1)#1,276 |
| 29. | Earlysville | 19.8% | 5.9%(+14.0)#29 | 4.9%(+15.0)#1,316 |
| 30. | Yorktown | 19.4% | 5.9%(+13.6)#30 | 4.9%(+14.5)#1,347 |
| 31. | Hamilton | 19.0% | 5.9%(+13.1)#31 | 4.9%(+14.1)#1,400 |
| 32. | Temperanceville | 18.9% | 5.9%(+13.1)#32 | 4.9%(+14.0)#1,408 |
| 33. | Hillsville | 18.9% | 5.9%(+13.0)#33 | 4.9%(+14.0)#1,412 |
| 34. | White Stone | 17.5% | 5.9%(+11.6)#34 | 4.9%(+12.6)#1,576 |
| 35. | Lexington | 17.5% | 5.9%(+11.6)#35 | 4.9%(+12.6)#1,577 |
| 36. | Onancock | 17.4% | 5.9%(+11.6)#36 | 4.9%(+12.6)#1,583 |
| 37. | Emporia | 17.3% | 5.9%(+11.4)#37 | 4.9%(+12.4)#1,612 |
| 38. | Southern Gateway | 17.0% | 5.9%(+11.2)#38 | 4.9%(+12.2)#1,653 |
| 39. | Ettrick | 16.7% | 5.9%(+10.9)#39 | 4.9%(+11.8)#1,692 |
| 40. | Woodlawn Cdp Carroll County | 16.7% | 5.9%(+10.8)#40 | 4.9%(+11.8)#1,694 |
| 41. | Claremont | 16.7% | 5.9%(+10.8)#41 | 4.9%(+11.8)#1,710 |
| 42. | Middleburg | 16.5% | 5.9%(+10.6)#42 | 4.9%(+11.6)#1,772 |
| 43. | Amelia Court House | 16.4% | 5.9%(+10.5)#43 | 4.9%(+11.5)#1,788 |
| 44. | Captains Cove | 16.2% | 5.9%(+10.3)#44 | 4.9%(+11.3)#1,813 |
| 45. | Meadowview | 16.1% | 5.9%(+10.2)#45 | 4.9%(+11.2)#1,840 |
| 46. | Benns Church | 15.8% | 5.9%(+9.93)#46 | 4.9%(+10.9)#1,890 |
| 47. | Damascus | 15.8% | 5.9%(+9.93)#47 | 4.9%(+10.9)#1,892 |
| 48. | Louisa | 15.6% | 5.9%(+9.76)#48 | 4.9%(+10.7)#1,922 |
| 49. | Oak Level | 15.2% | 5.9%(+9.30)#49 | 4.9%(+10.3)#2,024 |
| 50. | Jarratt | 14.9% | 5.9%(+9.01)#50 | 4.9%(+9.99)#2,073 |
| 51. | Ivy | 14.6% | 5.9%(+8.79)#51 | 4.9%(+9.77)#2,118 |
| 52. | Iron Gate | 14.3% | 5.9%(+8.43)#52 | 4.9%(+9.41)#2,209 |
| 53. | Chase City | 13.6% | 5.9%(+7.78)#53 | 4.9%(+8.76)#2,401 |
| 54. | Chatmoss | 13.5% | 5.9%(+7.63)#54 | 4.9%(+8.61)#2,457 |
| 55. | Blackstone | 13.4% | 5.9%(+7.56)#55 | 4.9%(+8.55)#2,481 |
| 56. | Templeton | 13.4% | 5.9%(+7.54)#56 | 4.9%(+8.52)#2,485 |
| 57. | Gwynn | 13.2% | 5.9%(+7.37)#57 | 4.9%(+8.36)#2,546 |
| 58. | Keezletown | 13.0% | 5.9%(+7.19)#58 | 4.9%(+8.17)#2,597 |
| 59. | Shenandoah Farms | 13.0% | 5.9%(+7.14)#59 | 4.9%(+8.13)#2,612 |
| 60. | Camp Barrett | 13.0% | 5.9%(+7.14)#60 | 4.9%(+8.12)#2,614 |
| 61. | Stuarts Draft | 12.8% | 5.9%(+6.98)#61 | 4.9%(+7.96)#2,667 |
| 62. | Pound | 12.7% | 5.9%(+6.86)#62 | 4.9%(+7.84)#2,700 |
| 63. | Front Royal | 12.6% | 5.9%(+6.73)#63 | 4.9%(+7.71)#2,734 |
| 64. | New Market | 12.6% | 5.9%(+6.70)#64 | 4.9%(+7.68)#2,738 |
| 65. | Laymantown | 12.4% | 5.9%(+6.54)#65 | 4.9%(+7.53)#2,820 |
| 66. | Mount Crawford | 12.3% | 5.9%(+6.45)#66 | 4.9%(+7.44)#2,853 |
| 67. | Prices Fork | 12.0% | 5.9%(+6.16)#67 | 4.9%(+7.14)#2,960 |
| 68. | Chatham | 12.0% | 5.9%(+6.13)#68 | 4.9%(+7.11)#2,985 |
| 69. | Williamsburg | 12.0% | 5.9%(+6.11)#69 | 4.9%(+7.10)#2,991 |
| 70. | Gloucester Courthouse | 11.9% | 5.9%(+6.01)#70 | 4.9%(+6.99)#3,033 |
| 71. | Luray | 11.8% | 5.9%(+5.96)#71 | 4.9%(+6.95)#3,052 |
| 72. | Toms Brook | 11.8% | 5.9%(+5.91)#72 | 4.9%(+6.89)#3,075 |
| 73. | Narrows | 11.6% | 5.9%(+5.79)#73 | 4.9%(+6.77)#3,131 |
| 74. | Petersburg | 11.6% | 5.9%(+5.76)#74 | 4.9%(+6.75)#3,146 |
| 75. | The Plains | 11.5% | 5.9%(+5.68)#75 | 4.9%(+6.67)#3,173 |
| 76. | Waverly | 11.4% | 5.9%(+5.52)#76 | 4.9%(+6.51)#3,232 |
| 77. | Orange | 11.0% | 5.9%(+5.17)#77 | 4.9%(+6.16)#3,416 |
| 78. | Nellysford | 11.0% | 5.9%(+5.10)#78 | 4.9%(+6.09)#3,452 |
| 79. | Gordonsville | 10.9% | 5.9%(+5.07)#79 | 4.9%(+6.05)#3,466 |
| 80. | Victoria | 10.8% | 5.9%(+4.94)#80 | 4.9%(+5.93)#3,543 |
| 81. | Pulaski | 10.7% | 5.9%(+4.80)#81 | 4.9%(+5.78)#3,600 |
| 82. | Fishersville | 10.6% | 5.9%(+4.78)#82 | 4.9%(+5.77)#3,613 |
| 83. | Belle Haven | 10.6% | 5.9%(+4.78)#83 | 4.9%(+5.76)#3,614 |
| 84. | Buena Vista | 10.6% | 5.9%(+4.71)#84 | 4.9%(+5.69)#3,655 |
| 85. | Massanetta Springs | 10.5% | 5.9%(+4.69)#85 | 4.9%(+5.68)#3,665 |
| 86. | Hopewell | 10.5% | 5.9%(+4.68)#86 | 4.9%(+5.67)#3,670 |
| 87. | Hurt | 10.5% | 5.9%(+4.64)#87 | 4.9%(+5.63)#3,713 |
| 88. | Gasburg | 10.4% | 5.9%(+4.58)#88 | 4.9%(+5.56)#3,747 |
| 89. | Concord | 10.4% | 5.9%(+4.56)#89 | 4.9%(+5.54)#3,751 |
| 90. | Bedford | 10.3% | 5.9%(+4.48)#90 | 4.9%(+5.46)#3,799 |
| 91. | Woodstock | 10.3% | 5.9%(+4.42)#91 | 4.9%(+5.40)#3,821 |
| 92. | Jolivue | 9.9% | 5.9%(+4.02)#92 | 4.9%(+5.00)#4,063 |
| 93. | Falmouth | 9.9% | 5.9%(+4.01)#93 | 4.9%(+4.99)#4,069 |
| 94. | Deltaville | 9.8% | 5.9%(+3.97)#94 | 4.9%(+4.95)#4,091 |
| 95. | Timberville | 9.7% | 5.9%(+3.84)#95 | 4.9%(+4.82)#4,177 |
| 96. | Sudley | 9.6% | 5.9%(+3.78)#96 | 4.9%(+4.76)#4,227 |
| 97. | Charlottesville | 9.6% | 5.9%(+3.77)#97 | 4.9%(+4.76)#4,231 |
| 98. | Nassawadox | 9.6% | 5.9%(+3.76)#98 | 4.9%(+4.74)#4,243 |
| 99. | Shenandoah | 9.6% | 5.9%(+3.73)#99 | 4.9%(+4.72)#4,260 |
| 100. | Glade Spring | 9.5% | 5.9%(+3.68)#100 | 4.9%(+4.66)#4,294 |
Common Questions
What are the Top 10 Cities with the Highest Percentage of Population with a Degree in Liberal Arts and History in Virginia?
Top 10 Cities with the Highest Percentage of Population with a Degree in Liberal Arts and History in Virginia are:
#1
86.0%
#2
57.0%
#3
50.7%
#4
43.7%
#5
32.1%
#6
30.8%
#7
30.2%
#8
28.0%
#9
27.7%
#10
27.3%
What city has the Highest Percentage of Population with a Degree in Liberal Arts and History in Virginia?
Cluster Springs has the Highest Percentage of Population with a Degree in Liberal Arts and History in Virginia with 86.0%.
What is the Percentage of Population with a Degree in Liberal Arts and History in the State of Virginia?
Percentage of Population with a Degree in Liberal Arts and History in Virginia is 5.9%.
What is the Percentage of Population with a Degree in Liberal Arts and History in the United States?
Percentage of Population with a Degree in Liberal Arts and History in the United States is 4.9%.