Del Rey, CA Map & Demographics
Del Rey Map
Del Rey Overview
$17,196
PER CAPITA INCOME
$50,000
AVG FAMILY INCOME
$48,897
AVG HOUSEHOLD INCOME
66.0%
WAGE / INCOME GAP [ % ]
34.0¢/ $1
WAGE / INCOME GAP [ $ ]
$6,926
FAMILY INCOME DEFICIT
0.43
INEQUALITY / GINI INDEX
1,491
TOTAL POPULATION
715
MALE POPULATION
776
FEMALE POPULATION
92.14
MALES / 100 FEMALES
108.53
FEMALES / 100 MALES
30.9
MEDIAN AGE
3.8
AVG FAMILY SIZE
3.7
AVG HOUSEHOLD SIZE
694
LABOR FORCE [ PEOPLE ]
61.8%
PERCENT IN LABOR FORCE
12.1%
UNEMPLOYMENT RATE
Del Rey Zip Codes
Del Rey Area Codes
Income in Del Rey
Income Overview in Del Rey
Per Capita Income in Del Rey is $17,196, while median incomes of families and households are $50,000 and $48,897 respectively.
| Characteristic | Number | Measure |
| Per Capita Income | 1,491 | $17,196 |
| Median Family Income | 384 | $50,000 |
| Mean Family Income | 384 | $59,764 |
| Median Household Income | 399 | $48,897 |
| Mean Household Income | 399 | $59,706 |
| Income Deficit | 384 | $6,926 |
| Wage / Income Gap (%) | 1,491 | 66.03% |
| Wage / Income Gap ($) | 1,491 | 33.97¢ per $1 |
| Gini / Inequality Index | 1,491 | 0.43 |
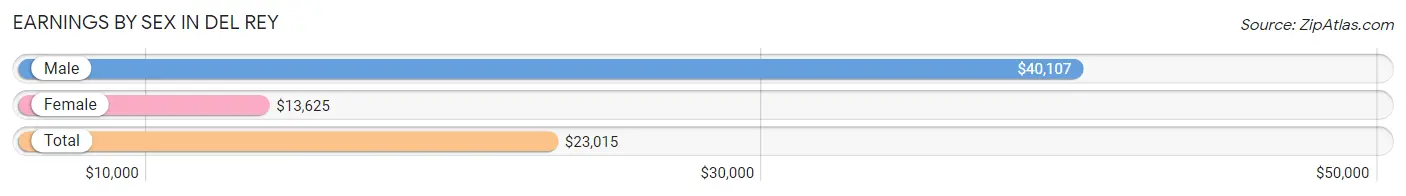
Earnings by Sex in Del Rey
Average Earnings in Del Rey are $23,015, $40,107 for men and $13,625 for women, a difference of 66.0%.
| Sex | Number | Average Earnings |
| Male | 368 (50.6%) | $40,107 |
| Female | 359 (49.4%) | $13,625 |
| Total | 727 (100.0%) | $23,015 |
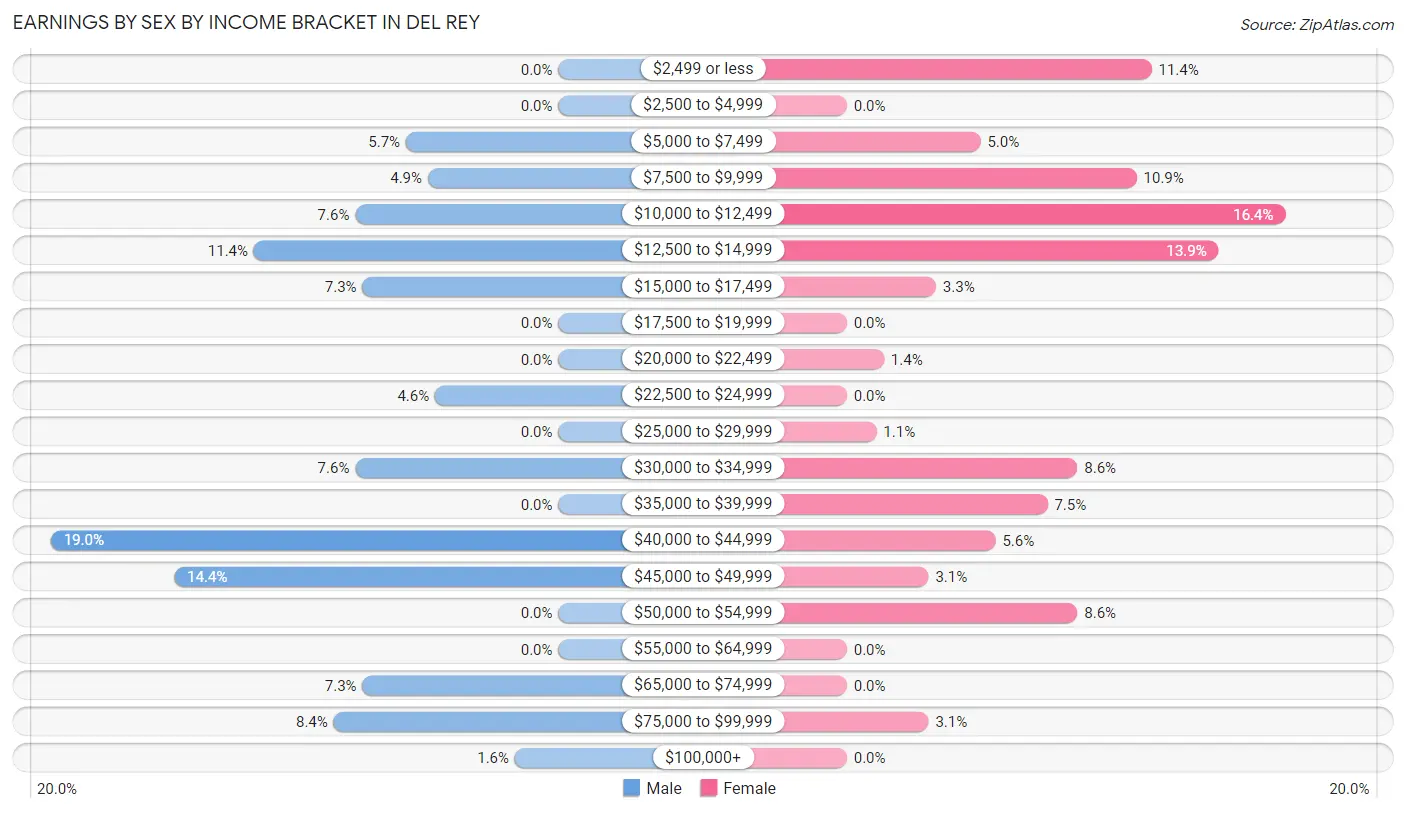
Earnings by Sex by Income Bracket in Del Rey
The most common earnings brackets in Del Rey are $40,000 to $44,999 for men (70 | 19.0%) and $10,000 to $12,499 for women (59 | 16.4%).
| Income | Male | Female |
| $2,499 or less | 0 (0.0%) | 41 (11.4%) |
| $2,500 to $4,999 | 0 (0.0%) | 0 (0.0%) |
| $5,000 to $7,499 | 21 (5.7%) | 18 (5.0%) |
| $7,500 to $9,999 | 18 (4.9%) | 39 (10.9%) |
| $10,000 to $12,499 | 28 (7.6%) | 59 (16.4%) |
| $12,500 to $14,999 | 42 (11.4%) | 50 (13.9%) |
| $15,000 to $17,499 | 27 (7.3%) | 12 (3.3%) |
| $17,500 to $19,999 | 0 (0.0%) | 0 (0.0%) |
| $20,000 to $22,499 | 0 (0.0%) | 5 (1.4%) |
| $22,500 to $24,999 | 17 (4.6%) | 0 (0.0%) |
| $25,000 to $29,999 | 0 (0.0%) | 4 (1.1%) |
| $30,000 to $34,999 | 28 (7.6%) | 31 (8.6%) |
| $35,000 to $39,999 | 0 (0.0%) | 27 (7.5%) |
| $40,000 to $44,999 | 70 (19.0%) | 20 (5.6%) |
| $45,000 to $49,999 | 53 (14.4%) | 11 (3.1%) |
| $50,000 to $54,999 | 0 (0.0%) | 31 (8.6%) |
| $55,000 to $64,999 | 0 (0.0%) | 0 (0.0%) |
| $65,000 to $74,999 | 27 (7.3%) | 0 (0.0%) |
| $75,000 to $99,999 | 31 (8.4%) | 11 (3.1%) |
| $100,000+ | 6 (1.6%) | 0 (0.0%) |
| Total | 368 (100.0%) | 359 (100.0%) |
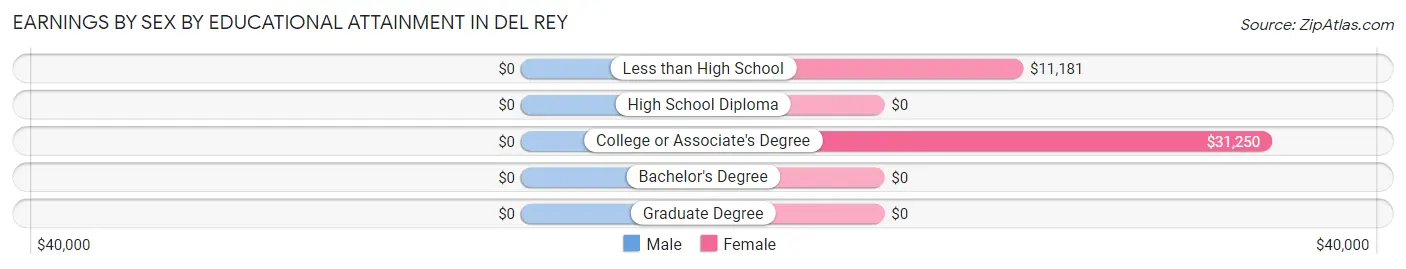
Earnings by Sex by Educational Attainment in Del Rey
| Educational Attainment | Male Income | Female Income |
| Less than High School | - | - |
| High School Diploma | - | - |
| College or Associate's Degree | - | - |
| Bachelor's Degree | - | - |
| Graduate Degree | - | - |
| Total | $40,841 | $0 |
Family Income in Del Rey
Family Income Brackets in Del Rey
According to the Del Rey family income data, there are 69 families falling into the $50,000 to $74,999 income range, which is the most common income bracket and makes up 18.0% of all families.
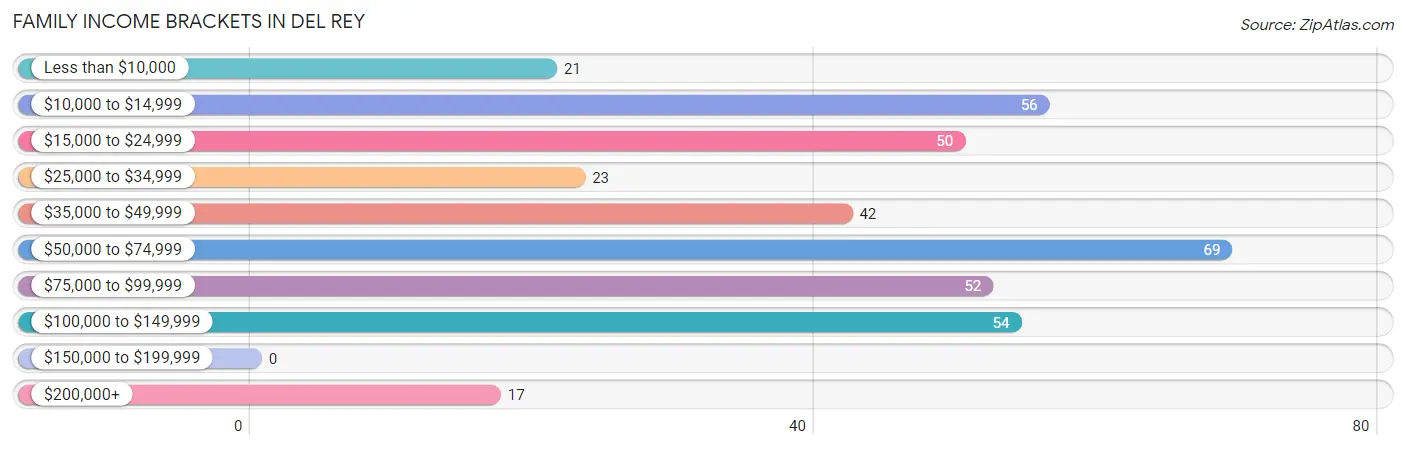
| Income Bracket | # Families | % Families |
| Less than $10,000 | 21 | 5.5% |
| $10,000 to $14,999 | 56 | 14.6% |
| $15,000 to $24,999 | 50 | 13.0% |
| $25,000 to $34,999 | 23 | 6.0% |
| $35,000 to $49,999 | 42 | 10.9% |
| $50,000 to $74,999 | 69 | 18.0% |
| $75,000 to $99,999 | 52 | 13.5% |
| $100,000 to $149,999 | 54 | 14.1% |
| $150,000 to $199,999 | 0 | 0.0% |
| $200,000+ | 17 | 4.4% |
Family Income by Famaliy Size in Del Rey
4-person families (145 | 37.8%) account for the highest median family income in Del Rey with $75,069 per family, while 4-person families (145 | 37.8%) have the highest median income of $18,767 per family member.
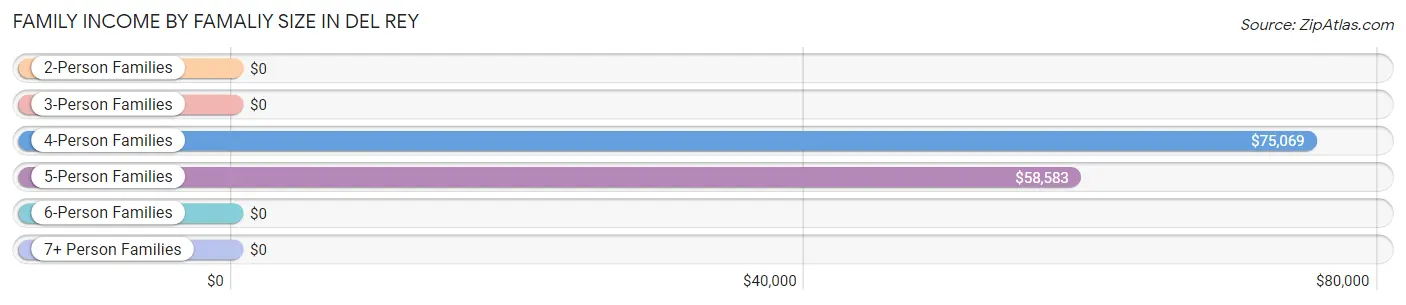
| Income Bracket | # Families | Median Income |
| 2-Person Families | 85 (22.1%) | $0 |
| 3-Person Families | 83 (21.6%) | $0 |
| 4-Person Families | 145 (37.8%) | $75,069 |
| 5-Person Families | 51 (13.3%) | $58,583 |
| 6-Person Families | 0 (0.0%) | $0 |
| 7+ Person Families | 20 (5.2%) | $0 |
| Total | 384 (100.0%) | $50,000 |
Family Income by Number of Earners in Del Rey
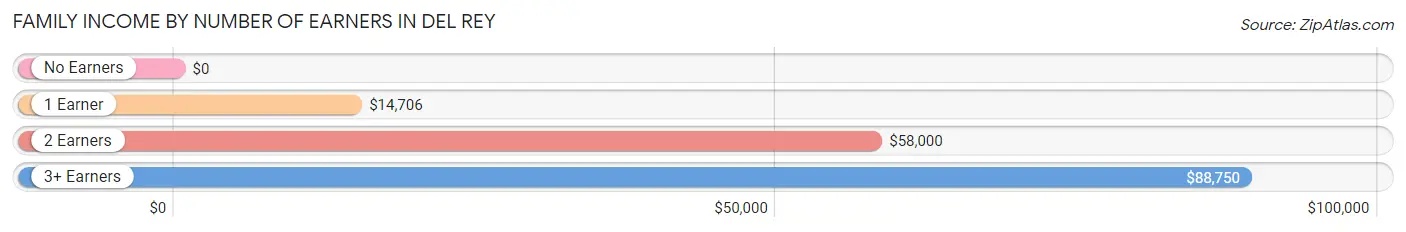
| Number of Earners | # Families | Median Income |
| No Earners | 21 (5.5%) | $0 |
| 1 Earner | 146 (38.0%) | $14,706 |
| 2 Earners | 168 (43.8%) | $58,000 |
| 3+ Earners | 49 (12.8%) | $88,750 |
| Total | 384 (100.0%) | $50,000 |
Household Income in Del Rey
Household Income Brackets in Del Rey
With 69 households falling in the category, the $50,000 to $74,999 income range is the most frequent in Del Rey, accounting for 17.3% of all households.
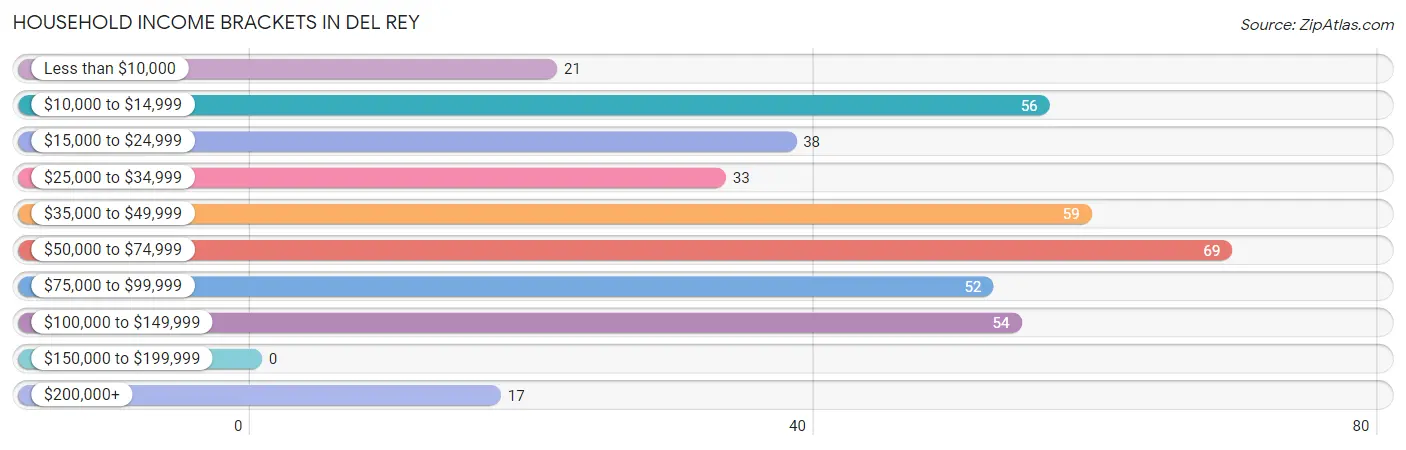
| Income Bracket | # Households | % Households |
| Less than $10,000 | 21 | 5.3% |
| $10,000 to $14,999 | 56 | 14.0% |
| $15,000 to $24,999 | 38 | 9.5% |
| $25,000 to $34,999 | 33 | 8.3% |
| $35,000 to $49,999 | 59 | 14.8% |
| $50,000 to $74,999 | 69 | 17.3% |
| $75,000 to $99,999 | 52 | 13.0% |
| $100,000 to $149,999 | 54 | 13.5% |
| $150,000 to $199,999 | 0 | 0.0% |
| $200,000+ | 17 | 4.3% |
Household Income by Householder Age in Del Rey
The median household income in Del Rey is $48,897, with the highest median household income of $58,667 found in the 45 to 64 years age bracket for the primary householder. A total of 108 households (27.1%) fall into this category. Meanwhile, the 15 to 24 years age bracket for the primary householder has the lowest median household income of $0, with 22 households (5.5%) in this group.
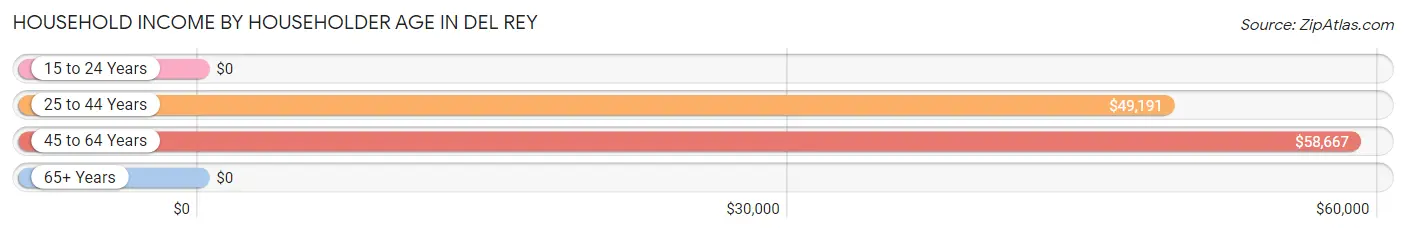
| Income Bracket | # Households | Median Income |
| 15 to 24 Years | 22 (5.5%) | $0 |
| 25 to 44 Years | 185 (46.4%) | $49,191 |
| 45 to 64 Years | 108 (27.1%) | $58,667 |
| 65+ Years | 84 (21.0%) | $0 |
| Total | 399 (100.0%) | $48,897 |
Poverty in Del Rey
Income Below Poverty by Sex and Age in Del Rey
With 26.2% poverty level for males and 30.7% for females among the residents of Del Rey, under 5 year old males and 15 year old females are the most vulnerable to poverty, with 38 males (65.5%) and 18 females (62.1%) in their respective age groups living below the poverty level.
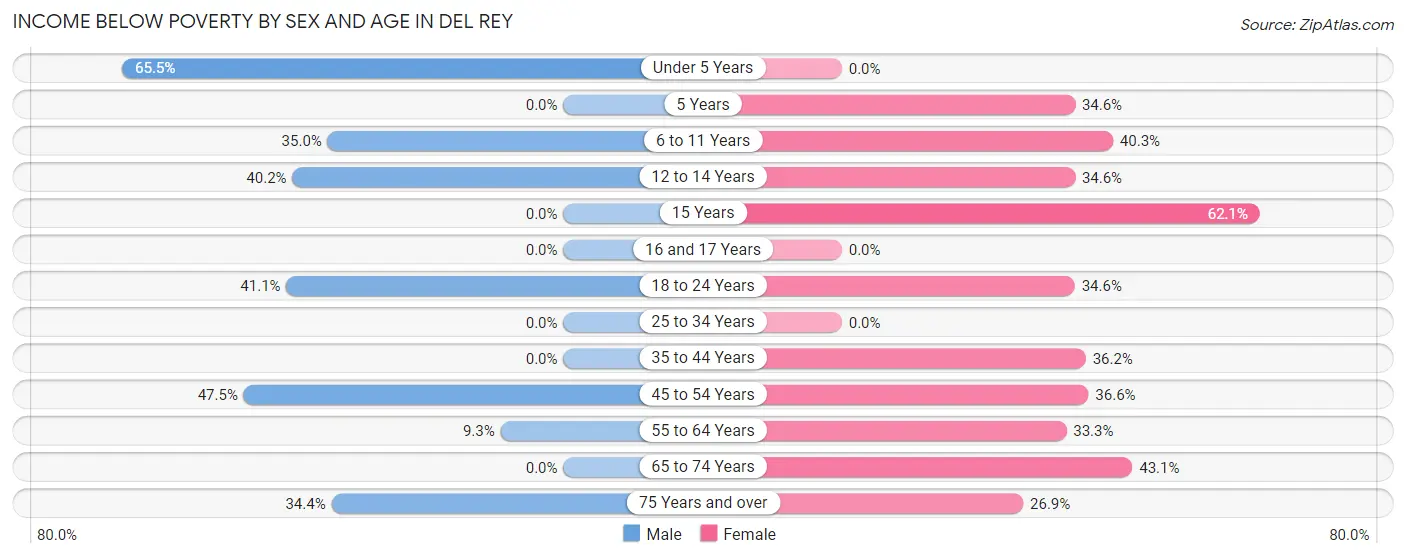
| Age Bracket | Male | Female |
| Under 5 Years | 38 (65.5%) | 0 (0.0%) |
| 5 Years | 0 (0.0%) | 9 (34.6%) |
| 6 to 11 Years | 14 (35.0%) | 31 (40.3%) |
| 12 to 14 Years | 35 (40.2%) | 9 (34.6%) |
| 15 Years | 0 (0.0%) | 18 (62.1%) |
| 16 and 17 Years | 0 (0.0%) | 0 (0.0%) |
| 18 to 24 Years | 44 (41.1%) | 46 (34.6%) |
| 25 to 34 Years | 0 (0.0%) | 0 (0.0%) |
| 35 to 44 Years | 0 (0.0%) | 46 (36.2%) |
| 45 to 54 Years | 28 (47.5%) | 26 (36.6%) |
| 55 to 64 Years | 7 (9.3%) | 17 (33.3%) |
| 65 to 74 Years | 0 (0.0%) | 22 (43.1%) |
| 75 Years and over | 21 (34.4%) | 14 (26.9%) |
| Total | 187 (26.2%) | 238 (30.7%) |
Income Above Poverty by Sex and Age in Del Rey
According to the poverty statistics in Del Rey, males aged 5 years and females aged under 5 years are the age groups that are most secure financially, with 100.0% of males and 100.0% of females in these age groups living above the poverty line.
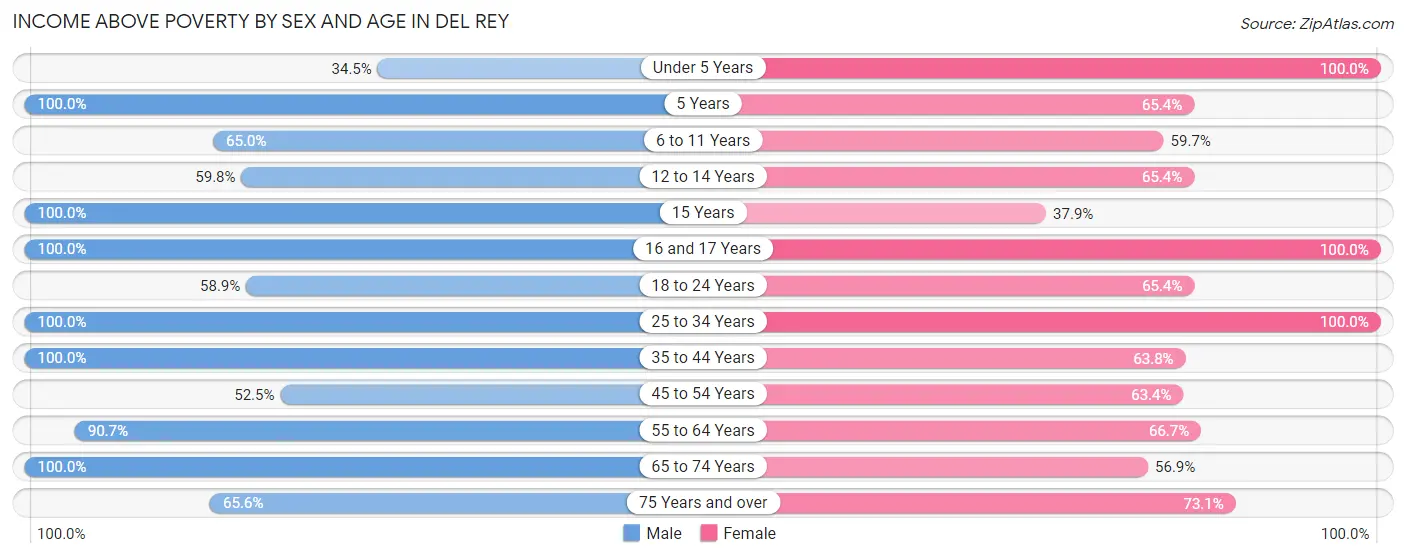
| Age Bracket | Male | Female |
| Under 5 Years | 20 (34.5%) | 8 (100.0%) |
| 5 Years | 7 (100.0%) | 17 (65.4%) |
| 6 to 11 Years | 26 (65.0%) | 46 (59.7%) |
| 12 to 14 Years | 52 (59.8%) | 17 (65.4%) |
| 15 Years | 10 (100.0%) | 11 (37.9%) |
| 16 and 17 Years | 30 (100.0%) | 26 (100.0%) |
| 18 to 24 Years | 63 (58.9%) | 87 (65.4%) |
| 25 to 34 Years | 32 (100.0%) | 99 (100.0%) |
| 35 to 44 Years | 135 (100.0%) | 81 (63.8%) |
| 45 to 54 Years | 31 (52.5%) | 45 (63.4%) |
| 55 to 64 Years | 68 (90.7%) | 34 (66.7%) |
| 65 to 74 Years | 14 (100.0%) | 29 (56.9%) |
| 75 Years and over | 40 (65.6%) | 38 (73.1%) |
| Total | 528 (73.9%) | 538 (69.3%) |
Income Below Poverty Among Married-Couple Families in Del Rey
The poverty statistics for married-couple families in Del Rey show that 23.6% or 47 of the total 199 families live below the poverty line. Families with 3 or 4 children have the highest poverty rate of 76.9%, comprising of 10 families. On the other hand, families with 1 or 2 children have the lowest poverty rate of 19.3%, which includes 16 families.
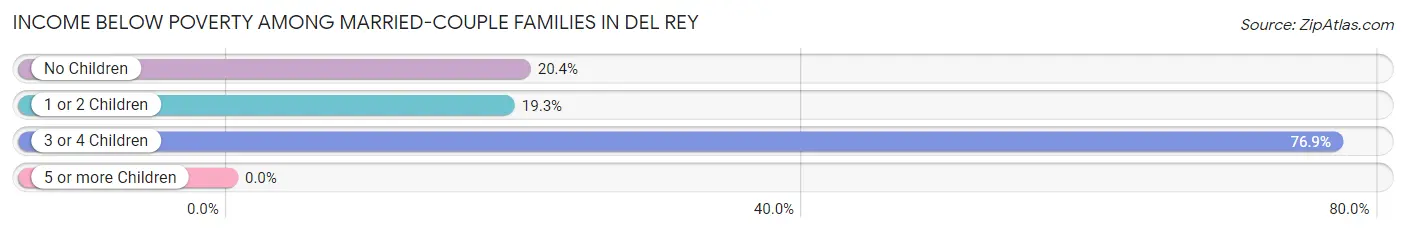
| Children | Above Poverty | Below Poverty |
| No Children | 82 (79.6%) | 21 (20.4%) |
| 1 or 2 Children | 67 (80.7%) | 16 (19.3%) |
| 3 or 4 Children | 3 (23.1%) | 10 (76.9%) |
| 5 or more Children | 0 (0.0%) | 0 (0.0%) |
| Total | 152 (76.4%) | 47 (23.6%) |
Income Below Poverty Among Single-Parent Households in Del Rey
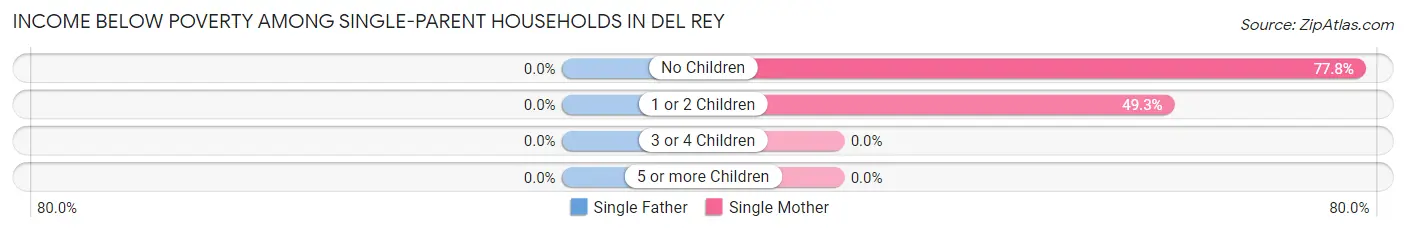
| Children | Single Father | Single Mother |
| No Children | 0 (0.0%) | 14 (77.8%) |
| 1 or 2 Children | 0 (0.0%) | 68 (49.3%) |
| 3 or 4 Children | 0 (0.0%) | 0 (0.0%) |
| 5 or more Children | 0 (0.0%) | 0 (0.0%) |
| Total | 0 (0.0%) | 82 (48.8%) |
Income Below Poverty Among Married-Couple vs Single-Parent Households in Del Rey
The poverty data for Del Rey shows that 47 of the married-couple family households (23.6%) and 82 of the single-parent households (44.3%) are living below the poverty level. Within the married-couple family households, those with 3 or 4 children have the highest poverty rate, with 10 households (76.9%) falling below the poverty line. Among the single-parent households, those with no children have the highest poverty rate, with 14 household (77.8%) living below poverty.
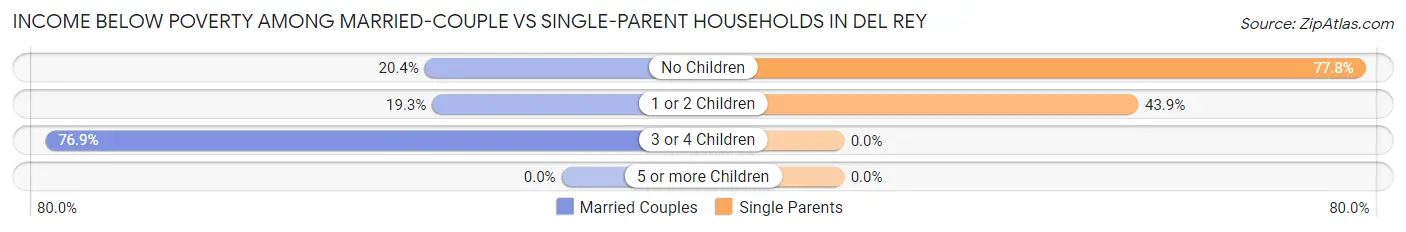
| Children | Married-Couple Families | Single-Parent Households |
| No Children | 21 (20.4%) | 14 (77.8%) |
| 1 or 2 Children | 16 (19.3%) | 68 (43.9%) |
| 3 or 4 Children | 10 (76.9%) | 0 (0.0%) |
| 5 or more Children | 0 (0.0%) | 0 (0.0%) |
| Total | 47 (23.6%) | 82 (44.3%) |
Race in Del Rey
The most populous races in Del Rey are Hispanic or Latino (1,449 | 97.2%), Some other Race (753 | 50.5%), and White / Caucasian (393 | 26.4%).
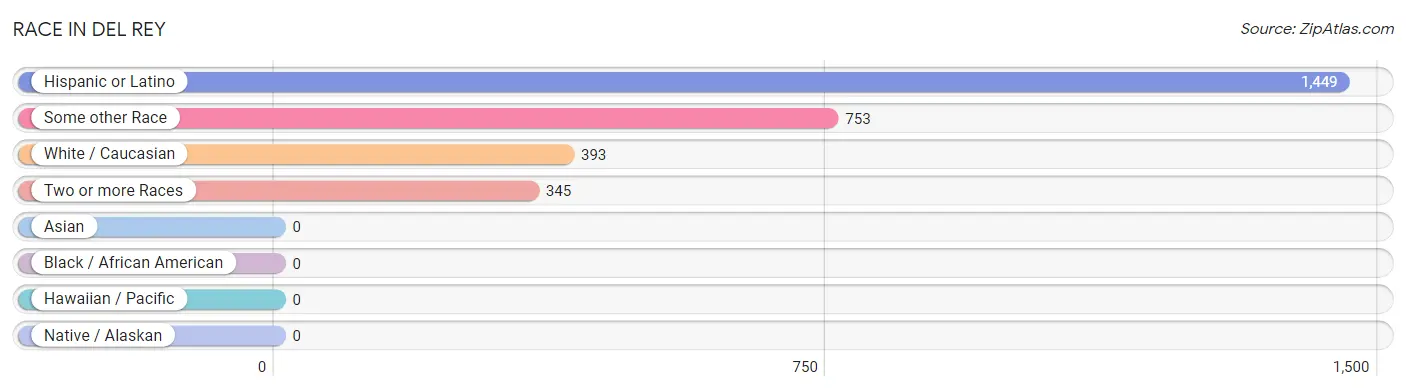
| Race | # Population | % Population |
| Asian | 0 | 0.0% |
| Black / African American | 0 | 0.0% |
| Hawaiian / Pacific | 0 | 0.0% |
| Hispanic or Latino | 1,449 | 97.2% |
| Native / Alaskan | 0 | 0.0% |
| White / Caucasian | 393 | 26.4% |
| Two or more Races | 345 | 23.1% |
| Some other Race | 753 | 50.5% |
| Total | 1,491 | 100.0% |
Ancestry in Del Rey
The most populous ancestries reported in Del Rey are Mexican (1,449 | 97.2%), Swedish (19 | 1.3%), Central American Indian (14 | 0.9%), British (13 | 0.9%), and French (13 | 0.9%), together accounting for 101.1% of all Del Rey residents.
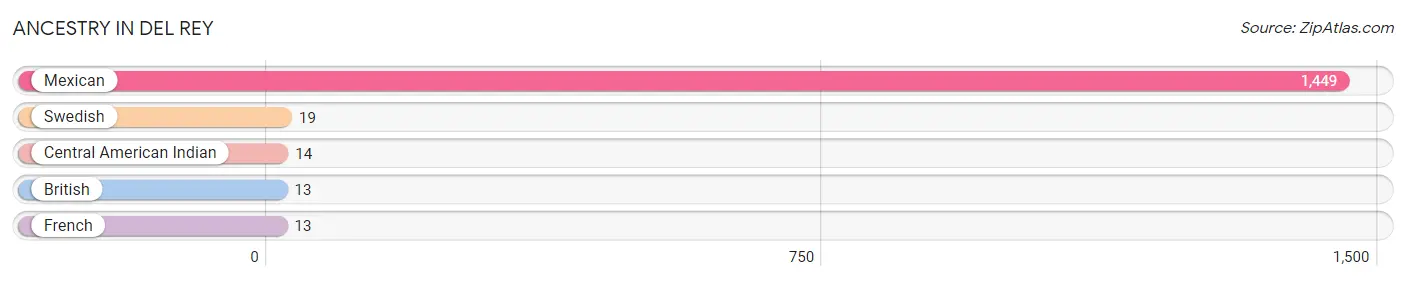
| Ancestry | # Population | % Population |
| British | 13 | 0.9% |
| Central American Indian | 14 | 0.9% |
| French | 13 | 0.9% |
| Mexican | 1,449 | 97.2% |
| Swedish | 19 | 1.3% | View All 5 Rows |
Immigrants in Del Rey
The most numerous immigrant groups reported in Del Rey came from Central America (462 | 31.0%), Latin America (462 | 31.0%), and Mexico (462 | 31.0%), together accounting for 93.0% of all Del Rey residents.
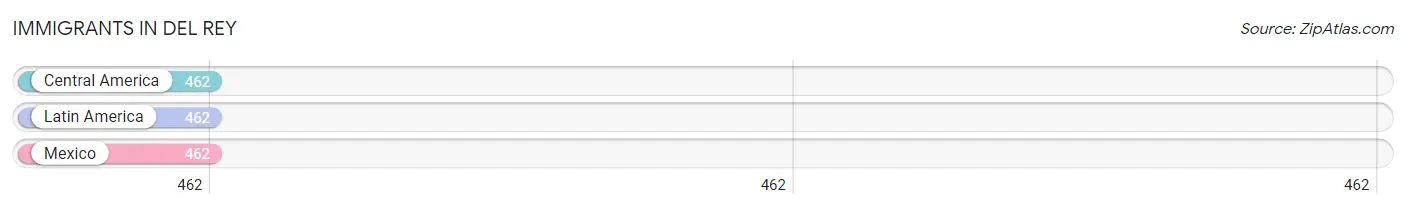
| Immigration Origin | # Population | % Population |
| Central America | 462 | 31.0% |
| Latin America | 462 | 31.0% |
| Mexico | 462 | 31.0% | View All 3 Rows |
Sex and Age in Del Rey
Sex and Age in Del Rey
The most populous age groups in Del Rey are 40 to 44 Years (117 | 16.4%) for men and 15 to 19 Years (110 | 14.2%) for women.
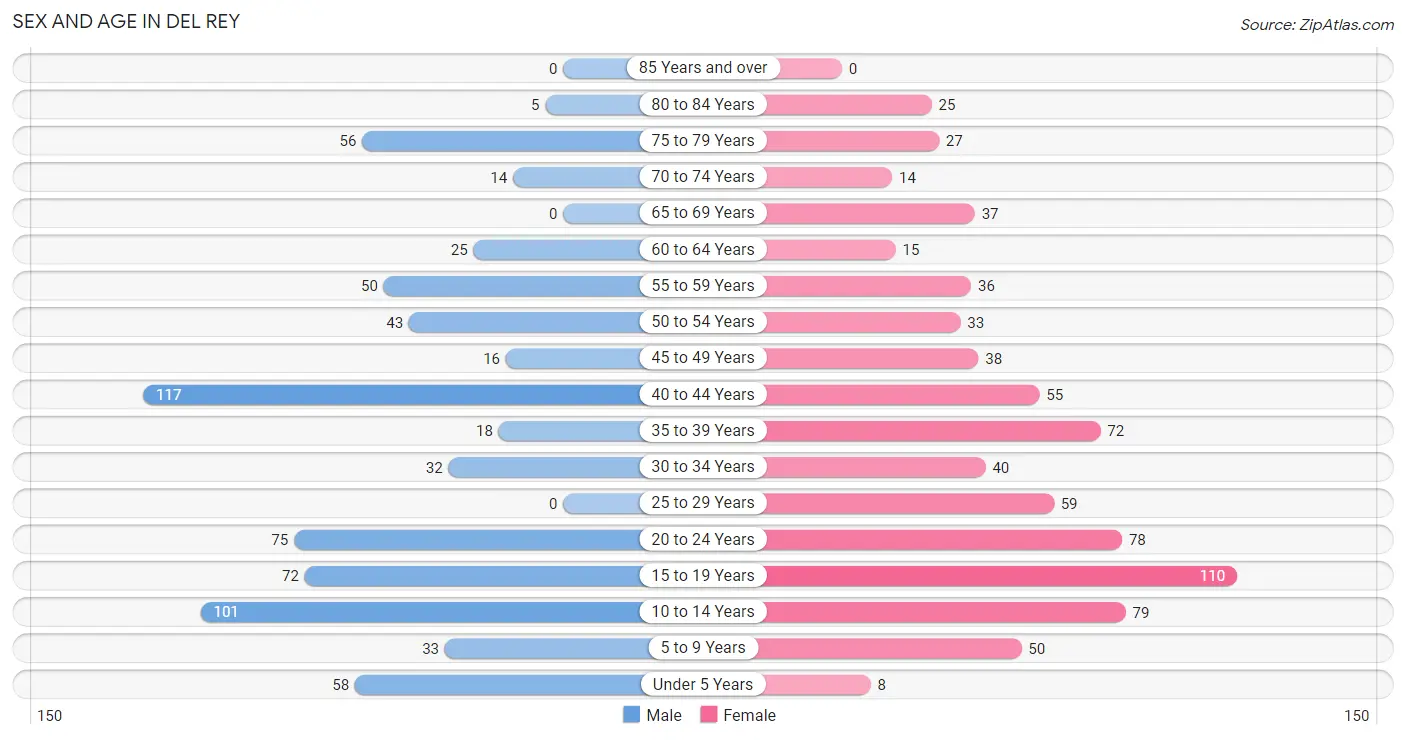
| Age Bracket | Male | Female |
| Under 5 Years | 58 (8.1%) | 8 (1.0%) |
| 5 to 9 Years | 33 (4.6%) | 50 (6.4%) |
| 10 to 14 Years | 101 (14.1%) | 79 (10.2%) |
| 15 to 19 Years | 72 (10.1%) | 110 (14.2%) |
| 20 to 24 Years | 75 (10.5%) | 78 (10.1%) |
| 25 to 29 Years | 0 (0.0%) | 59 (7.6%) |
| 30 to 34 Years | 32 (4.5%) | 40 (5.1%) |
| 35 to 39 Years | 18 (2.5%) | 72 (9.3%) |
| 40 to 44 Years | 117 (16.4%) | 55 (7.1%) |
| 45 to 49 Years | 16 (2.2%) | 38 (4.9%) |
| 50 to 54 Years | 43 (6.0%) | 33 (4.3%) |
| 55 to 59 Years | 50 (7.0%) | 36 (4.6%) |
| 60 to 64 Years | 25 (3.5%) | 15 (1.9%) |
| 65 to 69 Years | 0 (0.0%) | 37 (4.8%) |
| 70 to 74 Years | 14 (2.0%) | 14 (1.8%) |
| 75 to 79 Years | 56 (7.8%) | 27 (3.5%) |
| 80 to 84 Years | 5 (0.7%) | 25 (3.2%) |
| 85 Years and over | 0 (0.0%) | 0 (0.0%) |
| Total | 715 (100.0%) | 776 (100.0%) |
Families and Households in Del Rey
Median Family Size in Del Rey
The median family size in Del Rey is 3.79 persons per family, with married-couple families (199 | 51.8%) accounting for the largest median family size of 3.98 persons per family. On the other hand, single male/father families (17 | 4.4%) represent the smallest median family size with 1.94 persons per family.
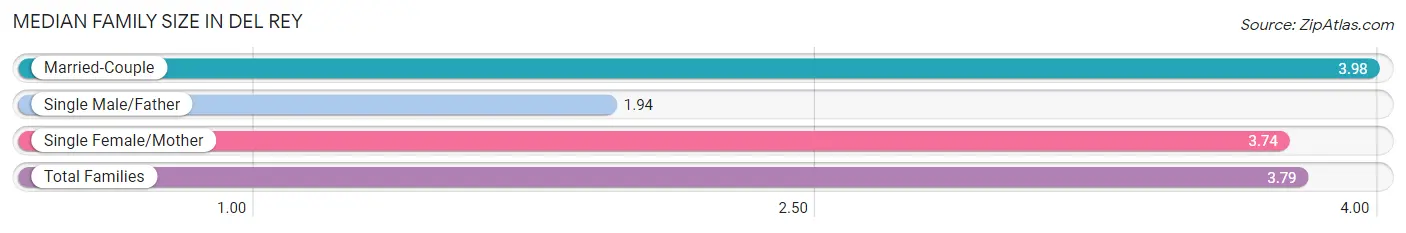
| Family Type | # Families | Family Size |
| Married-Couple | 199 (51.8%) | 3.98 |
| Single Male/Father | 17 (4.4%) | 1.94 |
| Single Female/Mother | 168 (43.8%) | 3.74 |
| Total Families | 384 (100.0%) | 3.79 |
Median Household Size in Del Rey
The median household size in Del Rey is 3.74 persons per household, with married-couple households (199 | 49.9%) accounting for the largest median household size of 3.98 persons per household. non-family households (15 | 3.8%) represent the smallest median household size with 1.47 persons per household.
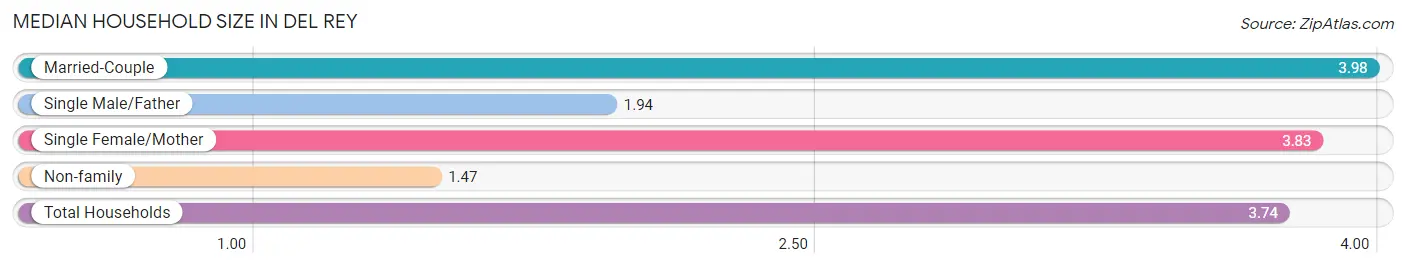
| Household Type | # Households | Household Size |
| Married-Couple | 199 (49.9%) | 3.98 |
| Single Male/Father | 17 (4.3%) | 1.94 |
| Single Female/Mother | 168 (42.1%) | 3.83 |
| Non-family | 15 (3.8%) | 1.47 |
| Total Households | 399 (100.0%) | 3.74 |
Household Size by Marriage Status in Del Rey
Out of a total of 399 households in Del Rey, 384 (96.2%) are family households, while 15 (3.8%) are nonfamily households. The most numerous type of family households are 4-person households, comprising 157, and the most common type of nonfamily households are 1-person households, comprising 10.
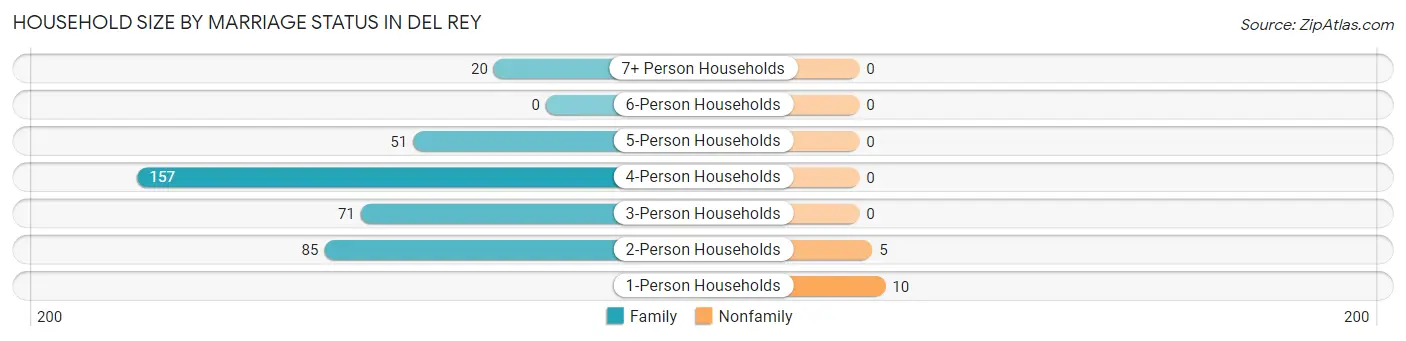
| Household Size | Family Households | Nonfamily Households |
| 1-Person Households | - | 10 (2.5%) |
| 2-Person Households | 85 (21.3%) | 5 (1.3%) |
| 3-Person Households | 71 (17.8%) | 0 (0.0%) |
| 4-Person Households | 157 (39.4%) | 0 (0.0%) |
| 5-Person Households | 51 (12.8%) | 0 (0.0%) |
| 6-Person Households | 0 (0.0%) | 0 (0.0%) |
| 7+ Person Households | 20 (5.0%) | 0 (0.0%) |
| Total | 384 (96.2%) | 15 (3.8%) |
Female Fertility in Del Rey
Fertility by Age in Del Rey
| Age Bracket | Women with Births | Births / 1,000 Women |
| 15 to 19 years | 0 (0.0%) | 0.0 |
| 20 to 34 years | 0 (0.0%) | 0.0 |
| 35 to 50 years | 0 (0.0%) | 0.0 |
| Total | 0 (0.0%) | 0.0 |
Fertility by Age by Marriage Status in Del Rey
| Age Bracket | Married | Unmarried |
| 15 to 19 years | 0 (0.0%) | 0 (0.0%) |
| 20 to 34 years | 0 (0.0%) | 0 (0.0%) |
| 35 to 50 years | 0 (0.0%) | 0 (0.0%) |
| Total | 0 (0.0%) | 0 (0.0%) |
Fertility by Education in Del Rey
| Educational Attainment | Women with Births | Births / 1,000 Women |
| Less than High School | 0 (0.0%) | 0.0 |
| High School Diploma | 0 (0.0%) | 0.0 |
| College or Associate's Degree | 0 (0.0%) | 0.0 |
| Bachelor's Degree | 0 (0.0%) | 0.0 |
| Graduate Degree | 0 (0.0%) | 0.0 |
| Total | 0 (0.0%) | 0.0 |
Fertility by Education by Marriage Status in Del Rey
| Educational Attainment | Married | Unmarried |
| Less than High School | 0 (0.0%) | 0 (0.0%) |
| High School Diploma | 0 (0.0%) | 0 (0.0%) |
| College or Associate's Degree | 0 (0.0%) | 0 (0.0%) |
| Bachelor's Degree | 0 (0.0%) | 0 (0.0%) |
| Graduate Degree | 0 (0.0%) | 0 (0.0%) |
| Total | 0 (0.0%) | 0 (0.0%) |
Employment Characteristics in Del Rey
Employment by Class of Employer in Del Rey
Among the 597 employed individuals in Del Rey, private company employees (424 | 71.0%), not-for-profit organizations (49 | 8.2%), and local government employees (46 | 7.7%) make up the most common classes of employment.
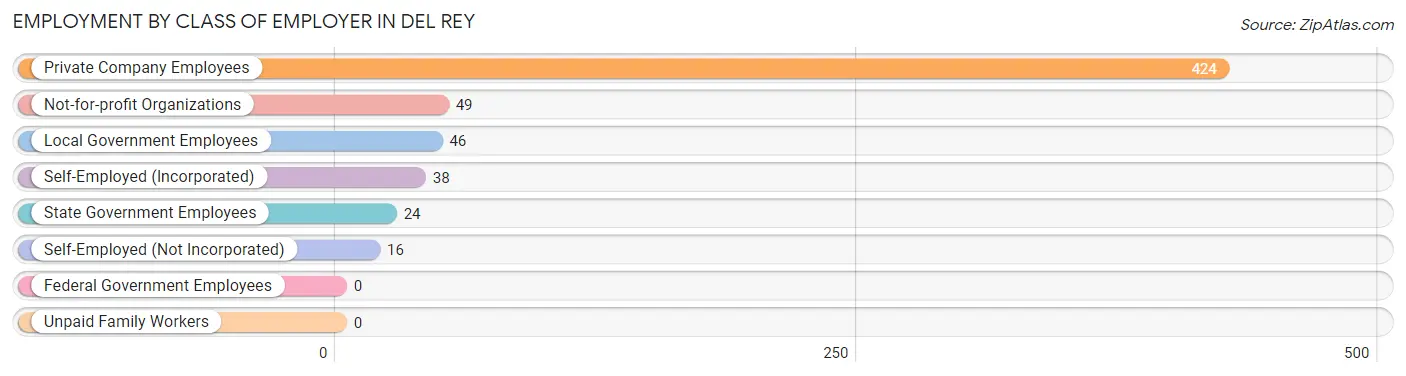
| Employer Class | # Employees | % Employees |
| Private Company Employees | 424 | 71.0% |
| Self-Employed (Incorporated) | 38 | 6.4% |
| Self-Employed (Not Incorporated) | 16 | 2.7% |
| Not-for-profit Organizations | 49 | 8.2% |
| Local Government Employees | 46 | 7.7% |
| State Government Employees | 24 | 4.0% |
| Federal Government Employees | 0 | 0.0% |
| Unpaid Family Workers | 0 | 0.0% |
| Total | 597 | 100.0% |
Employment Status by Age in Del Rey
According to the labor force statistics for Del Rey, out of the total population over 16 years of age (1,123), 61.8% or 694 individuals are in the labor force, with 12.1% or 84 of them unemployed. The age group with the highest labor force participation rate is 30 to 34 years, with 100.0% or 72 individuals in the labor force. Within the labor force, the 75 years and over age range has the highest percentage of unemployed individuals, with 100.0% or 21 of them being unemployed.
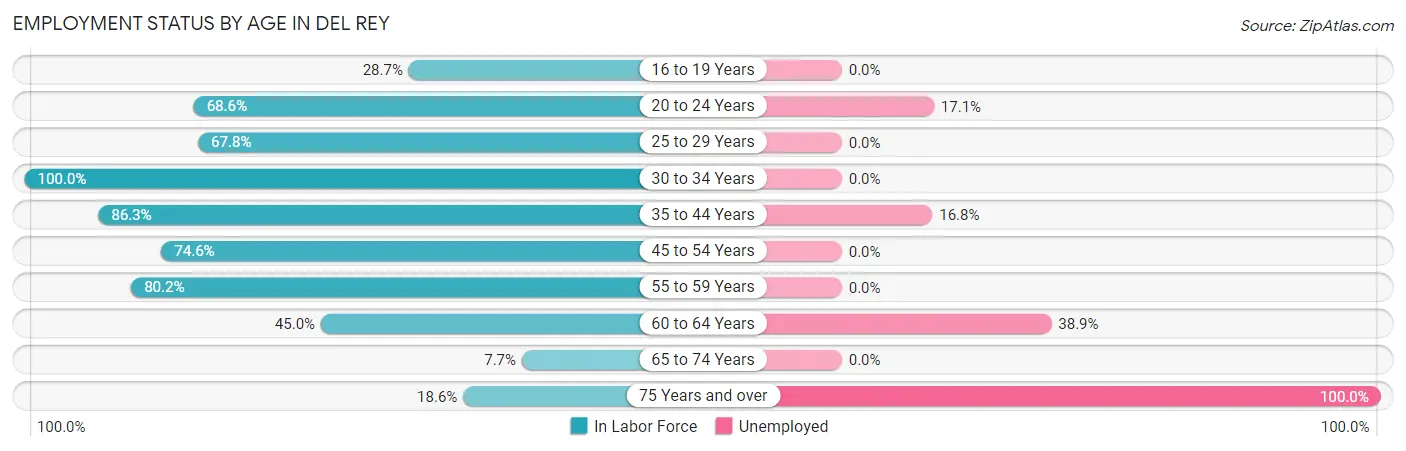
| Age Bracket | In Labor Force | Unemployed |
| 16 to 19 Years | 41 (28.7%) | 0 (0.0%) |
| 20 to 24 Years | 105 (68.6%) | 18 (17.1%) |
| 25 to 29 Years | 40 (67.8%) | 0 (0.0%) |
| 30 to 34 Years | 72 (100.0%) | 0 (0.0%) |
| 35 to 44 Years | 226 (86.3%) | 38 (16.8%) |
| 45 to 54 Years | 97 (74.6%) | 0 (0.0%) |
| 55 to 59 Years | 69 (80.2%) | 0 (0.0%) |
| 60 to 64 Years | 18 (45.0%) | 7 (38.9%) |
| 65 to 74 Years | 5 (7.7%) | 0 (0.0%) |
| 75 Years and over | 21 (18.6%) | 21 (100.0%) |
| Total | 694 (61.8%) | 84 (12.1%) |
Employment Status by Educational Attainment in Del Rey
According to labor force statistics for Del Rey, 80.4% of individuals (522) out of the total population between 25 and 64 years of age (649) are in the labor force, with 8.6% or 45 of them being unemployed. The group with the highest labor force participation rate are those with the educational attainment of bachelor's degree or higher, with 100.0% or 38 individuals in the labor force. Within the labor force, individuals with high school diploma education have the highest percentage of unemployment, with 22.6% or 45 of them being unemployed.
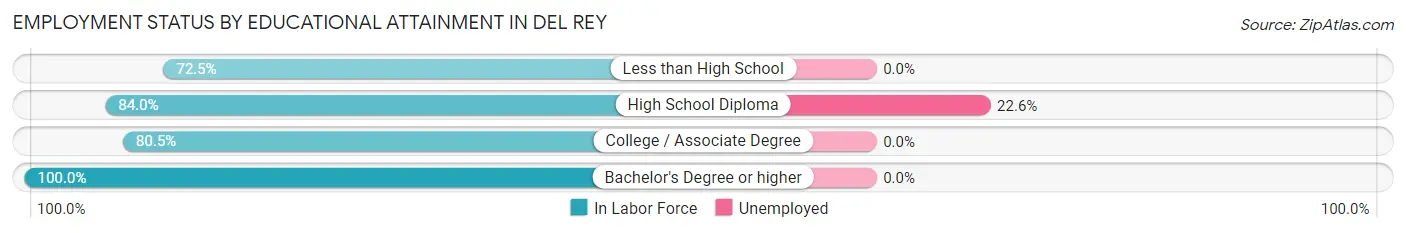
| Educational Attainment | In Labor Force | Unemployed |
| Less than High School | 145 (72.5%) | 0 (0.0%) |
| High School Diploma | 199 (84.0%) | 54 (22.6%) |
| College / Associate Degree | 140 (80.5%) | 0 (0.0%) |
| Bachelor's Degree or higher | 38 (100.0%) | 0 (0.0%) |
| Total | 522 (80.4%) | 56 (8.6%) |
Employment Occupations by Sex in Del Rey
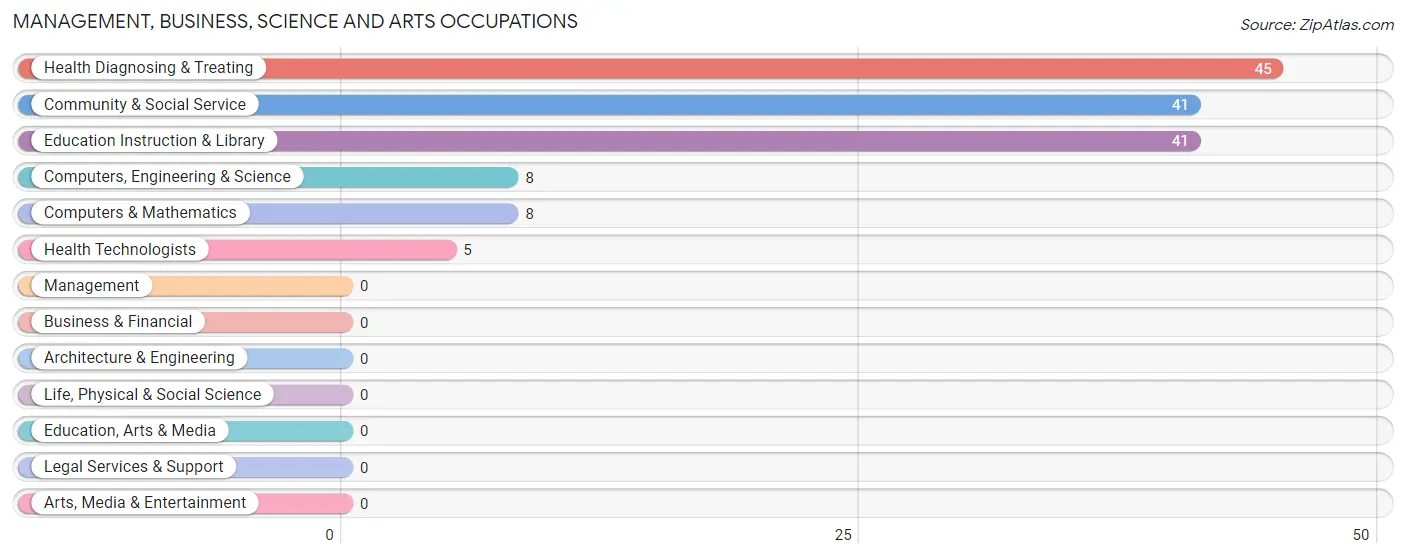
Management, Business, Science and Arts Occupations
The most common Management, Business, Science and Arts occupations in Del Rey are Health Diagnosing & Treating (45 | 7.4%), Community & Social Service (41 | 6.7%), Education Instruction & Library (41 | 6.7%), Computers, Engineering & Science (8 | 1.3%), and Computers & Mathematics (8 | 1.3%).
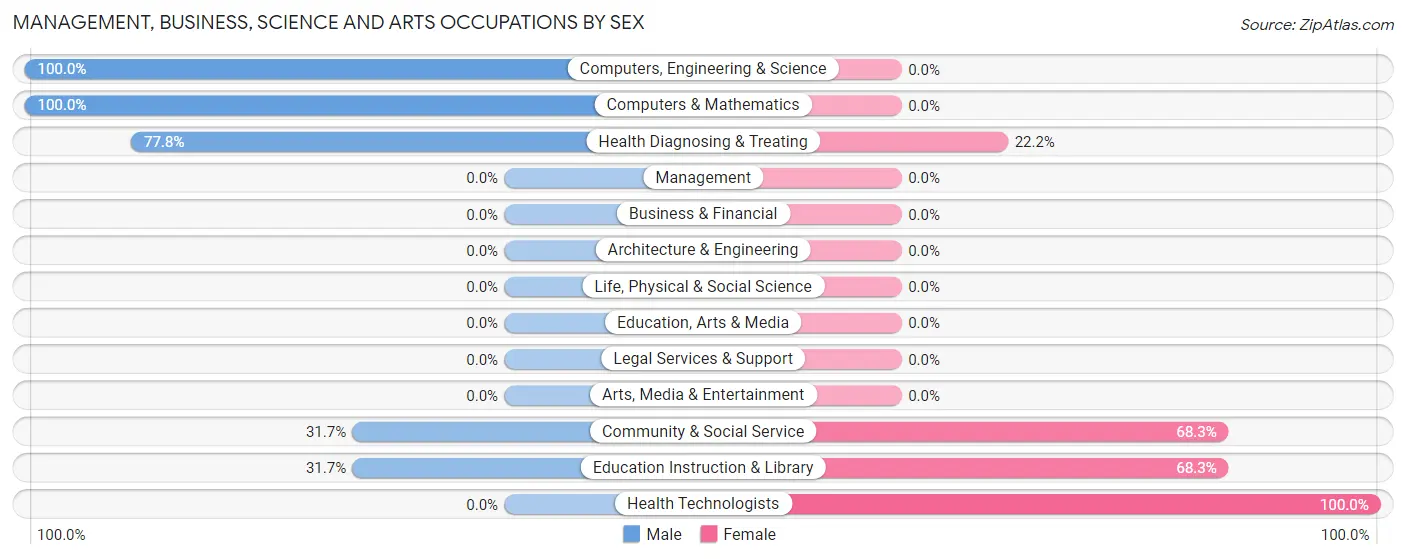
Management, Business, Science and Arts Occupations by Sex
Within the Management, Business, Science and Arts occupations in Del Rey, the most male-oriented occupations are Computers, Engineering & Science (100.0%), Computers & Mathematics (100.0%), and Health Diagnosing & Treating (77.8%), while the most female-oriented occupations are Health Technologists (100.0%), Community & Social Service (68.3%), and Education Instruction & Library (68.3%).
| Occupation | Male | Female |
| Management | 0 (0.0%) | 0 (0.0%) |
| Business & Financial | 0 (0.0%) | 0 (0.0%) |
| Computers, Engineering & Science | 8 (100.0%) | 0 (0.0%) |
| Computers & Mathematics | 8 (100.0%) | 0 (0.0%) |
| Architecture & Engineering | 0 (0.0%) | 0 (0.0%) |
| Life, Physical & Social Science | 0 (0.0%) | 0 (0.0%) |
| Community & Social Service | 13 (31.7%) | 28 (68.3%) |
| Education, Arts & Media | 0 (0.0%) | 0 (0.0%) |
| Legal Services & Support | 0 (0.0%) | 0 (0.0%) |
| Education Instruction & Library | 13 (31.7%) | 28 (68.3%) |
| Arts, Media & Entertainment | 0 (0.0%) | 0 (0.0%) |
| Health Diagnosing & Treating | 35 (77.8%) | 10 (22.2%) |
| Health Technologists | 0 (0.0%) | 5 (100.0%) |
| Total (Category) | 56 (59.6%) | 38 (40.4%) |
| Total (Overall) | 309 (50.7%) | 301 (49.3%) |
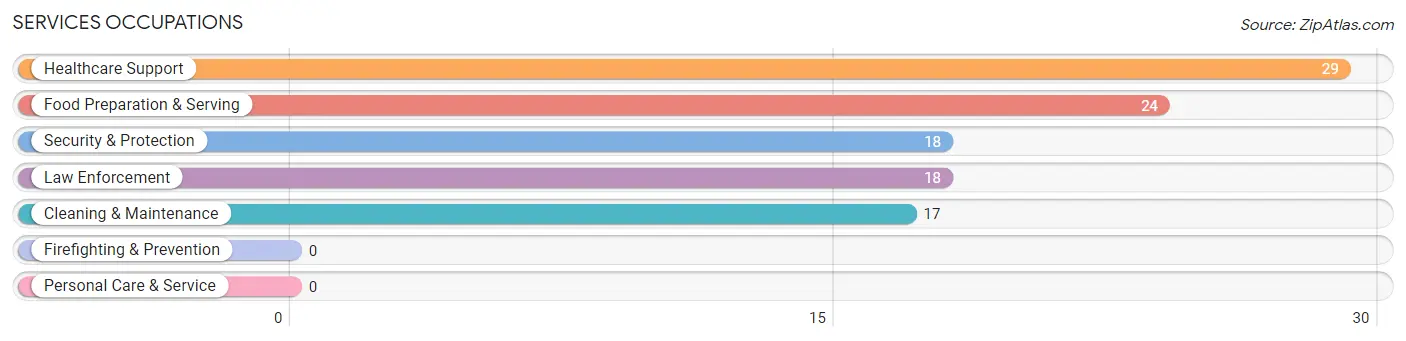
Services Occupations
The most common Services occupations in Del Rey are Healthcare Support (29 | 4.8%), Food Preparation & Serving (24 | 3.9%), Security & Protection (18 | 2.9%), Law Enforcement (18 | 2.9%), and Cleaning & Maintenance (17 | 2.8%).
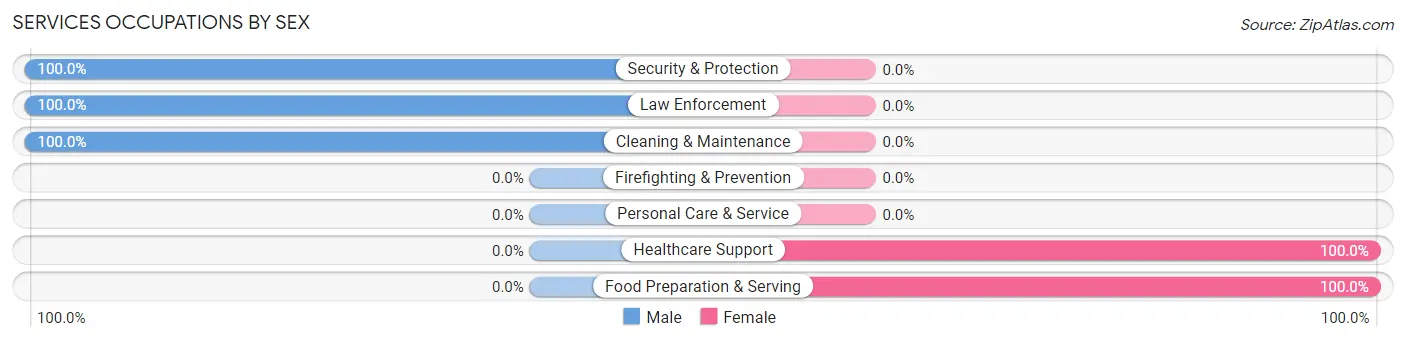
Services Occupations by Sex
Within the Services occupations in Del Rey, the most male-oriented occupations are Security & Protection (100.0%), Law Enforcement (100.0%), and Cleaning & Maintenance (100.0%), while the most female-oriented occupations are Healthcare Support (100.0%), and Food Preparation & Serving (100.0%).
| Occupation | Male | Female |
| Healthcare Support | 0 (0.0%) | 29 (100.0%) |
| Security & Protection | 18 (100.0%) | 0 (0.0%) |
| Firefighting & Prevention | 0 (0.0%) | 0 (0.0%) |
| Law Enforcement | 18 (100.0%) | 0 (0.0%) |
| Food Preparation & Serving | 0 (0.0%) | 24 (100.0%) |
| Cleaning & Maintenance | 17 (100.0%) | 0 (0.0%) |
| Personal Care & Service | 0 (0.0%) | 0 (0.0%) |
| Total (Category) | 35 (39.8%) | 53 (60.2%) |
| Total (Overall) | 309 (50.7%) | 301 (49.3%) |
Sales and Office Occupations
The most common Sales and Office occupations in Del Rey are Sales & Related (36 | 5.9%), and Office & Administration (13 | 2.1%).

Sales and Office Occupations by Sex

| Occupation | Male | Female |
| Sales & Related | 0 (0.0%) | 36 (100.0%) |
| Office & Administration | 0 (0.0%) | 13 (100.0%) |
| Total (Category) | 0 (0.0%) | 49 (100.0%) |
| Total (Overall) | 309 (50.7%) | 301 (49.3%) |
Natural Resources, Construction and Maintenance Occupations
The most common Natural Resources, Construction and Maintenance occupations in Del Rey are Farming, Fishing & Forestry (119 | 19.5%), and Construction & Extraction (33 | 5.4%).

Natural Resources, Construction and Maintenance Occupations by Sex

| Occupation | Male | Female |
| Farming, Fishing & Forestry | 85 (71.4%) | 34 (28.6%) |
| Construction & Extraction | 33 (100.0%) | 0 (0.0%) |
| Installation, Maintenance & Repair | 0 (0.0%) | 0 (0.0%) |
| Total (Category) | 118 (77.6%) | 34 (22.4%) |
| Total (Overall) | 309 (50.7%) | 301 (49.3%) |
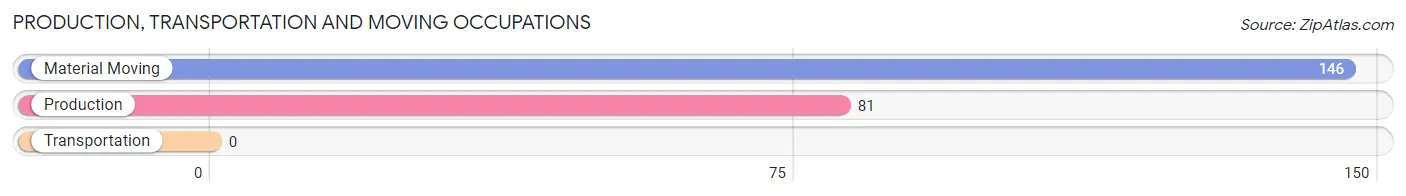
Production, Transportation and Moving Occupations
The most common Production, Transportation and Moving occupations in Del Rey are Material Moving (146 | 23.9%), and Production (81 | 13.3%).
Production, Transportation and Moving Occupations by Sex
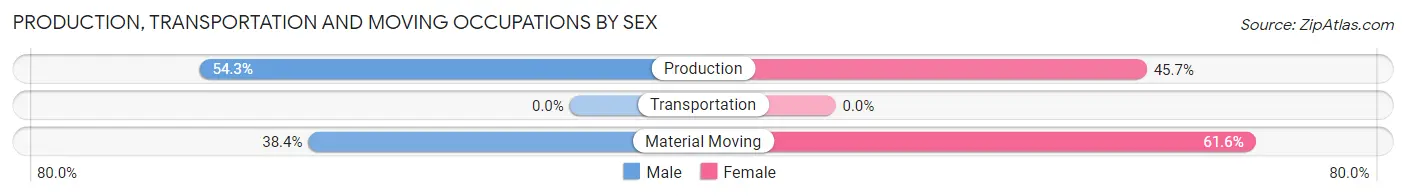
| Occupation | Male | Female |
| Production | 44 (54.3%) | 37 (45.7%) |
| Transportation | 0 (0.0%) | 0 (0.0%) |
| Material Moving | 56 (38.4%) | 90 (61.6%) |
| Total (Category) | 100 (44.1%) | 127 (55.9%) |
| Total (Overall) | 309 (50.7%) | 301 (49.3%) |
Employment Industries by Sex in Del Rey
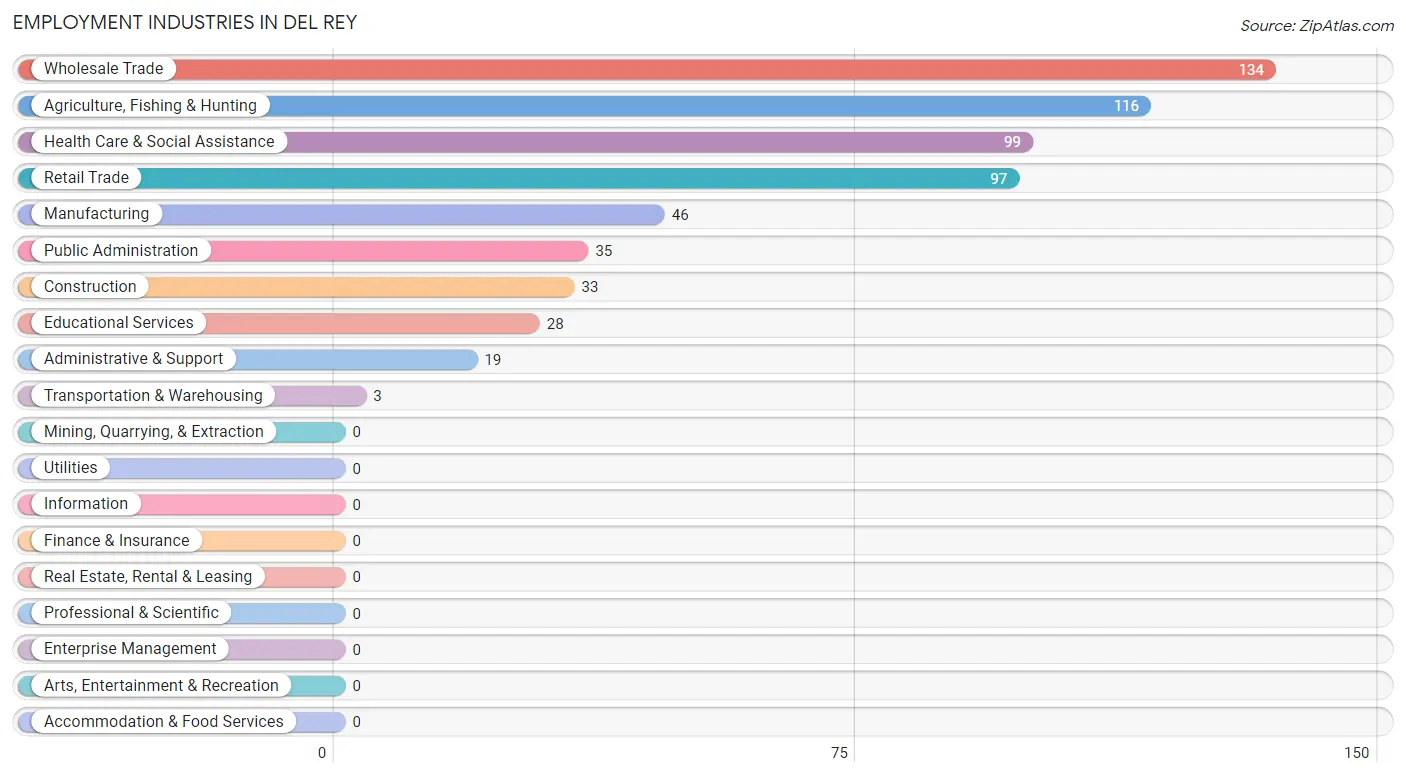
Employment Industries in Del Rey
The major employment industries in Del Rey include Wholesale Trade (134 | 22.0%), Agriculture, Fishing & Hunting (116 | 19.0%), Health Care & Social Assistance (99 | 16.2%), Retail Trade (97 | 15.9%), and Manufacturing (46 | 7.5%).
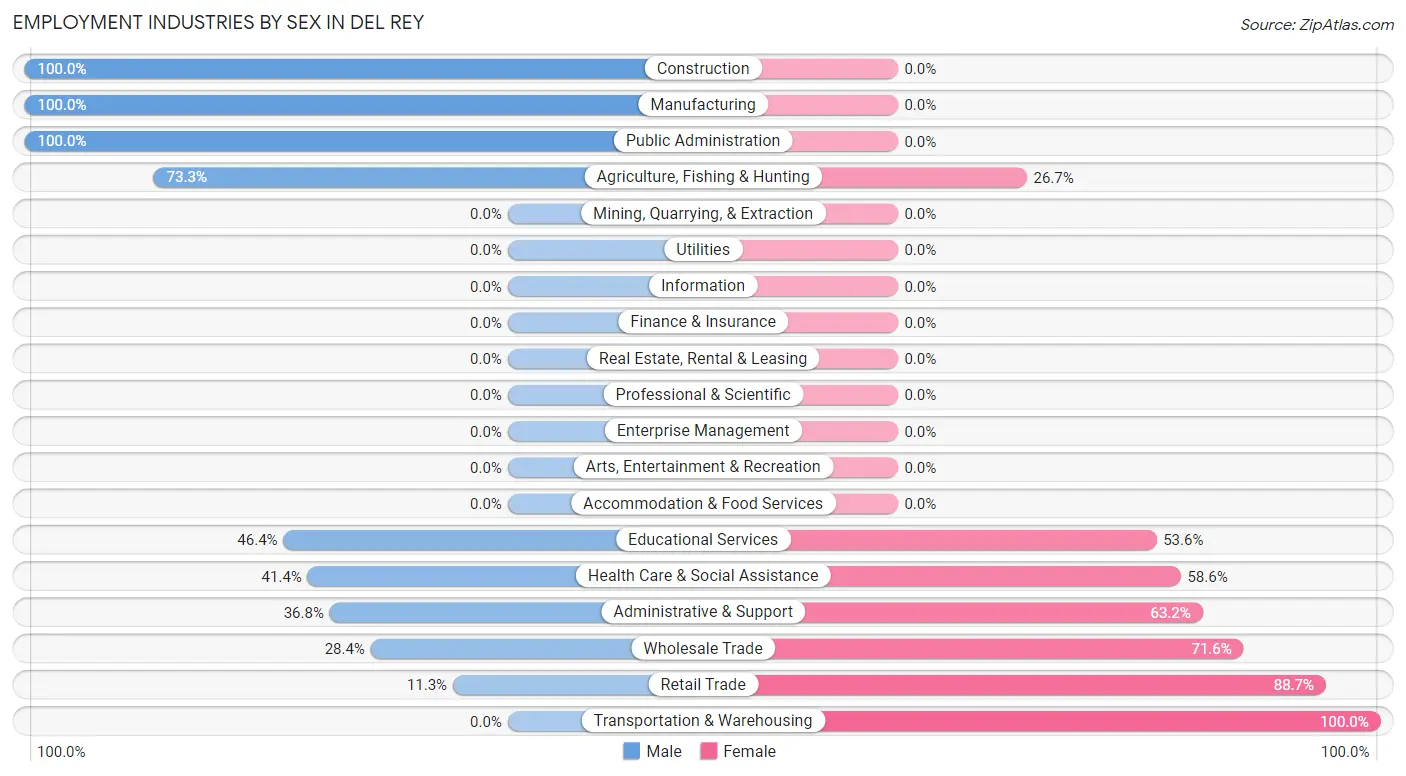
Employment Industries by Sex in Del Rey
The Del Rey industries that see more men than women are Construction (100.0%), Manufacturing (100.0%), and Public Administration (100.0%), whereas the industries that tend to have a higher number of women are Transportation & Warehousing (100.0%), Retail Trade (88.7%), and Wholesale Trade (71.6%).
| Industry | Male | Female |
| Agriculture, Fishing & Hunting | 85 (73.3%) | 31 (26.7%) |
| Mining, Quarrying, & Extraction | 0 (0.0%) | 0 (0.0%) |
| Construction | 33 (100.0%) | 0 (0.0%) |
| Manufacturing | 46 (100.0%) | 0 (0.0%) |
| Wholesale Trade | 38 (28.4%) | 96 (71.6%) |
| Retail Trade | 11 (11.3%) | 86 (88.7%) |
| Transportation & Warehousing | 0 (0.0%) | 3 (100.0%) |
| Utilities | 0 (0.0%) | 0 (0.0%) |
| Information | 0 (0.0%) | 0 (0.0%) |
| Finance & Insurance | 0 (0.0%) | 0 (0.0%) |
| Real Estate, Rental & Leasing | 0 (0.0%) | 0 (0.0%) |
| Professional & Scientific | 0 (0.0%) | 0 (0.0%) |
| Enterprise Management | 0 (0.0%) | 0 (0.0%) |
| Administrative & Support | 7 (36.8%) | 12 (63.2%) |
| Educational Services | 13 (46.4%) | 15 (53.6%) |
| Health Care & Social Assistance | 41 (41.4%) | 58 (58.6%) |
| Arts, Entertainment & Recreation | 0 (0.0%) | 0 (0.0%) |
| Accommodation & Food Services | 0 (0.0%) | 0 (0.0%) |
| Public Administration | 35 (100.0%) | 0 (0.0%) |
| Total | 309 (50.7%) | 301 (49.3%) |
Education in Del Rey
School Enrollment in Del Rey
The most common levels of schooling among the 443 students in Del Rey are high school (133 | 30.0%), college / undergraduate (121 | 27.3%), and middle school (100 | 22.6%).
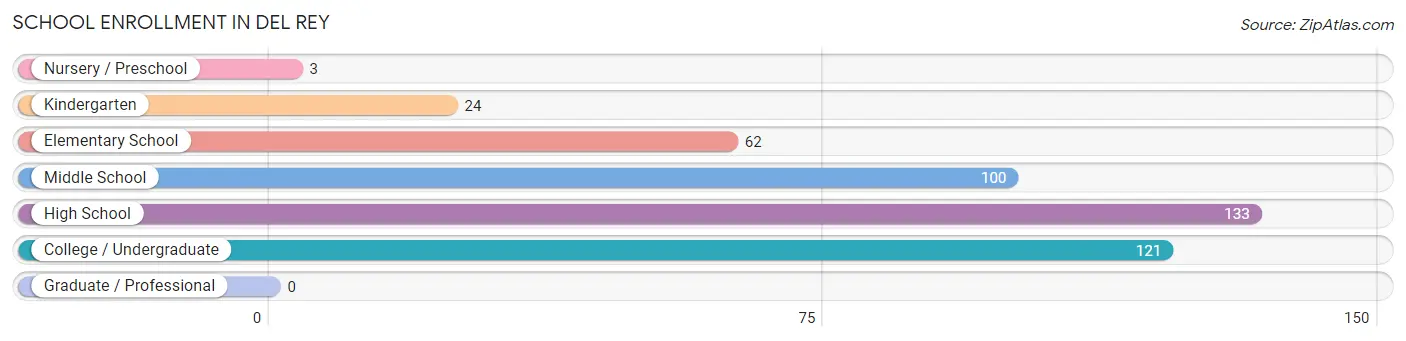
| School Level | # Students | % Students |
| Nursery / Preschool | 3 | 0.7% |
| Kindergarten | 24 | 5.4% |
| Elementary School | 62 | 14.0% |
| Middle School | 100 | 22.6% |
| High School | 133 | 30.0% |
| College / Undergraduate | 121 | 27.3% |
| Graduate / Professional | 0 | 0.0% |
| Total | 443 | 100.0% |
School Enrollment by Age by Funding Source in Del Rey
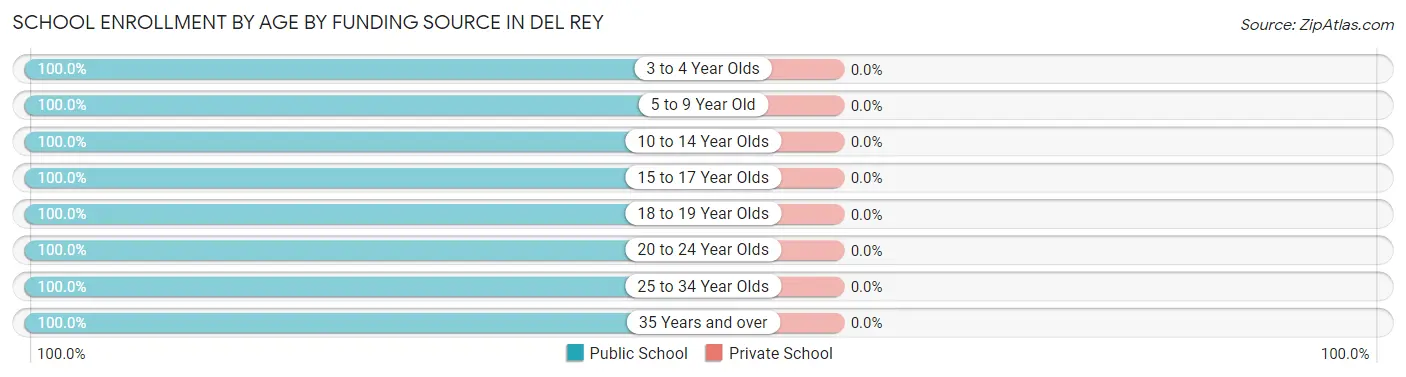
| Age Bracket | Public School | Private School |
| 3 to 4 Year Olds | 3 (100.0%) | 0 (0.0%) |
| 5 to 9 Year Old | 46 (100.0%) | 0 (0.0%) |
| 10 to 14 Year Olds | 175 (100.0%) | 0 (0.0%) |
| 15 to 17 Year Olds | 95 (100.0%) | 0 (0.0%) |
| 18 to 19 Year Olds | 87 (100.0%) | 0 (0.0%) |
| 20 to 24 Year Olds | 18 (100.0%) | 0 (0.0%) |
| 25 to 34 Year Olds | 16 (100.0%) | 0 (0.0%) |
| 35 Years and over | 3 (100.0%) | 0 (0.0%) |
| Total | 443 (100.0%) | 0 (0.0%) |
Educational Attainment by Field of Study in Del Rey
Liberal arts & history (13 | 34.2%), literature & languages (11 | 28.9%), computers & mathematics (8 | 21.0%), and bio, nature & agricultural (6 | 15.8%) are the most common fields of study among 38 individuals in Del Rey who have obtained a bachelor's degree or higher.
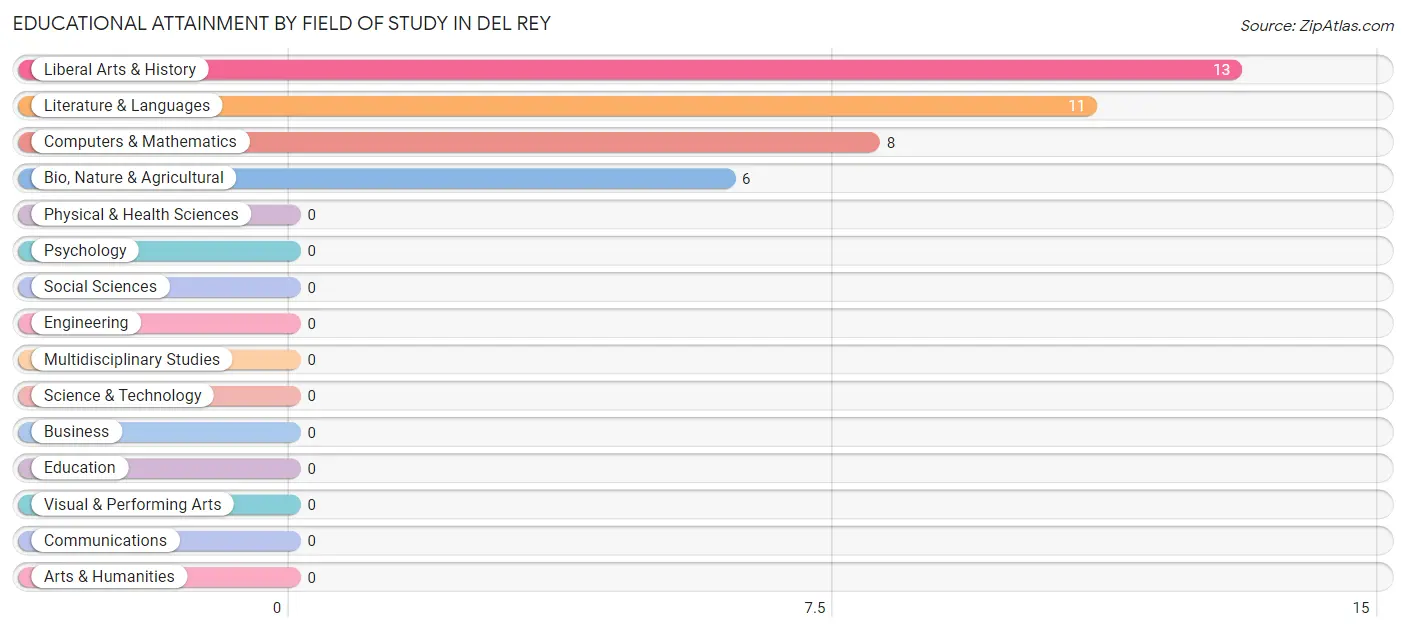
| Field of Study | # Graduates | % Graduates |
| Computers & Mathematics | 8 | 21.0% |
| Bio, Nature & Agricultural | 6 | 15.8% |
| Physical & Health Sciences | 0 | 0.0% |
| Psychology | 0 | 0.0% |
| Social Sciences | 0 | 0.0% |
| Engineering | 0 | 0.0% |
| Multidisciplinary Studies | 0 | 0.0% |
| Science & Technology | 0 | 0.0% |
| Business | 0 | 0.0% |
| Education | 0 | 0.0% |
| Literature & Languages | 11 | 28.9% |
| Liberal Arts & History | 13 | 34.2% |
| Visual & Performing Arts | 0 | 0.0% |
| Communications | 0 | 0.0% |
| Arts & Humanities | 0 | 0.0% |
| Total | 38 | 100.0% |
Transportation & Commute in Del Rey
Vehicle Availability by Sex in Del Rey
The most prevalent vehicle ownership categories in Del Rey are males with 2 vehicles (110, accounting for 35.6%) and females with 2 vehicles (166, making up 38.2%).
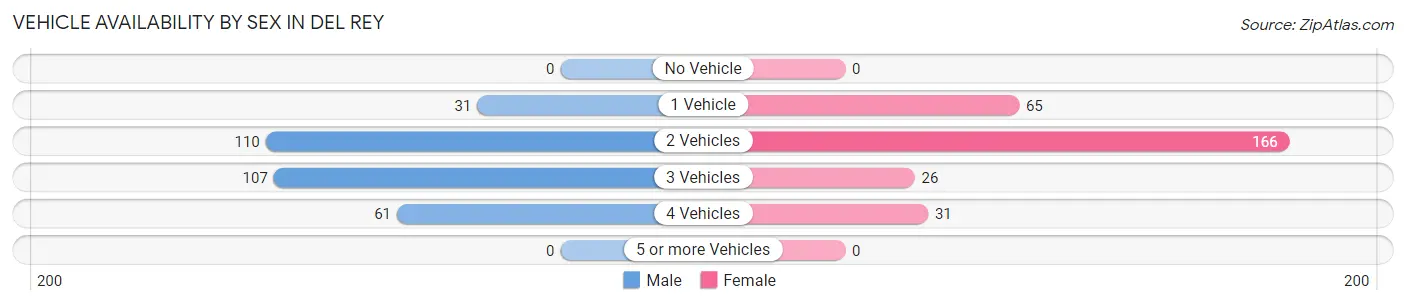
| Vehicles Available | Male | Female |
| No Vehicle | 0 (0.0%) | 0 (0.0%) |
| 1 Vehicle | 31 (10.0%) | 65 (22.6%) |
| 2 Vehicles | 110 (35.6%) | 166 (57.6%) |
| 3 Vehicles | 107 (34.6%) | 26 (9.0%) |
| 4 Vehicles | 61 (19.7%) | 31 (10.8%) |
| 5 or more Vehicles | 0 (0.0%) | 0 (0.0%) |
| Total | 309 (100.0%) | 288 (100.0%) |
Commute Time in Del Rey
The most frequently occuring commute durations in Del Rey are 20 to 24 minutes (93 commuters, 16.0%), 30 to 34 minutes (92 commuters, 15.8%), and 40 to 44 minutes (89 commuters, 15.3%).
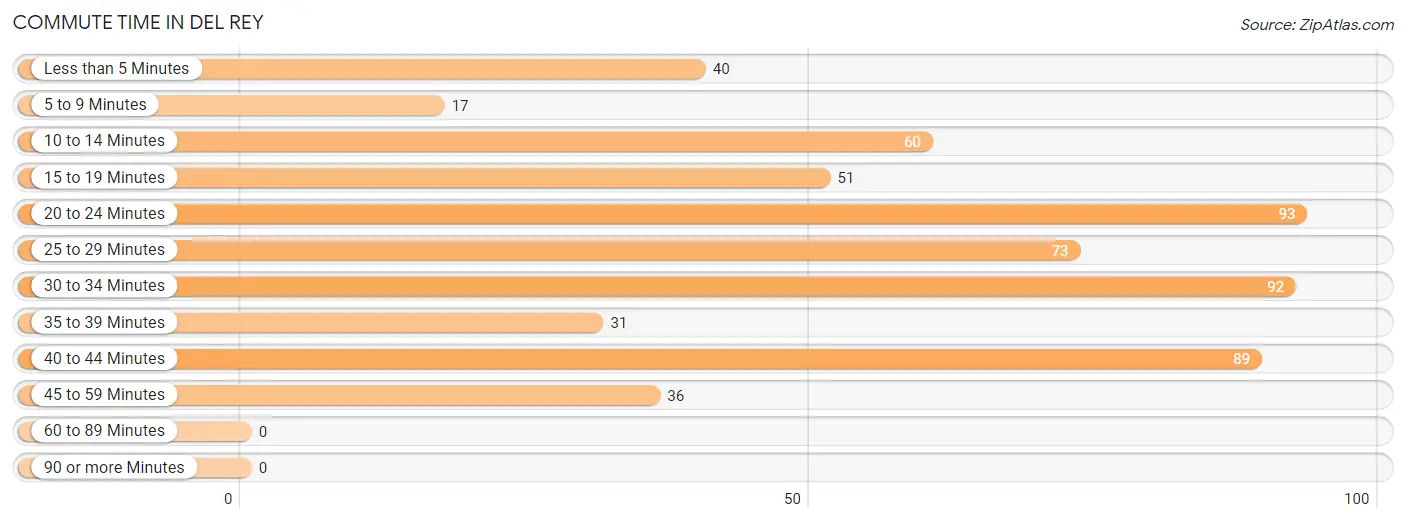
| Commute Time | # Commuters | % Commuters |
| Less than 5 Minutes | 40 | 6.9% |
| 5 to 9 Minutes | 17 | 2.9% |
| 10 to 14 Minutes | 60 | 10.3% |
| 15 to 19 Minutes | 51 | 8.8% |
| 20 to 24 Minutes | 93 | 16.0% |
| 25 to 29 Minutes | 73 | 12.5% |
| 30 to 34 Minutes | 92 | 15.8% |
| 35 to 39 Minutes | 31 | 5.3% |
| 40 to 44 Minutes | 89 | 15.3% |
| 45 to 59 Minutes | 36 | 6.2% |
| 60 to 89 Minutes | 0 | 0.0% |
| 90 or more Minutes | 0 | 0.0% |
Commute Time by Sex in Del Rey
The most common commute times in Del Rey are 25 to 29 minutes (63 commuters, 20.4%) for males and 30 to 34 minutes (64 commuters, 23.4%) for females.
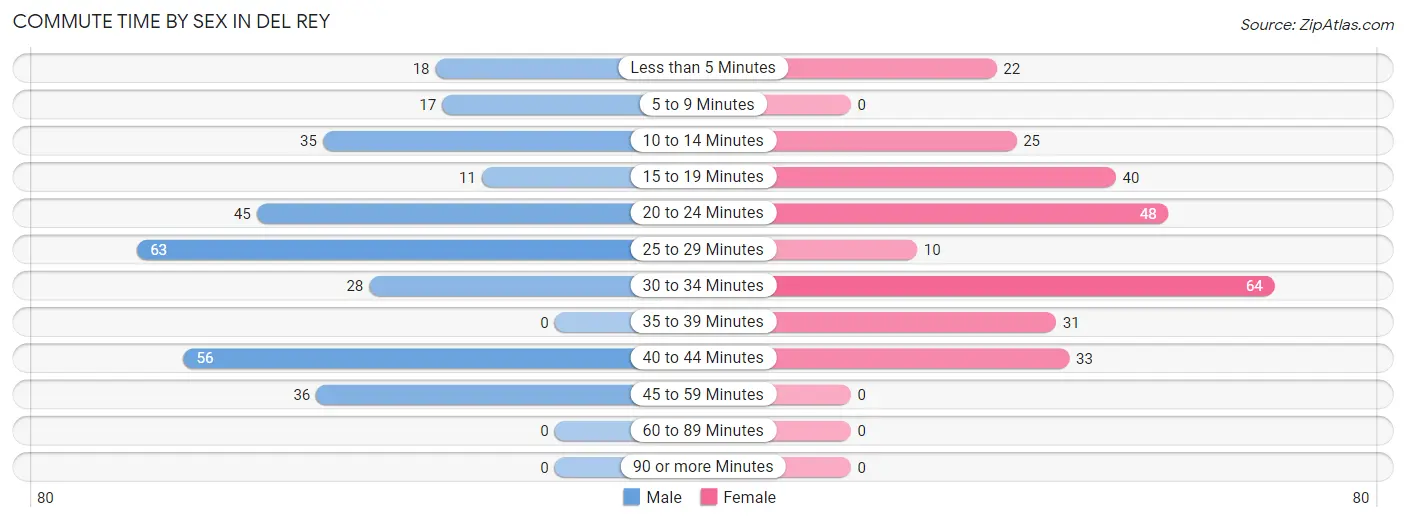
| Commute Time | Male | Female |
| Less than 5 Minutes | 18 (5.8%) | 22 (8.1%) |
| 5 to 9 Minutes | 17 (5.5%) | 0 (0.0%) |
| 10 to 14 Minutes | 35 (11.3%) | 25 (9.2%) |
| 15 to 19 Minutes | 11 (3.6%) | 40 (14.6%) |
| 20 to 24 Minutes | 45 (14.6%) | 48 (17.6%) |
| 25 to 29 Minutes | 63 (20.4%) | 10 (3.7%) |
| 30 to 34 Minutes | 28 (9.1%) | 64 (23.4%) |
| 35 to 39 Minutes | 0 (0.0%) | 31 (11.4%) |
| 40 to 44 Minutes | 56 (18.1%) | 33 (12.1%) |
| 45 to 59 Minutes | 36 (11.7%) | 0 (0.0%) |
| 60 to 89 Minutes | 0 (0.0%) | 0 (0.0%) |
| 90 or more Minutes | 0 (0.0%) | 0 (0.0%) |
Time of Departure to Work by Sex in Del Rey
The most frequent times of departure to work in Del Rey are 5:00 AM to 5:29 AM (120, 38.8%) for males and 7:00 AM to 7:29 AM (62, 22.7%) for females.
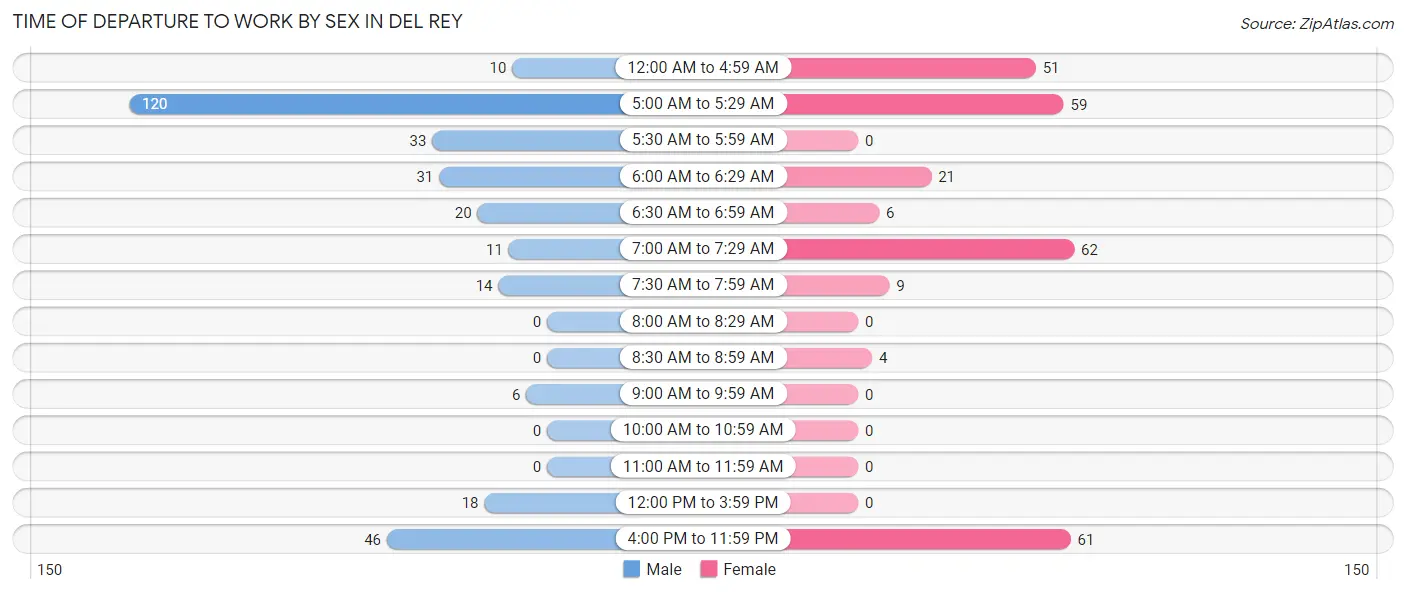
| Time of Departure | Male | Female |
| 12:00 AM to 4:59 AM | 10 (3.2%) | 51 (18.7%) |
| 5:00 AM to 5:29 AM | 120 (38.8%) | 59 (21.6%) |
| 5:30 AM to 5:59 AM | 33 (10.7%) | 0 (0.0%) |
| 6:00 AM to 6:29 AM | 31 (10.0%) | 21 (7.7%) |
| 6:30 AM to 6:59 AM | 20 (6.5%) | 6 (2.2%) |
| 7:00 AM to 7:29 AM | 11 (3.6%) | 62 (22.7%) |
| 7:30 AM to 7:59 AM | 14 (4.5%) | 9 (3.3%) |
| 8:00 AM to 8:29 AM | 0 (0.0%) | 0 (0.0%) |
| 8:30 AM to 8:59 AM | 0 (0.0%) | 4 (1.5%) |
| 9:00 AM to 9:59 AM | 6 (1.9%) | 0 (0.0%) |
| 10:00 AM to 10:59 AM | 0 (0.0%) | 0 (0.0%) |
| 11:00 AM to 11:59 AM | 0 (0.0%) | 0 (0.0%) |
| 12:00 PM to 3:59 PM | 18 (5.8%) | 0 (0.0%) |
| 4:00 PM to 11:59 PM | 46 (14.9%) | 61 (22.3%) |
| Total | 309 (100.0%) | 273 (100.0%) |
Housing Occupancy in Del Rey
Occupancy by Ownership in Del Rey
Of the total 399 dwellings in Del Rey, owner-occupied units account for 207 (51.9%), while renter-occupied units make up 192 (48.1%).
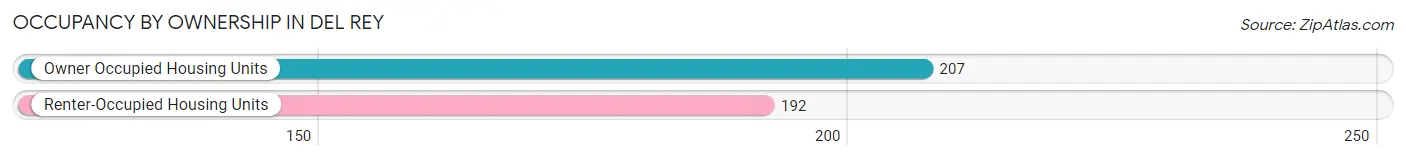
| Occupancy | # Housing Units | % Housing Units |
| Owner Occupied Housing Units | 207 | 51.9% |
| Renter-Occupied Housing Units | 192 | 48.1% |
| Total Occupied Housing Units | 399 | 100.0% |
Occupancy by Household Size in Del Rey
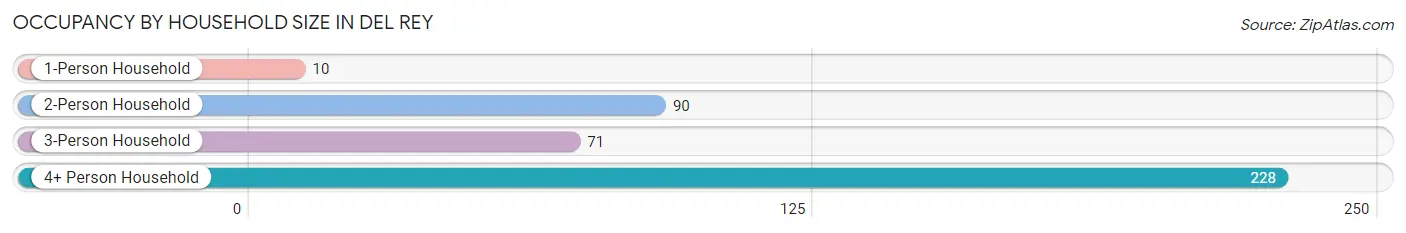
| Household Size | # Housing Units | % Housing Units |
| 1-Person Household | 10 | 2.5% |
| 2-Person Household | 90 | 22.6% |
| 3-Person Household | 71 | 17.8% |
| 4+ Person Household | 228 | 57.1% |
| Total Housing Units | 399 | 100.0% |
Occupancy by Ownership by Household Size in Del Rey
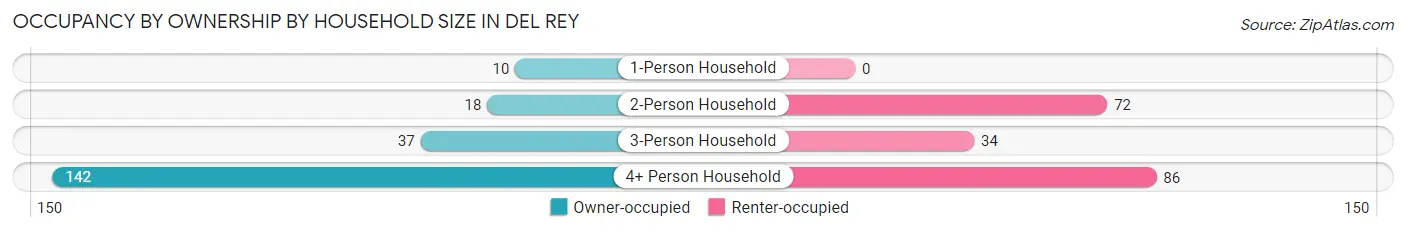
| Household Size | Owner-occupied | Renter-occupied |
| 1-Person Household | 10 (100.0%) | 0 (0.0%) |
| 2-Person Household | 18 (20.0%) | 72 (80.0%) |
| 3-Person Household | 37 (52.1%) | 34 (47.9%) |
| 4+ Person Household | 142 (62.3%) | 86 (37.7%) |
| Total Housing Units | 207 (51.9%) | 192 (48.1%) |
Occupancy by Educational Attainment in Del Rey
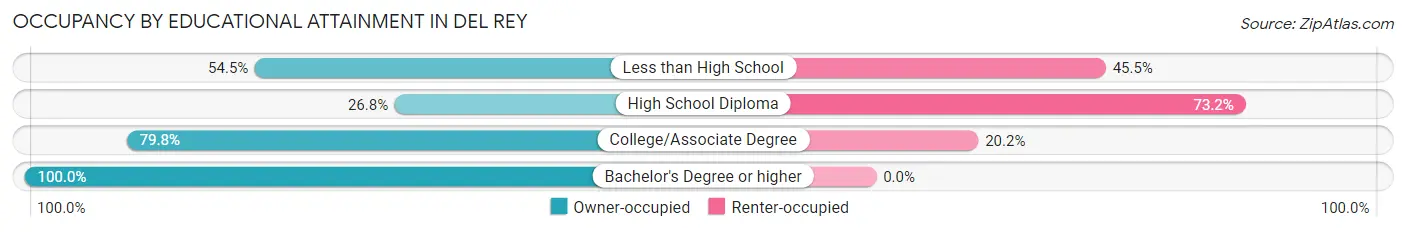
| Household Size | Owner-occupied | Renter-occupied |
| Less than High School | 85 (54.5%) | 71 (45.5%) |
| High School Diploma | 38 (26.8%) | 104 (73.2%) |
| College/Associate Degree | 67 (79.8%) | 17 (20.2%) |
| Bachelor's Degree or higher | 17 (100.0%) | 0 (0.0%) |
Occupancy by Age of Householder in Del Rey
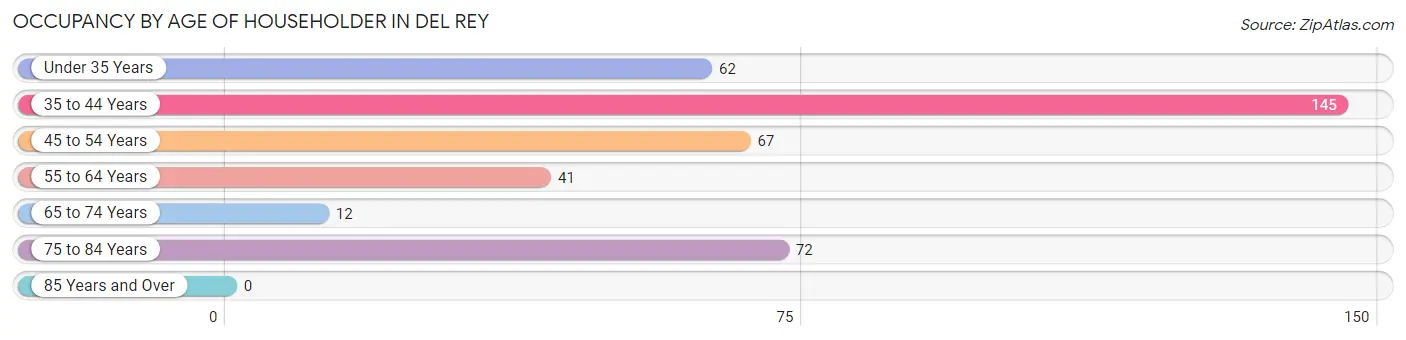
| Age Bracket | # Households | % Households |
| Under 35 Years | 62 | 15.5% |
| 35 to 44 Years | 145 | 36.3% |
| 45 to 54 Years | 67 | 16.8% |
| 55 to 64 Years | 41 | 10.3% |
| 65 to 74 Years | 12 | 3.0% |
| 75 to 84 Years | 72 | 18.0% |
| 85 Years and Over | 0 | 0.0% |
| Total | 399 | 100.0% |
Housing Finances in Del Rey
Median Income by Occupancy in Del Rey
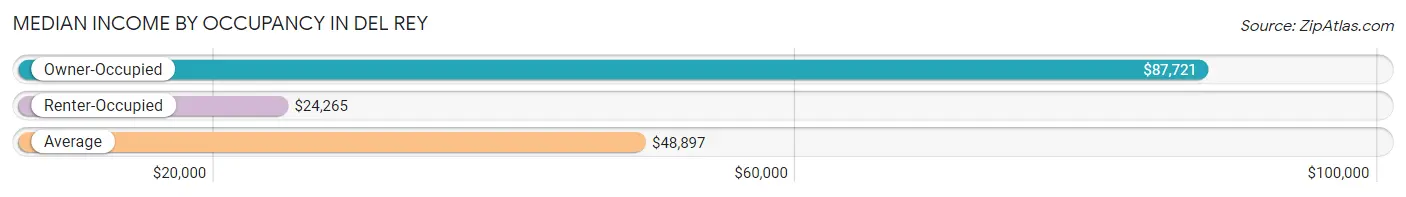
| Occupancy Type | # Households | Median Income |
| Owner-Occupied | 207 (51.9%) | $87,721 |
| Renter-Occupied | 192 (48.1%) | $24,265 |
| Average | 399 (100.0%) | $48,897 |
Occupancy by Householder Income Bracket in Del Rey
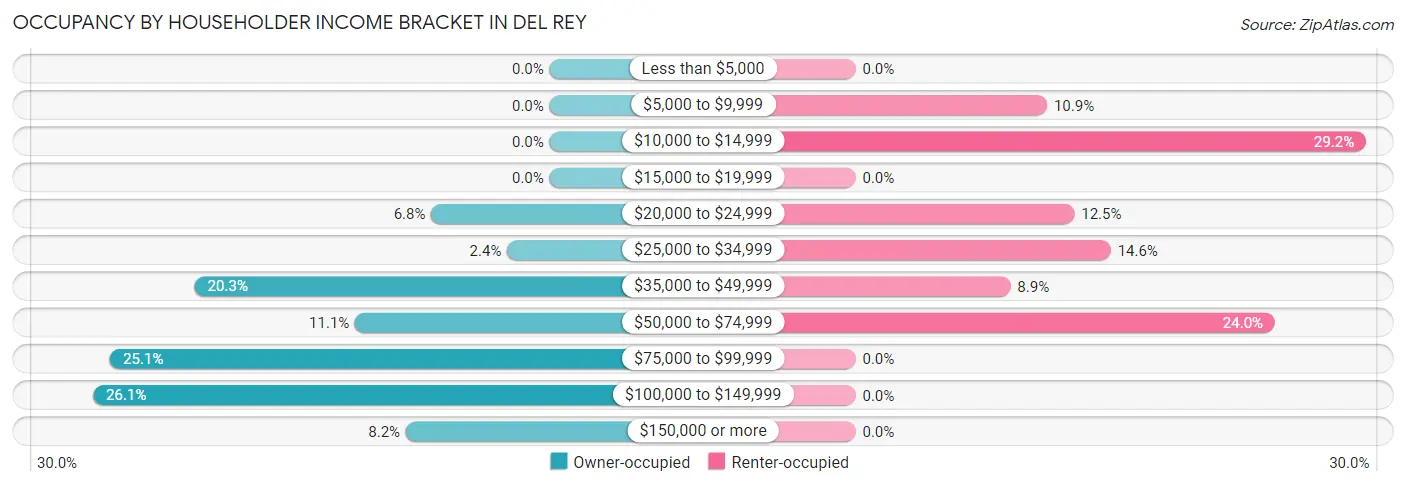
| Income Bracket | Owner-occupied | Renter-occupied |
| Less than $5,000 | 0 (0.0%) | 0 (0.0%) |
| $5,000 to $9,999 | 0 (0.0%) | 21 (10.9%) |
| $10,000 to $14,999 | 0 (0.0%) | 56 (29.2%) |
| $15,000 to $19,999 | 0 (0.0%) | 0 (0.0%) |
| $20,000 to $24,999 | 14 (6.8%) | 24 (12.5%) |
| $25,000 to $34,999 | 5 (2.4%) | 28 (14.6%) |
| $35,000 to $49,999 | 42 (20.3%) | 17 (8.8%) |
| $50,000 to $74,999 | 23 (11.1%) | 46 (24.0%) |
| $75,000 to $99,999 | 52 (25.1%) | 0 (0.0%) |
| $100,000 to $149,999 | 54 (26.1%) | 0 (0.0%) |
| $150,000 or more | 17 (8.2%) | 0 (0.0%) |
| Total | 207 (100.0%) | 192 (100.0%) |
Monthly Housing Cost Tiers in Del Rey
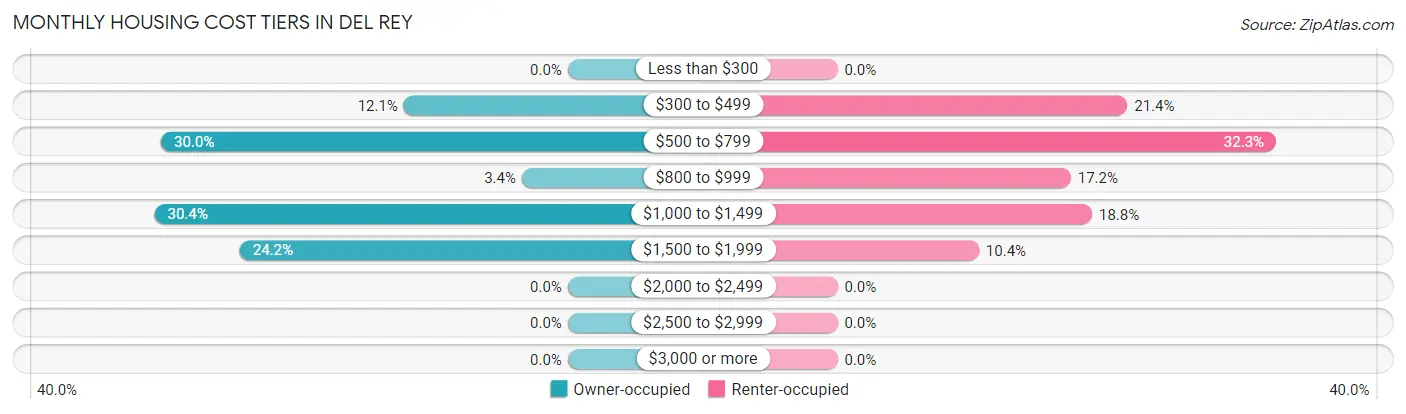
| Monthly Cost | Owner-occupied | Renter-occupied |
| Less than $300 | 0 (0.0%) | 0 (0.0%) |
| $300 to $499 | 25 (12.1%) | 41 (21.3%) |
| $500 to $799 | 62 (29.9%) | 62 (32.3%) |
| $800 to $999 | 7 (3.4%) | 33 (17.2%) |
| $1,000 to $1,499 | 63 (30.4%) | 36 (18.8%) |
| $1,500 to $1,999 | 50 (24.1%) | 20 (10.4%) |
| $2,000 to $2,499 | 0 (0.0%) | 0 (0.0%) |
| $2,500 to $2,999 | 0 (0.0%) | 0 (0.0%) |
| $3,000 or more | 0 (0.0%) | 0 (0.0%) |
| Total | 207 (100.0%) | 192 (100.0%) |
Physical Housing Characteristics in Del Rey
Housing Structures in Del Rey
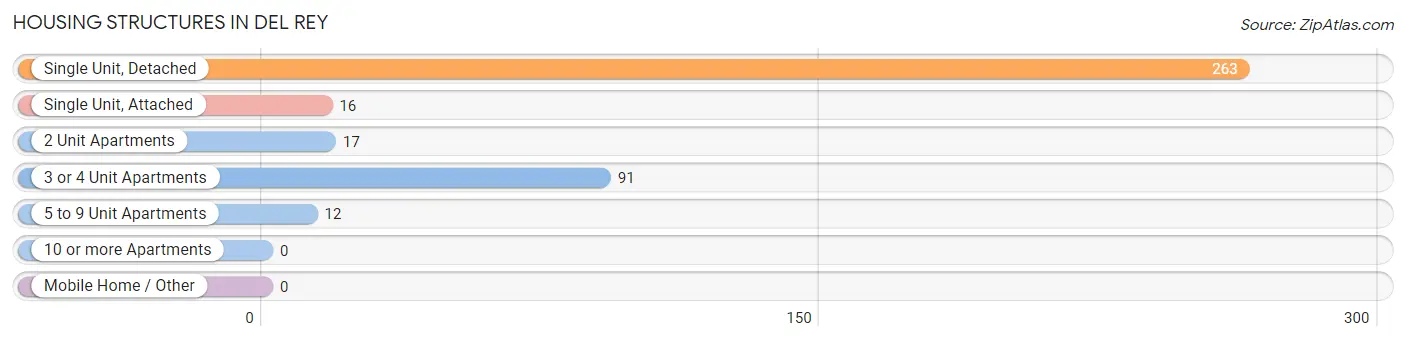
| Structure Type | # Housing Units | % Housing Units |
| Single Unit, Detached | 263 | 65.9% |
| Single Unit, Attached | 16 | 4.0% |
| 2 Unit Apartments | 17 | 4.3% |
| 3 or 4 Unit Apartments | 91 | 22.8% |
| 5 to 9 Unit Apartments | 12 | 3.0% |
| 10 or more Apartments | 0 | 0.0% |
| Mobile Home / Other | 0 | 0.0% |
| Total | 399 | 100.0% |
Housing Structures by Occupancy in Del Rey
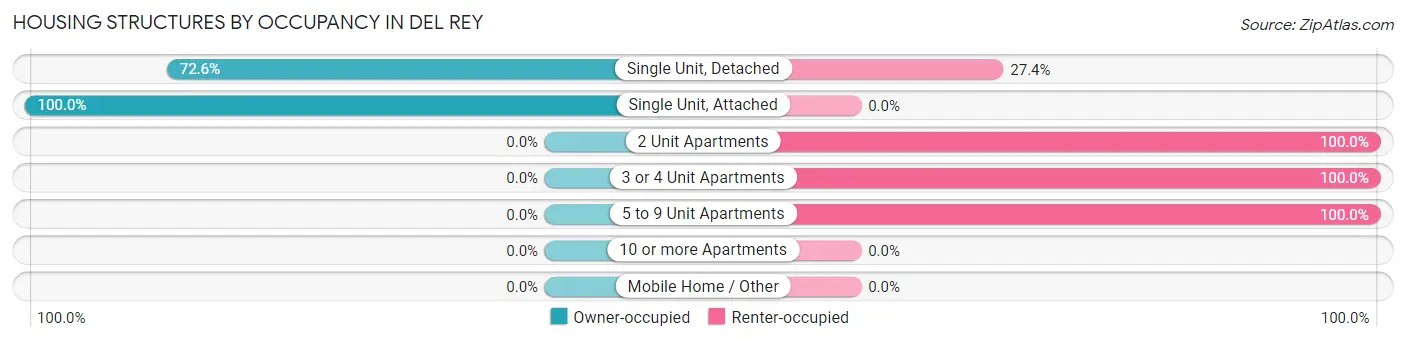
| Structure Type | Owner-occupied | Renter-occupied |
| Single Unit, Detached | 191 (72.6%) | 72 (27.4%) |
| Single Unit, Attached | 16 (100.0%) | 0 (0.0%) |
| 2 Unit Apartments | 0 (0.0%) | 17 (100.0%) |
| 3 or 4 Unit Apartments | 0 (0.0%) | 91 (100.0%) |
| 5 to 9 Unit Apartments | 0 (0.0%) | 12 (100.0%) |
| 10 or more Apartments | 0 (0.0%) | 0 (0.0%) |
| Mobile Home / Other | 0 (0.0%) | 0 (0.0%) |
| Total | 207 (51.9%) | 192 (48.1%) |
Housing Structures by Number of Rooms in Del Rey
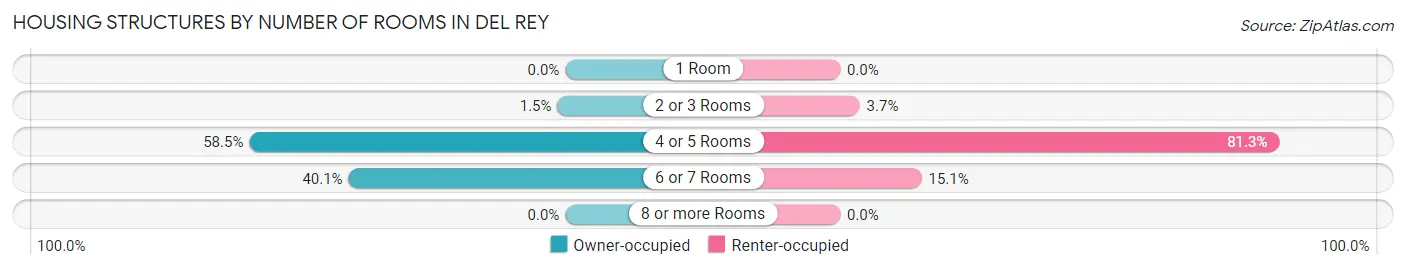
| Number of Rooms | Owner-occupied | Renter-occupied |
| 1 Room | 0 (0.0%) | 0 (0.0%) |
| 2 or 3 Rooms | 3 (1.5%) | 7 (3.6%) |
| 4 or 5 Rooms | 121 (58.5%) | 156 (81.2%) |
| 6 or 7 Rooms | 83 (40.1%) | 29 (15.1%) |
| 8 or more Rooms | 0 (0.0%) | 0 (0.0%) |
| Total | 207 (100.0%) | 192 (100.0%) |
Housing Structure by Heating Type in Del Rey
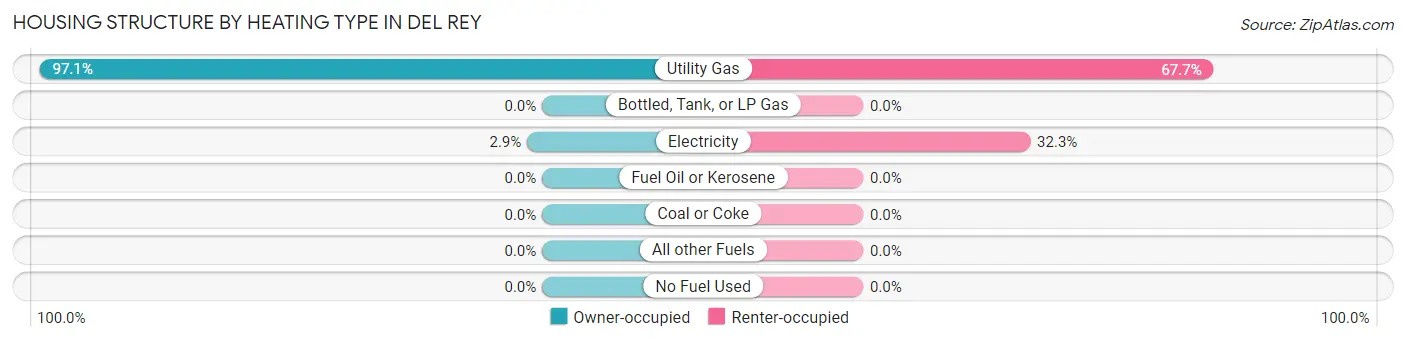
| Heating Type | Owner-occupied | Renter-occupied |
| Utility Gas | 201 (97.1%) | 130 (67.7%) |
| Bottled, Tank, or LP Gas | 0 (0.0%) | 0 (0.0%) |
| Electricity | 6 (2.9%) | 62 (32.3%) |
| Fuel Oil or Kerosene | 0 (0.0%) | 0 (0.0%) |
| Coal or Coke | 0 (0.0%) | 0 (0.0%) |
| All other Fuels | 0 (0.0%) | 0 (0.0%) |
| No Fuel Used | 0 (0.0%) | 0 (0.0%) |
| Total | 207 (100.0%) | 192 (100.0%) |
Household Vehicle Usage in Del Rey
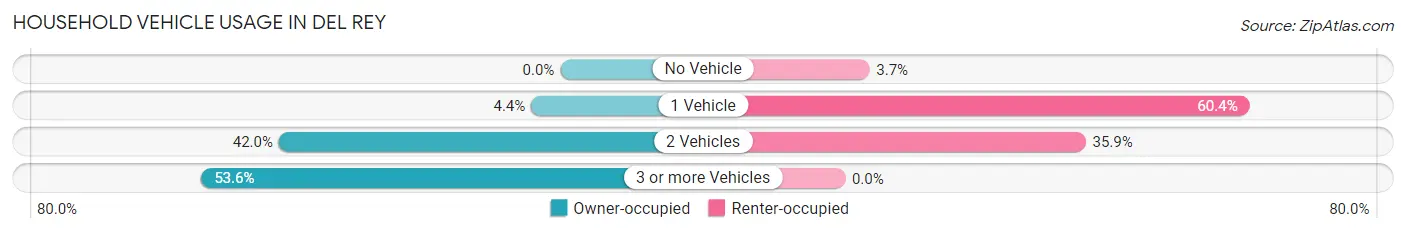
| Vehicles per Household | Owner-occupied | Renter-occupied |
| No Vehicle | 0 (0.0%) | 7 (3.6%) |
| 1 Vehicle | 9 (4.3%) | 116 (60.4%) |
| 2 Vehicles | 87 (42.0%) | 69 (35.9%) |
| 3 or more Vehicles | 111 (53.6%) | 0 (0.0%) |
| Total | 207 (100.0%) | 192 (100.0%) |
Real Estate & Mortgages in Del Rey
Real Estate and Mortgage Overview in Del Rey
| Characteristic | Without Mortgage | With Mortgage |
| Housing Units | 47 | 160 |
| Median Property Value | $171,800 | $195,200 |
| Median Household Income | $129,398 | $0 |
| Monthly Housing Costs | $629 | $0 |
| Real Estate Taxes | $1,231 | $0 |
Property Value by Mortgage Status in Del Rey
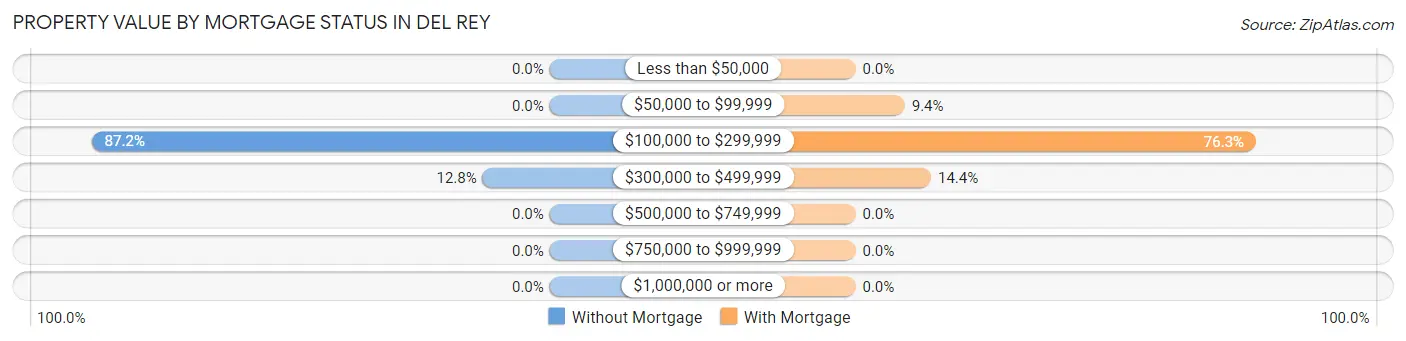
| Property Value | Without Mortgage | With Mortgage |
| Less than $50,000 | 0 (0.0%) | 0 (0.0%) |
| $50,000 to $99,999 | 0 (0.0%) | 15 (9.4%) |
| $100,000 to $299,999 | 41 (87.2%) | 122 (76.2%) |
| $300,000 to $499,999 | 6 (12.8%) | 23 (14.4%) |
| $500,000 to $749,999 | 0 (0.0%) | 0 (0.0%) |
| $750,000 to $999,999 | 0 (0.0%) | 0 (0.0%) |
| $1,000,000 or more | 0 (0.0%) | 0 (0.0%) |
| Total | 47 (100.0%) | 160 (100.0%) |
Household Income by Mortgage Status in Del Rey
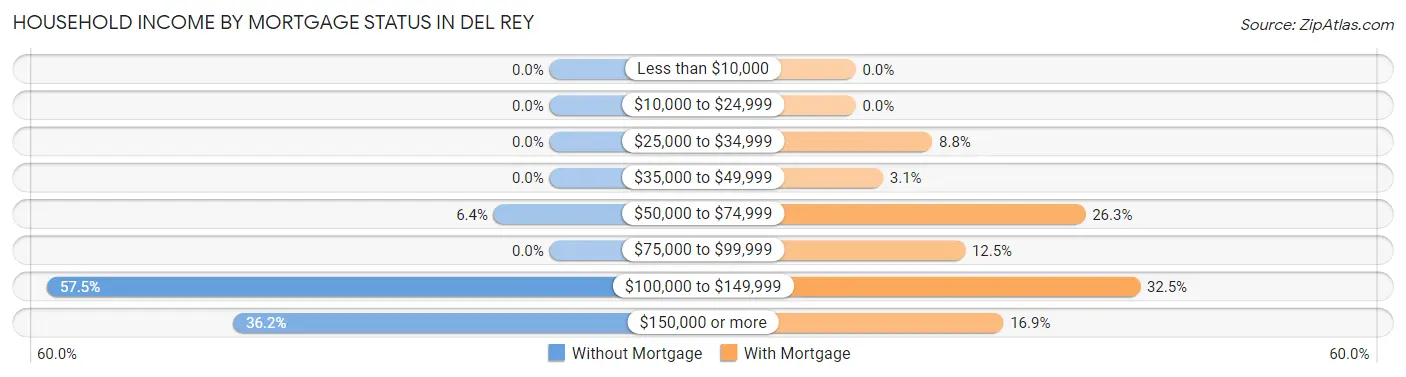
| Household Income | Without Mortgage | With Mortgage |
| Less than $10,000 | 0 (0.0%) | 0 (0.0%) |
| $10,000 to $24,999 | 0 (0.0%) | 0 (0.0%) |
| $25,000 to $34,999 | 0 (0.0%) | 14 (8.7%) |
| $35,000 to $49,999 | 0 (0.0%) | 5 (3.1%) |
| $50,000 to $74,999 | 3 (6.4%) | 42 (26.3%) |
| $75,000 to $99,999 | 0 (0.0%) | 20 (12.5%) |
| $100,000 to $149,999 | 27 (57.5%) | 52 (32.5%) |
| $150,000 or more | 17 (36.2%) | 27 (16.9%) |
| Total | 47 (100.0%) | 160 (100.0%) |
Property Value to Household Income Ratio in Del Rey
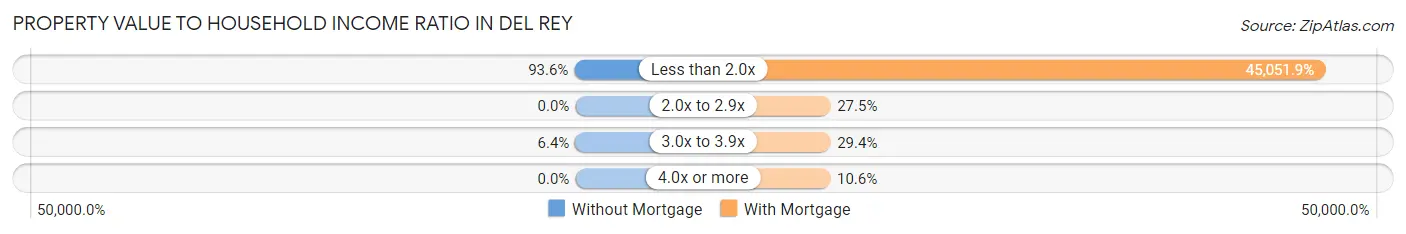
| Value-to-Income Ratio | Without Mortgage | With Mortgage |
| Less than 2.0x | 44 (93.6%) | 72,083 (45,051.9%) |
| 2.0x to 2.9x | 0 (0.0%) | 44 (27.5%) |
| 3.0x to 3.9x | 3 (6.4%) | 47 (29.4%) |
| 4.0x or more | 0 (0.0%) | 17 (10.6%) |
| Total | 47 (100.0%) | 160 (100.0%) |
Real Estate Taxes by Mortgage Status in Del Rey
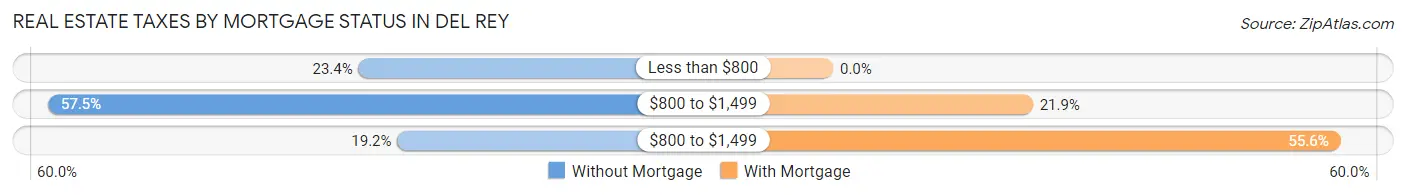
| Property Taxes | Without Mortgage | With Mortgage |
| Less than $800 | 11 (23.4%) | 0 (0.0%) |
| $800 to $1,499 | 27 (57.5%) | 35 (21.9%) |
| $800 to $1,499 | 9 (19.2%) | 89 (55.6%) |
| Total | 47 (100.0%) | 160 (100.0%) |
Health & Disability in Del Rey
Health Insurance Coverage by Age in Del Rey
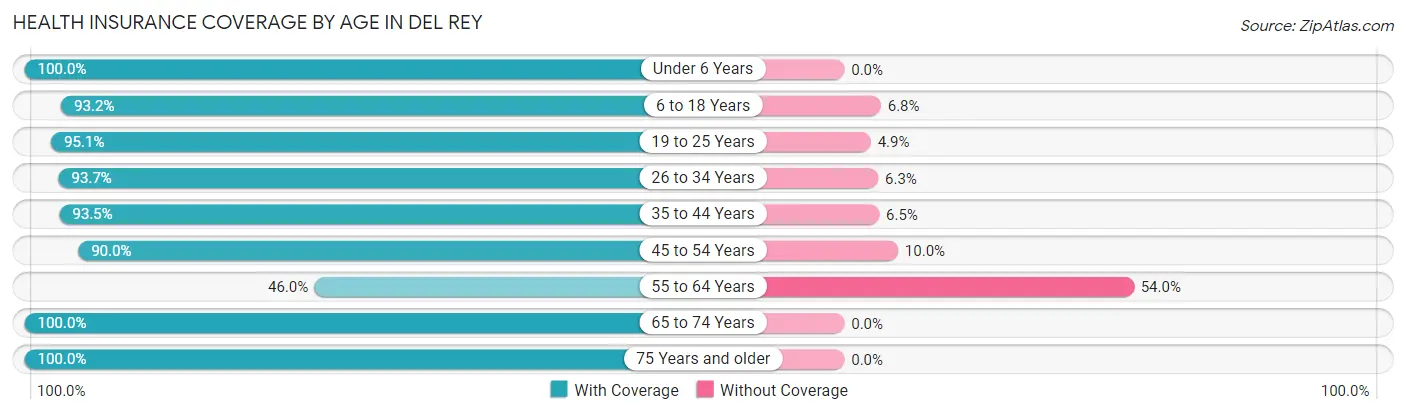
| Age Bracket | With Coverage | Without Coverage |
| Under 6 Years | 99 (100.0%) | 0 (0.0%) |
| 6 to 18 Years | 356 (93.2%) | 26 (6.8%) |
| 19 to 25 Years | 193 (95.1%) | 10 (4.9%) |
| 26 to 34 Years | 104 (93.7%) | 7 (6.3%) |
| 35 to 44 Years | 245 (93.5%) | 17 (6.5%) |
| 45 to 54 Years | 117 (90.0%) | 13 (10.0%) |
| 55 to 64 Years | 58 (46.0%) | 68 (54.0%) |
| 65 to 74 Years | 65 (100.0%) | 0 (0.0%) |
| 75 Years and older | 113 (100.0%) | 0 (0.0%) |
| Total | 1,350 (90.5%) | 141 (9.5%) |
Health Insurance Coverage by Citizenship Status in Del Rey

| Citizenship Status | With Coverage | Without Coverage |
| Native Born | 99 (100.0%) | 0 (0.0%) |
| Foreign Born, Citizen | 356 (93.2%) | 26 (6.8%) |
| Foreign Born, not a Citizen | 193 (95.1%) | 10 (4.9%) |
Health Insurance Coverage by Household Income in Del Rey
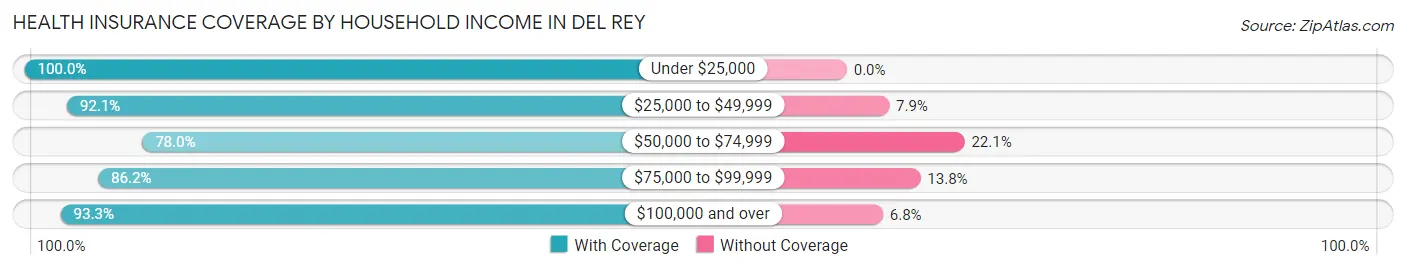
| Household Income | With Coverage | Without Coverage |
| Under $25,000 | 288 (100.0%) | 0 (0.0%) |
| $25,000 to $49,999 | 360 (92.1%) | 31 (7.9%) |
| $50,000 to $74,999 | 198 (77.9%) | 56 (22.1%) |
| $75,000 to $99,999 | 200 (86.2%) | 32 (13.8%) |
| $100,000 and over | 304 (93.2%) | 22 (6.8%) |
Public vs Private Health Insurance Coverage by Age in Del Rey
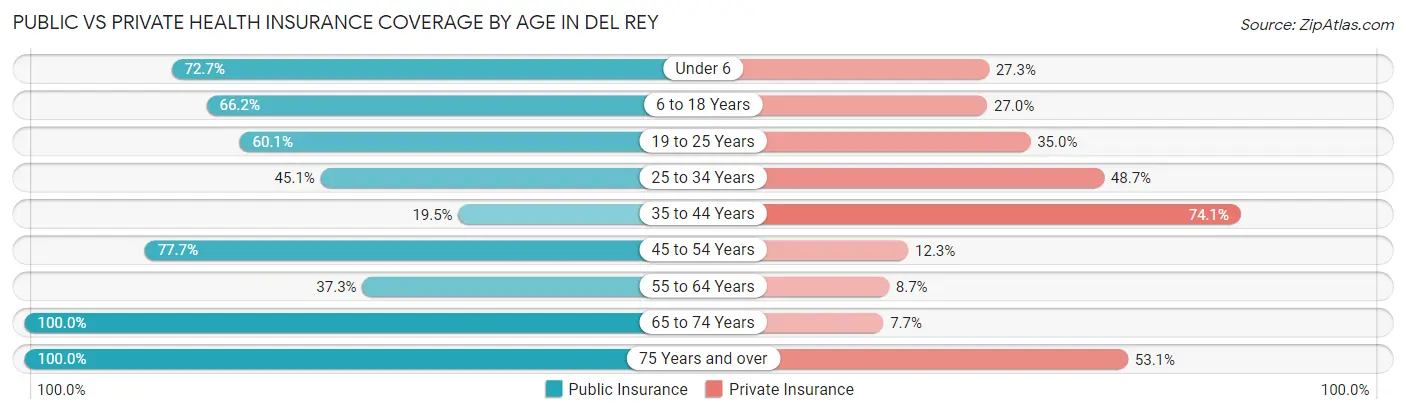
| Age Bracket | Public Insurance | Private Insurance |
| Under 6 | 72 (72.7%) | 27 (27.3%) |
| 6 to 18 Years | 253 (66.2%) | 103 (27.0%) |
| 19 to 25 Years | 122 (60.1%) | 71 (35.0%) |
| 25 to 34 Years | 50 (45.1%) | 54 (48.6%) |
| 35 to 44 Years | 51 (19.5%) | 194 (74.1%) |
| 45 to 54 Years | 101 (77.7%) | 16 (12.3%) |
| 55 to 64 Years | 47 (37.3%) | 11 (8.7%) |
| 65 to 74 Years | 65 (100.0%) | 5 (7.7%) |
| 75 Years and over | 113 (100.0%) | 60 (53.1%) |
| Total | 874 (58.6%) | 541 (36.3%) |
Disability Status by Sex by Age in Del Rey
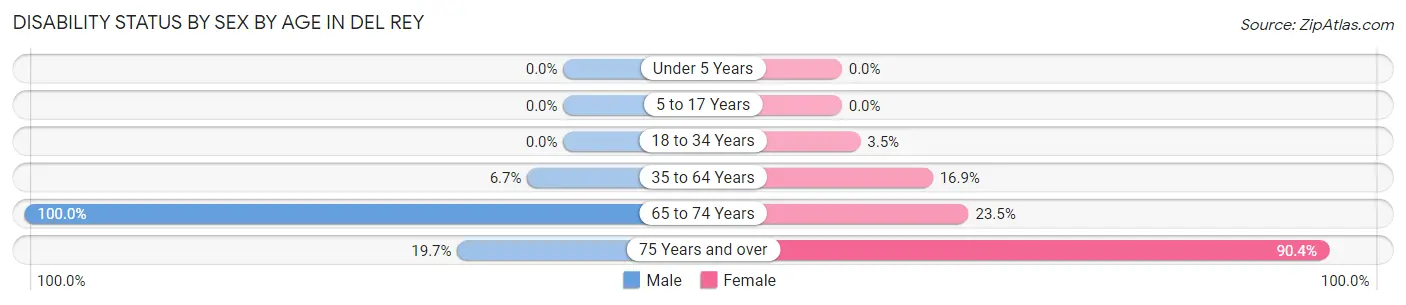
| Age Bracket | Male | Female |
| Under 5 Years | 0 (0.0%) | 0 (0.0%) |
| 5 to 17 Years | 0 (0.0%) | 0 (0.0%) |
| 18 to 34 Years | 0 (0.0%) | 8 (3.5%) |
| 35 to 64 Years | 18 (6.7%) | 42 (16.9%) |
| 65 to 74 Years | 14 (100.0%) | 12 (23.5%) |
| 75 Years and over | 12 (19.7%) | 47 (90.4%) |
Disability Class by Sex by Age in Del Rey
Disability Class: Hearing Difficulty
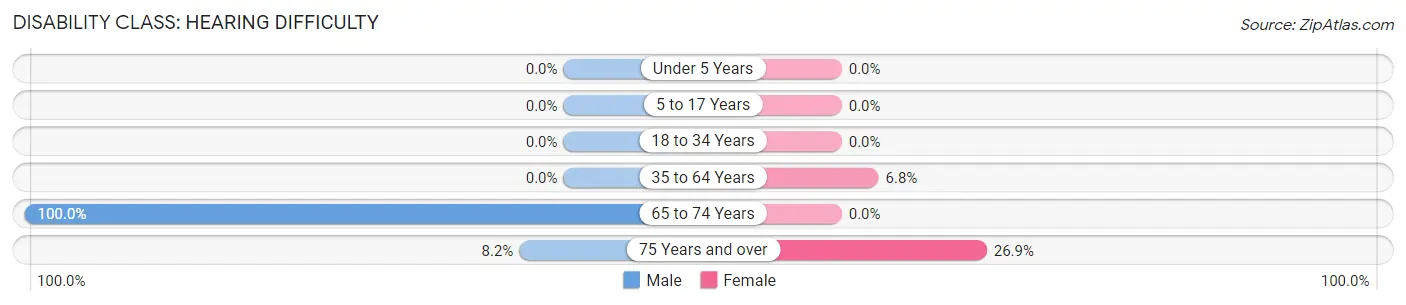
| Age Bracket | Male | Female |
| Under 5 Years | 0 (0.0%) | 0 (0.0%) |
| 5 to 17 Years | 0 (0.0%) | 0 (0.0%) |
| 18 to 34 Years | 0 (0.0%) | 0 (0.0%) |
| 35 to 64 Years | 0 (0.0%) | 17 (6.8%) |
| 65 to 74 Years | 14 (100.0%) | 0 (0.0%) |
| 75 Years and over | 5 (8.2%) | 14 (26.9%) |
Disability Class: Vision Difficulty
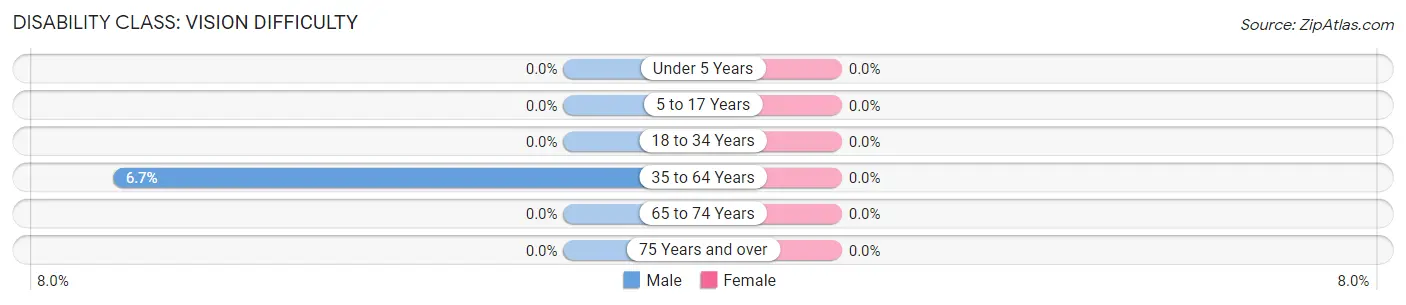
| Age Bracket | Male | Female |
| Under 5 Years | 0 (0.0%) | 0 (0.0%) |
| 5 to 17 Years | 0 (0.0%) | 0 (0.0%) |
| 18 to 34 Years | 0 (0.0%) | 0 (0.0%) |
| 35 to 64 Years | 18 (6.7%) | 0 (0.0%) |
| 65 to 74 Years | 0 (0.0%) | 0 (0.0%) |
| 75 Years and over | 0 (0.0%) | 0 (0.0%) |
Disability Class: Cognitive Difficulty
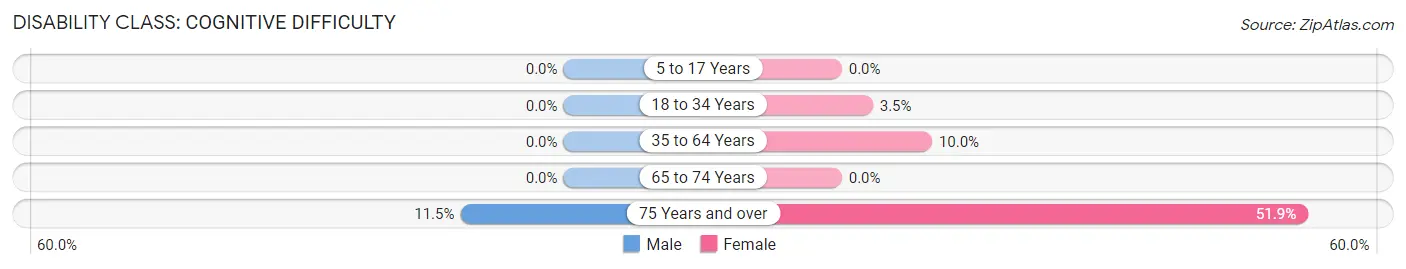
| Age Bracket | Male | Female |
| 5 to 17 Years | 0 (0.0%) | 0 (0.0%) |
| 18 to 34 Years | 0 (0.0%) | 8 (3.5%) |
| 35 to 64 Years | 0 (0.0%) | 25 (10.0%) |
| 65 to 74 Years | 0 (0.0%) | 0 (0.0%) |
| 75 Years and over | 7 (11.5%) | 27 (51.9%) |
Disability Class: Ambulatory Difficulty
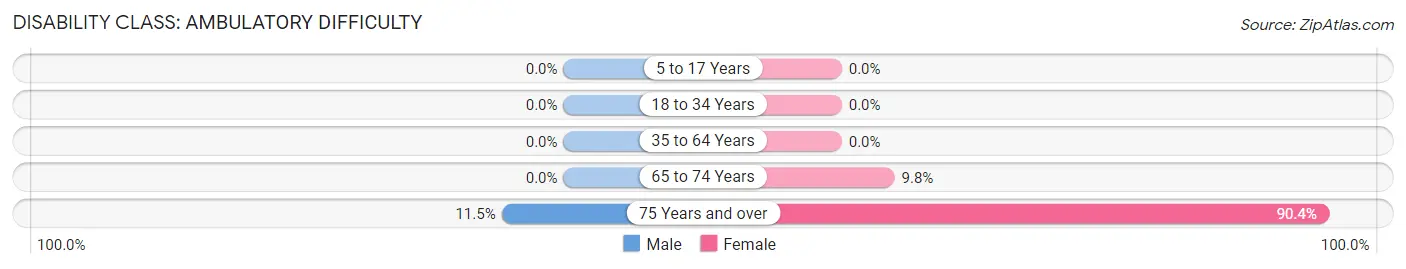
| Age Bracket | Male | Female |
| 5 to 17 Years | 0 (0.0%) | 0 (0.0%) |
| 18 to 34 Years | 0 (0.0%) | 0 (0.0%) |
| 35 to 64 Years | 0 (0.0%) | 0 (0.0%) |
| 65 to 74 Years | 0 (0.0%) | 5 (9.8%) |
| 75 Years and over | 7 (11.5%) | 47 (90.4%) |
Disability Class: Self-Care Difficulty
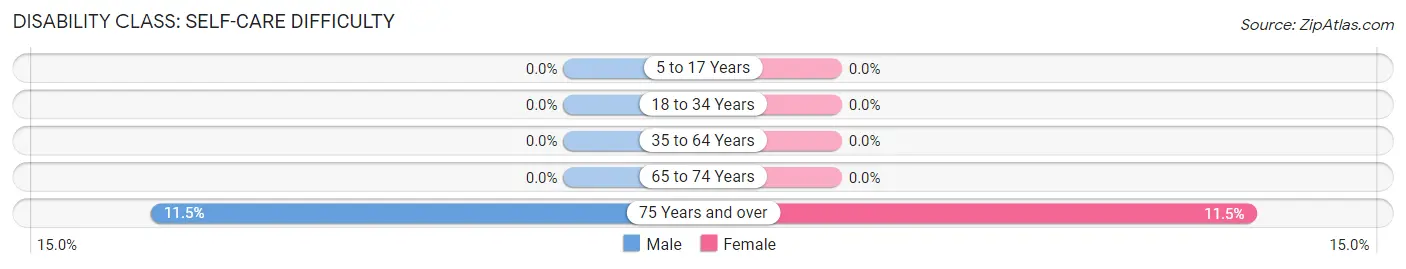
| Age Bracket | Male | Female |
| 5 to 17 Years | 0 (0.0%) | 0 (0.0%) |
| 18 to 34 Years | 0 (0.0%) | 0 (0.0%) |
| 35 to 64 Years | 0 (0.0%) | 0 (0.0%) |
| 65 to 74 Years | 0 (0.0%) | 0 (0.0%) |
| 75 Years and over | 7 (11.5%) | 6 (11.5%) |
Technology Access in Del Rey
Computing Device Access in Del Rey
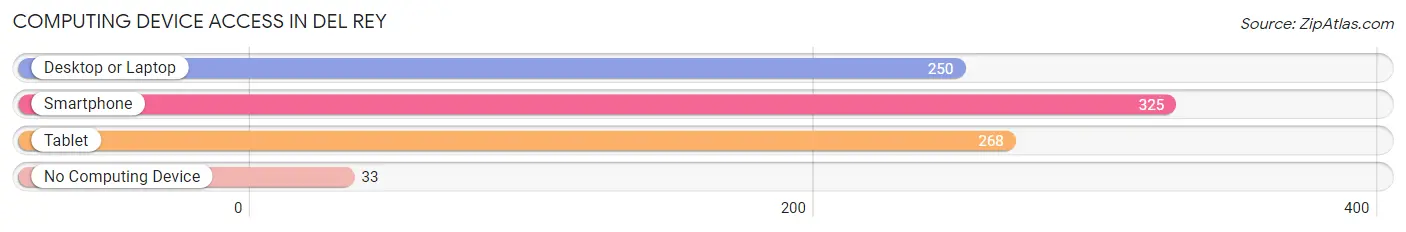
| Device Type | # Households | % Households |
| Desktop or Laptop | 250 | 62.7% |
| Smartphone | 325 | 81.5% |
| Tablet | 268 | 67.2% |
| No Computing Device | 33 | 8.3% |
| Total | 399 | 100.0% |
Internet Access in Del Rey
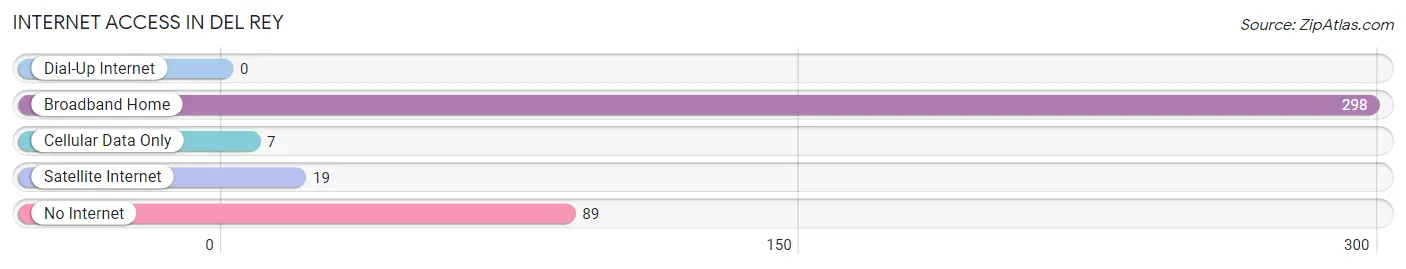
| Internet Type | # Households | % Households |
| Dial-Up Internet | 0 | 0.0% |
| Broadband Home | 298 | 74.7% |
| Cellular Data Only | 7 | 1.8% |
| Satellite Internet | 19 | 4.8% |
| No Internet | 89 | 22.3% |
| Total | 399 | 100.0% |
Del Rey Summary
Rey, CA is a small unincorporated community located in Los Angeles County, California. It is situated in the Santa Monica Mountains, just north of the Pacific Ocean. The community is bordered by the cities of Malibu, Topanga, and Pacific Palisades. The population of Del Rey was estimated to be around 2,000 in 2000.
History
Del Rey was originally part of the Rancho Topanga Malibu Sequit, a Mexican land grant given to Francisco Sepulveda in 1839. The area was later developed by the Del Rey Land Company in the late 19th century. The company was founded by William Workman and his son-in-law, F.P.F. Temple, who purchased the land from the Sepulveda family. The Del Rey Land Company built a railroad line to connect the area to Los Angeles, and the community was named after the company.
In the early 20th century, Del Rey was a popular destination for Hollywood celebrities, who built large estates in the area. The community was also home to a number of small farms and ranches.
Geography
Del Rey is located in the Santa Monica Mountains, just north of the Pacific Ocean. The community is bordered by the cities of Malibu, Topanga, and Pacific Palisades. The area is characterized by rolling hills and canyons, with elevations ranging from sea level to 1,000 feet.
The climate in Del Rey is Mediterranean, with mild, wet winters and hot, dry summers. The average annual precipitation is around 15 inches.
Economy
The economy of Del Rey is largely based on tourism and real estate. The area is home to a number of luxury homes and estates, as well as several small businesses. The community is also home to a number of film and television production companies.
Demographics
The population of Del Rey was estimated to be around 2,000 in 2000. The racial makeup of the community was 79.3% White, 8.2% Asian, 6.2% Hispanic or Latino, and 4.3% African American. The median household income was $75,000, and the median home value was $1.2 million.
Del Rey is a small, close-knit community with a strong sense of community. The area is home to a number of parks and recreational facilities, as well as a number of churches and schools. The community is also home to a number of art galleries and cultural events.
Common Questions
What is Per Capita Income in Del Rey?
Per Capita income in Del Rey is $17,196.
What is the Median Family Income in Del Rey?
Median Family Income in Del Rey is $50,000.
What is the Median Household income in Del Rey?
Median Household Income in Del Rey is $48,897.
What is Income or Wage Gap in Del Rey?
Income or Wage Gap in Del Rey is 66.0%.
Women in Del Rey earn 34.0 cents for every dollar earned by a man.
What is Family Income Deficit in Del Rey?
Family Income Deficit in Del Rey is $6,926.
Families that are below poverty line in Del Rey earn $6,926 less on average than the poverty threshold level.
What is Inequality or Gini Index in Del Rey?
Inequality or Gini Index in Del Rey is 0.43.
What is the Total Population of Del Rey?
Total Population of Del Rey is 1,491.
What is the Total Male Population of Del Rey?
Total Male Population of Del Rey is 715.
What is the Total Female Population of Del Rey?
Total Female Population of Del Rey is 776.
What is the Ratio of Males per 100 Females in Del Rey?
There are 92.14 Males per 100 Females in Del Rey.
What is the Ratio of Females per 100 Males in Del Rey?
There are 108.53 Females per 100 Males in Del Rey.
What is the Median Population Age in Del Rey?
Median Population Age in Del Rey is 30.9 Years.
What is the Average Family Size in Del Rey
Average Family Size in Del Rey is 3.8 People.
What is the Average Household Size in Del Rey
Average Household Size in Del Rey is 3.7 People.
How Large is the Labor Force in Del Rey?
There are 694 People in the Labor Forcein in Del Rey.
What is the Percentage of People in the Labor Force in Del Rey?
61.8% of People are in the Labor Force in Del Rey.
What is the Unemployment Rate in Del Rey?
Unemployment Rate in Del Rey is 12.1%.