Zip Codes with the Highest Percentage of Population with a Degree in Liberal Arts and History in Culver City, CA
RELATED REPORTS & OPTIONS
Liberal Arts and History
Culver City
Compare Zip Codes
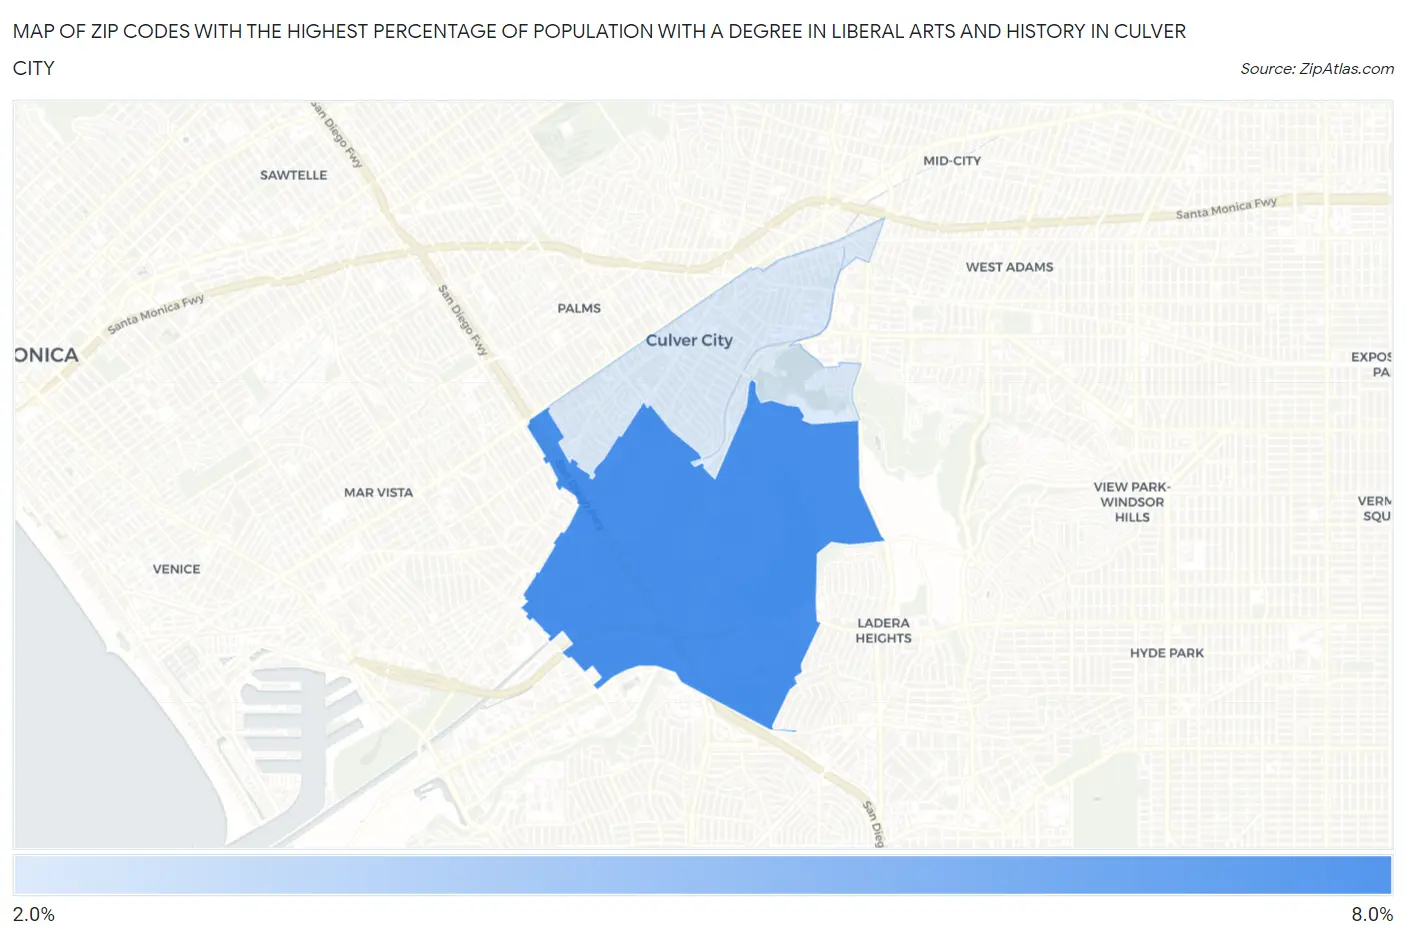
Map of Zip Codes with the Highest Percentage of Population with a Degree in Liberal Arts and History in Culver City
3.0%
7.0%
Zip Codes with the Highest Percentage of Population with a Degree in Liberal Arts and History in Culver City, CA
| Zip Code | % Graduates | vs State | vs National | |
| 1. | 90230 | 7.0% | 5.5%(+1.47)#540 | 4.9%(+2.10)#6,443 |
| 2. | 90232 | 3.0% | 5.5%(-2.53)#1,354 | 4.9%(-1.91)#18,479 |
1
Common Questions
What are the Top Zip Codes with the Highest Percentage of Population with a Degree in Liberal Arts and History in Culver City, CA?
Top Zip Codes with the Highest Percentage of Population with a Degree in Liberal Arts and History in Culver City, CA are:
What zip code has the Highest Percentage of Population with a Degree in Liberal Arts and History in Culver City, CA?
90230 has the Highest Percentage of Population with a Degree in Liberal Arts and History in Culver City, CA with 7.0%.
What is the Percentage of Population with a Degree in Liberal Arts and History in Culver City, CA?
Percentage of Population with a Degree in Liberal Arts and History in Culver City is 6.0%.
What is the Percentage of Population with a Degree in Liberal Arts and History in California?
Percentage of Population with a Degree in Liberal Arts and History in California is 5.5%.
What is the Percentage of Population with a Degree in Liberal Arts and History in the United States?
Percentage of Population with a Degree in Liberal Arts and History in the United States is 4.9%.