Wheatland, CA Map & Demographics
Wheatland Map
Wheatland Overview
$35,512
PER CAPITA INCOME
$82,879
AVG FAMILY INCOME
$76,991
AVG HOUSEHOLD INCOME
4.0%
WAGE / INCOME GAP [ % ]
96.0¢/ $1
WAGE / INCOME GAP [ $ ]
0.40
INEQUALITY / GINI INDEX
3,702
TOTAL POPULATION
1,708
MALE POPULATION
1,994
FEMALE POPULATION
85.66
MALES / 100 FEMALES
116.74
FEMALES / 100 MALES
39.1
MEDIAN AGE
3.1
AVG FAMILY SIZE
2.9
AVG HOUSEHOLD SIZE
1,729
LABOR FORCE [ PEOPLE ]
64.0%
PERCENT IN LABOR FORCE
3.3%
UNEMPLOYMENT RATE
Wheatland Zip Codes
Wheatland Area Codes
Income in Wheatland
Income Overview in Wheatland
Per Capita Income in Wheatland is $35,512, while median incomes of families and households are $82,879 and $76,991 respectively.
| Characteristic | Number | Measure |
| Per Capita Income | 3,702 | $35,512 |
| Median Family Income | 1,048 | $82,879 |
| Mean Family Income | 1,048 | $97,006 |
| Median Household Income | 1,287 | $76,991 |
| Mean Household Income | 1,287 | $92,271 |
| Income Deficit | 1,048 | $0 |
| Wage / Income Gap (%) | 3,702 | 4.01% |
| Wage / Income Gap ($) | 3,702 | 95.99¢ per $1 |
| Gini / Inequality Index | 3,702 | 0.40 |
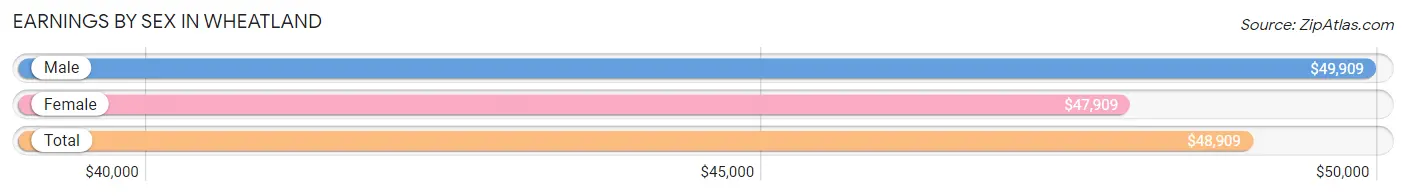
Earnings by Sex in Wheatland
Average Earnings in Wheatland are $48,909, $49,909 for men and $47,909 for women, a difference of 4.0%.
| Sex | Number | Average Earnings |
| Male | 848 (47.9%) | $49,909 |
| Female | 922 (52.1%) | $47,909 |
| Total | 1,770 (100.0%) | $48,909 |
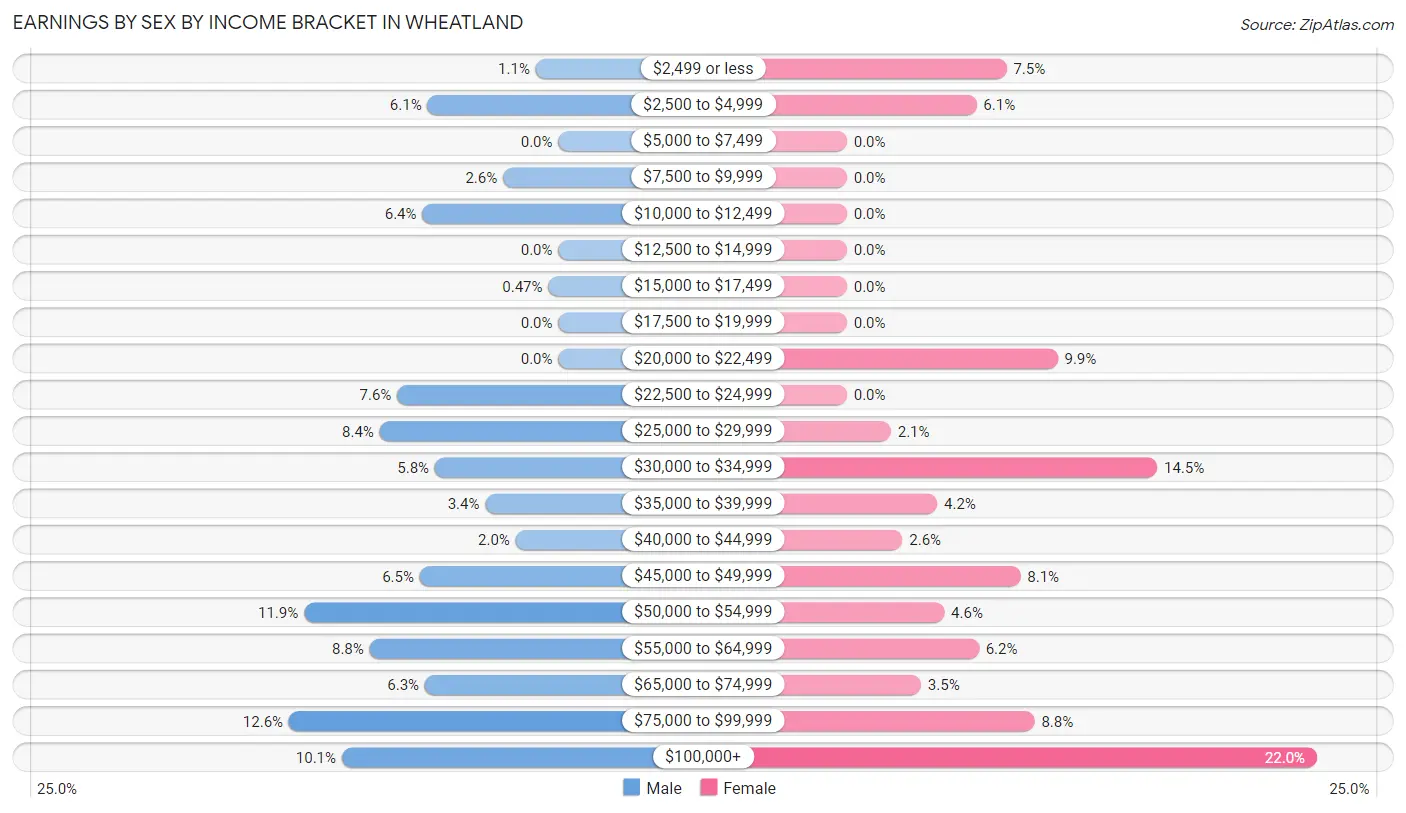
Earnings by Sex by Income Bracket in Wheatland
The most common earnings brackets in Wheatland are $75,000 to $99,999 for men (107 | 12.6%) and $100,000+ for women (203 | 22.0%).
| Income | Male | Female |
| $2,499 or less | 9 (1.1%) | 69 (7.5%) |
| $2,500 to $4,999 | 52 (6.1%) | 56 (6.1%) |
| $5,000 to $7,499 | 0 (0.0%) | 0 (0.0%) |
| $7,500 to $9,999 | 22 (2.6%) | 0 (0.0%) |
| $10,000 to $12,499 | 54 (6.4%) | 0 (0.0%) |
| $12,500 to $14,999 | 0 (0.0%) | 0 (0.0%) |
| $15,000 to $17,499 | 4 (0.5%) | 0 (0.0%) |
| $17,500 to $19,999 | 0 (0.0%) | 0 (0.0%) |
| $20,000 to $22,499 | 0 (0.0%) | 91 (9.9%) |
| $22,500 to $24,999 | 64 (7.5%) | 0 (0.0%) |
| $25,000 to $29,999 | 71 (8.4%) | 19 (2.1%) |
| $30,000 to $34,999 | 49 (5.8%) | 134 (14.5%) |
| $35,000 to $39,999 | 29 (3.4%) | 39 (4.2%) |
| $40,000 to $44,999 | 17 (2.0%) | 24 (2.6%) |
| $45,000 to $49,999 | 55 (6.5%) | 75 (8.1%) |
| $50,000 to $54,999 | 101 (11.9%) | 42 (4.6%) |
| $55,000 to $64,999 | 75 (8.8%) | 57 (6.2%) |
| $65,000 to $74,999 | 53 (6.2%) | 32 (3.5%) |
| $75,000 to $99,999 | 107 (12.6%) | 81 (8.8%) |
| $100,000+ | 86 (10.1%) | 203 (22.0%) |
| Total | 848 (100.0%) | 922 (100.0%) |
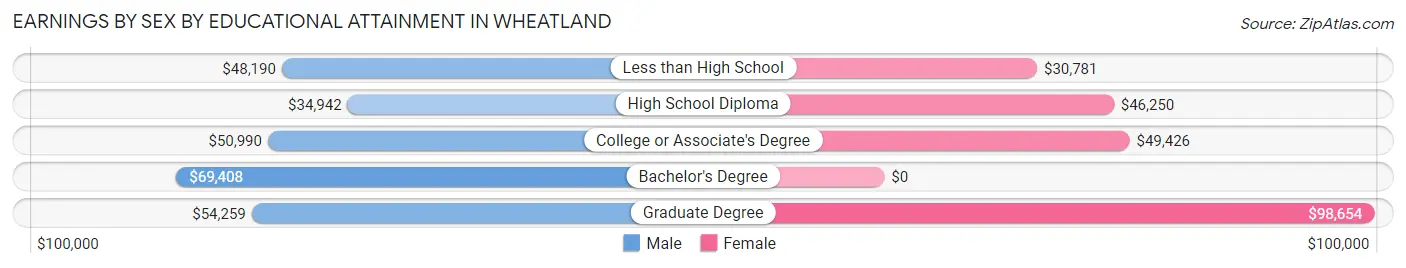
Earnings by Sex by Educational Attainment in Wheatland
Average earnings in Wheatland are $51,786 for men and $52,679 for women, a difference of 1.7%. Men with an educational attainment of bachelor's degree enjoy the highest average annual earnings of $69,408, while those with high school diploma education earn the least with $34,942. Women with an educational attainment of graduate degree earn the most with the average annual earnings of $98,654, while those with less than high school education have the smallest earnings of $30,781.
| Educational Attainment | Male Income | Female Income |
| Less than High School | $48,190 | $30,781 |
| High School Diploma | $34,942 | $46,250 |
| College or Associate's Degree | $50,990 | $49,426 |
| Bachelor's Degree | $69,408 | $0 |
| Graduate Degree | $54,259 | $98,654 |
| Total | $51,786 | $52,679 |
Family Income in Wheatland
Family Income Brackets in Wheatland
According to the Wheatland family income data, there are 261 families falling into the $100,000 to $149,999 income range, which is the most common income bracket and makes up 24.9% of all families. Conversely, the $10,000 to $14,999 income bracket is the least frequent group with only 6 families (0.6%) belonging to this category.
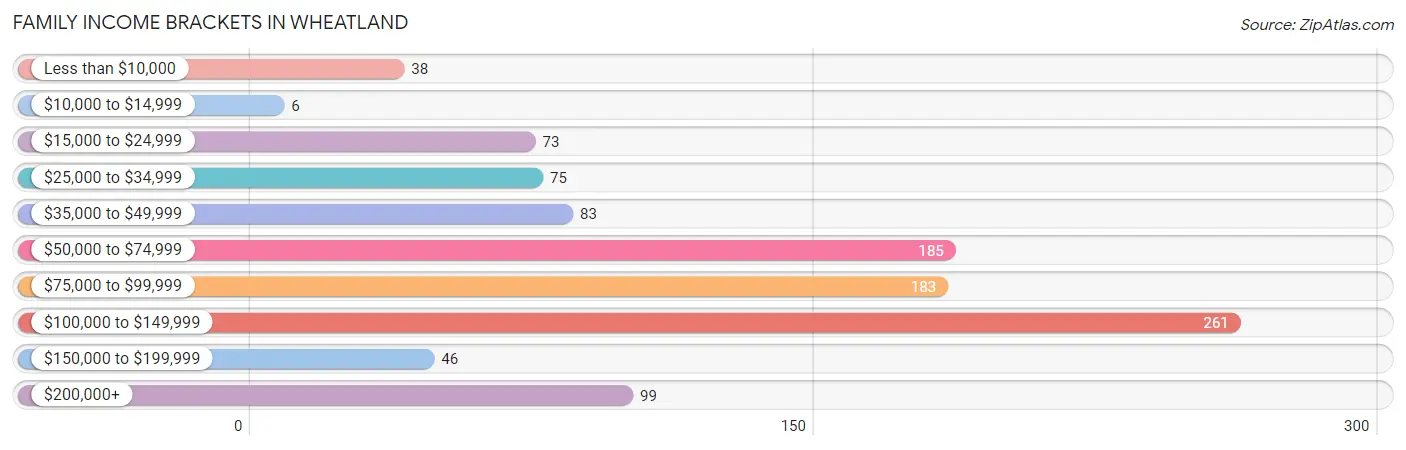
| Income Bracket | # Families | % Families |
| Less than $10,000 | 38 | 3.6% |
| $10,000 to $14,999 | 6 | 0.6% |
| $15,000 to $24,999 | 73 | 7.0% |
| $25,000 to $34,999 | 75 | 7.2% |
| $35,000 to $49,999 | 83 | 7.9% |
| $50,000 to $74,999 | 185 | 17.7% |
| $75,000 to $99,999 | 183 | 17.5% |
| $100,000 to $149,999 | 261 | 24.9% |
| $150,000 to $199,999 | 46 | 4.4% |
| $200,000+ | 99 | 9.4% |
Family Income by Famaliy Size in Wheatland
3-person families (288 | 27.5%) account for the highest median family income in Wheatland with $90,000 per family, while 2-person families (469 | 44.8%) have the highest median income of $42,472 per family member.
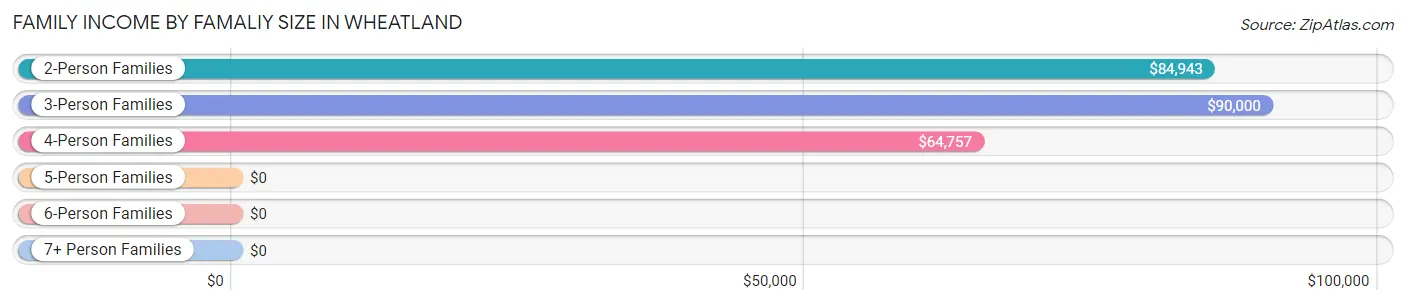
| Income Bracket | # Families | Median Income |
| 2-Person Families | 469 (44.8%) | $84,943 |
| 3-Person Families | 288 (27.5%) | $90,000 |
| 4-Person Families | 268 (25.6%) | $64,757 |
| 5-Person Families | 23 (2.2%) | $0 |
| 6-Person Families | 0 (0.0%) | $0 |
| 7+ Person Families | 0 (0.0%) | $0 |
| Total | 1,048 (100.0%) | $82,879 |
Family Income by Number of Earners in Wheatland
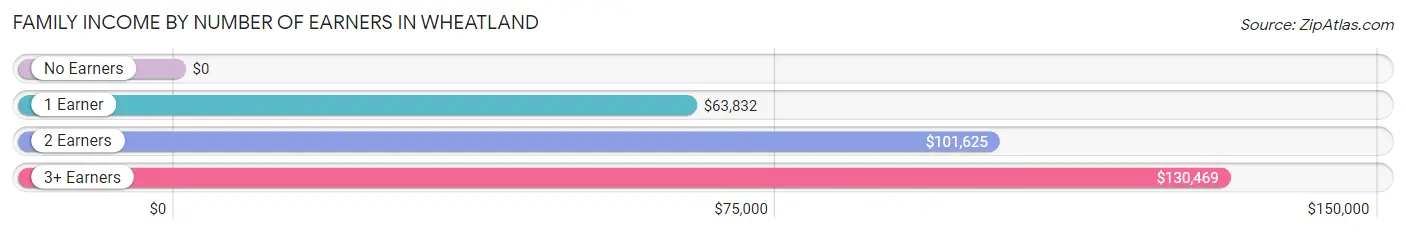
| Number of Earners | # Families | Median Income |
| No Earners | 143 (13.7%) | $0 |
| 1 Earner | 491 (46.9%) | $63,832 |
| 2 Earners | 332 (31.7%) | $101,625 |
| 3+ Earners | 82 (7.8%) | $130,469 |
| Total | 1,048 (100.0%) | $82,879 |
Household Income in Wheatland
Household Income Brackets in Wheatland
With 268 households falling in the category, the $100,000 to $149,999 income range is the most frequent in Wheatland, accounting for 20.8% of all households. In contrast, only 36 households (2.8%) fall into the $10,000 to $14,999 income bracket, making it the least populous group.
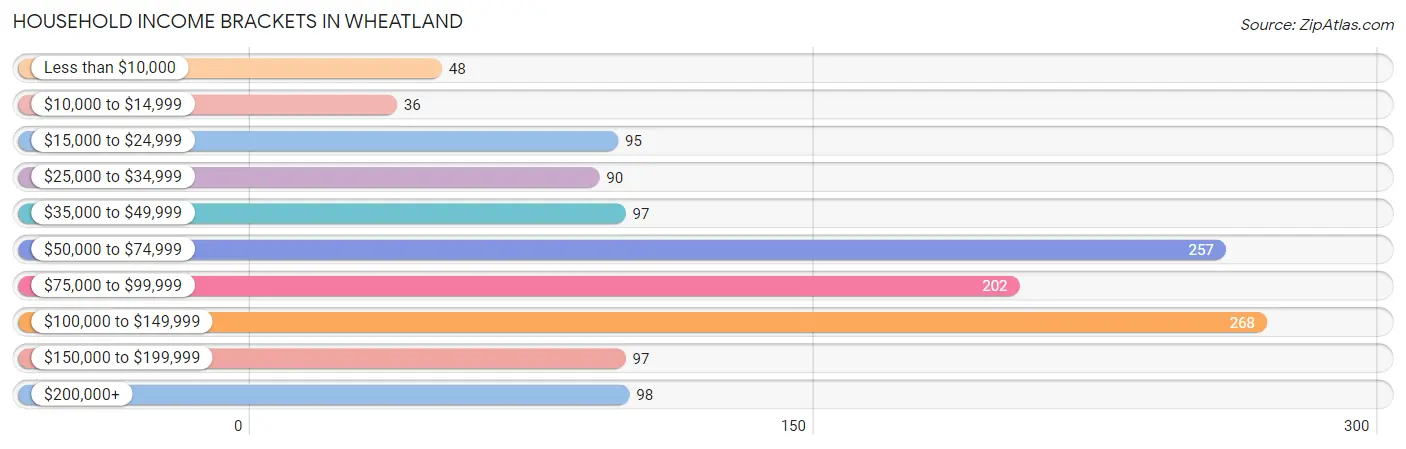
| Income Bracket | # Households | % Households |
| Less than $10,000 | 48 | 3.7% |
| $10,000 to $14,999 | 36 | 2.8% |
| $15,000 to $24,999 | 95 | 7.4% |
| $25,000 to $34,999 | 90 | 7.0% |
| $35,000 to $49,999 | 97 | 7.5% |
| $50,000 to $74,999 | 257 | 20.0% |
| $75,000 to $99,999 | 202 | 15.7% |
| $100,000 to $149,999 | 268 | 20.8% |
| $150,000 to $199,999 | 97 | 7.5% |
| $200,000+ | 98 | 7.6% |
Household Income by Householder Age in Wheatland
The median household income in Wheatland is $76,991, with the highest median household income of $104,286 found in the 45 to 64 years age bracket for the primary householder. A total of 412 households (32.0%) fall into this category. Meanwhile, the 15 to 24 years age bracket for the primary householder has the lowest median household income of $0, with 30 households (2.3%) in this group.
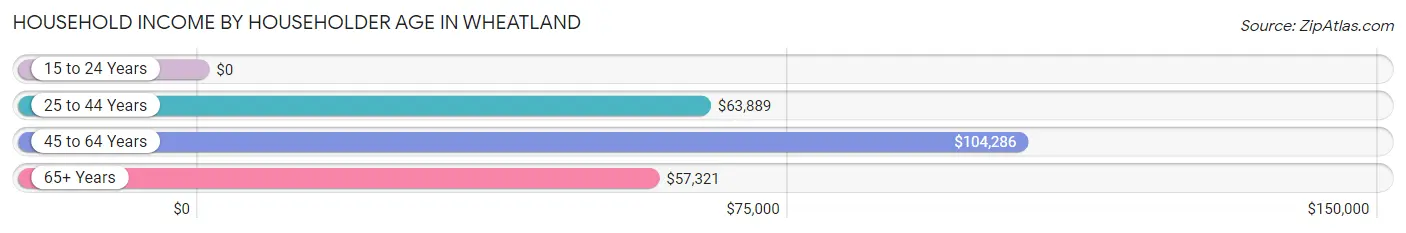
| Income Bracket | # Households | Median Income |
| 15 to 24 Years | 30 (2.3%) | $0 |
| 25 to 44 Years | 612 (47.5%) | $63,889 |
| 45 to 64 Years | 412 (32.0%) | $104,286 |
| 65+ Years | 233 (18.1%) | $57,321 |
| Total | 1,287 (100.0%) | $76,991 |
Poverty in Wheatland
Income Below Poverty by Sex and Age in Wheatland
With 6.4% poverty level for males and 5.0% for females among the residents of Wheatland, 12 to 14 year old males and 18 to 24 year old females are the most vulnerable to poverty, with 41 males (16.6%) and 15 females (23.4%) in their respective age groups living below the poverty level.
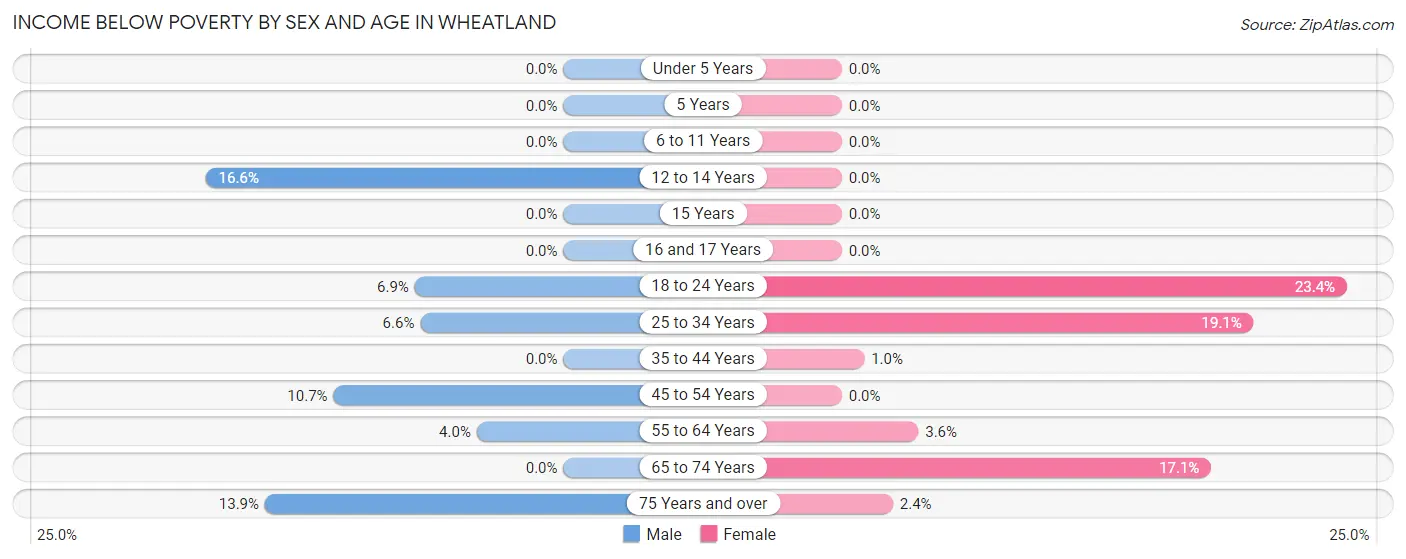
| Age Bracket | Male | Female |
| Under 5 Years | 0 (0.0%) | 0 (0.0%) |
| 5 Years | 0 (0.0%) | 0 (0.0%) |
| 6 to 11 Years | 0 (0.0%) | 0 (0.0%) |
| 12 to 14 Years | 41 (16.6%) | 0 (0.0%) |
| 15 Years | 0 (0.0%) | 0 (0.0%) |
| 16 and 17 Years | 0 (0.0%) | 0 (0.0%) |
| 18 to 24 Years | 4 (6.9%) | 15 (23.4%) |
| 25 to 34 Years | 15 (6.6%) | 47 (19.1%) |
| 35 to 44 Years | 0 (0.0%) | 4 (1.0%) |
| 45 to 54 Years | 16 (10.7%) | 0 (0.0%) |
| 55 to 64 Years | 15 (4.0%) | 11 (3.5%) |
| 65 to 74 Years | 0 (0.0%) | 18 (17.1%) |
| 75 Years and over | 18 (13.9%) | 4 (2.4%) |
| Total | 109 (6.4%) | 99 (5.0%) |
Income Above Poverty by Sex and Age in Wheatland
According to the poverty statistics in Wheatland, males aged under 5 years and females aged under 5 years are the age groups that are most secure financially, with 100.0% of males and 100.0% of females in these age groups living above the poverty line.
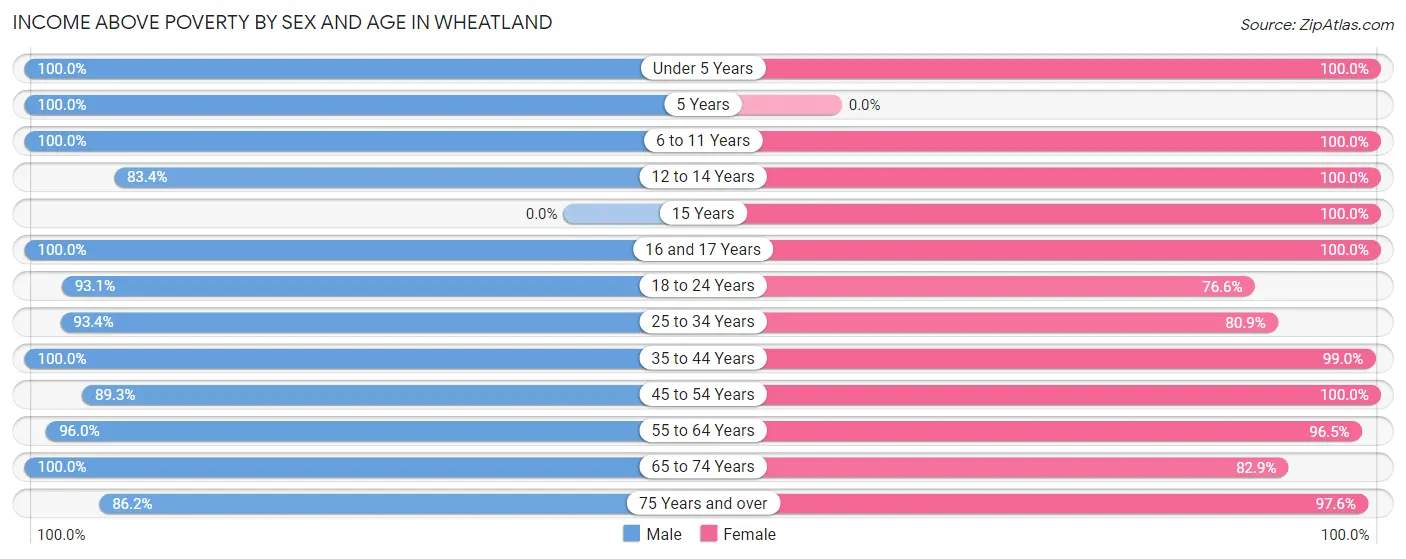
| Age Bracket | Male | Female |
| Under 5 Years | 68 (100.0%) | 83 (100.0%) |
| 5 Years | 13 (100.0%) | 0 (0.0%) |
| 6 to 11 Years | 93 (100.0%) | 215 (100.0%) |
| 12 to 14 Years | 206 (83.4%) | 187 (100.0%) |
| 15 Years | 0 (0.0%) | 80 (100.0%) |
| 16 and 17 Years | 25 (100.0%) | 34 (100.0%) |
| 18 to 24 Years | 54 (93.1%) | 49 (76.6%) |
| 25 to 34 Years | 211 (93.4%) | 199 (80.9%) |
| 35 to 44 Years | 271 (100.0%) | 380 (99.0%) |
| 45 to 54 Years | 134 (89.3%) | 103 (100.0%) |
| 55 to 64 Years | 358 (96.0%) | 299 (96.5%) |
| 65 to 74 Years | 54 (100.0%) | 87 (82.9%) |
| 75 Years and over | 112 (86.2%) | 165 (97.6%) |
| Total | 1,599 (93.6%) | 1,881 (95.0%) |
Income Below Poverty Among Married-Couple Families in Wheatland
The poverty statistics for married-couple families in Wheatland show that 0.9% or 6 of the total 684 families live below the poverty line. Families with no children have the highest poverty rate of 1.5%, comprising of 6 families. On the other hand, families with 1 or 2 children have the lowest poverty rate of 0.0%, which includes 0 families.
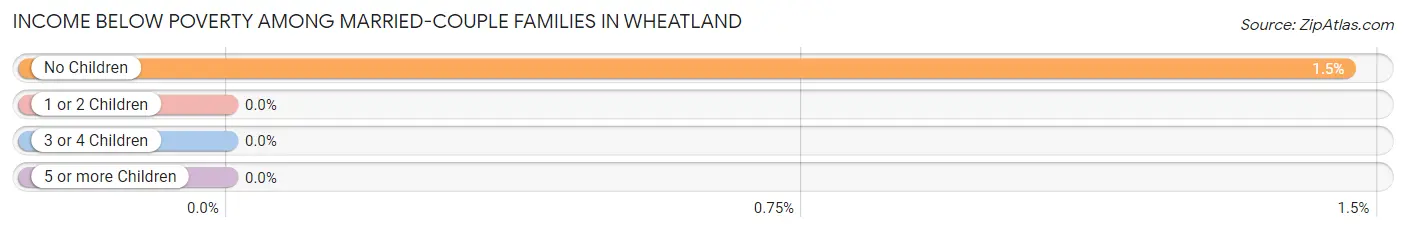
| Children | Above Poverty | Below Poverty |
| No Children | 405 (98.5%) | 6 (1.5%) |
| 1 or 2 Children | 250 (100.0%) | 0 (0.0%) |
| 3 or 4 Children | 23 (100.0%) | 0 (0.0%) |
| 5 or more Children | 0 (0.0%) | 0 (0.0%) |
| Total | 678 (99.1%) | 6 (0.9%) |
Income Below Poverty Among Single-Parent Households in Wheatland
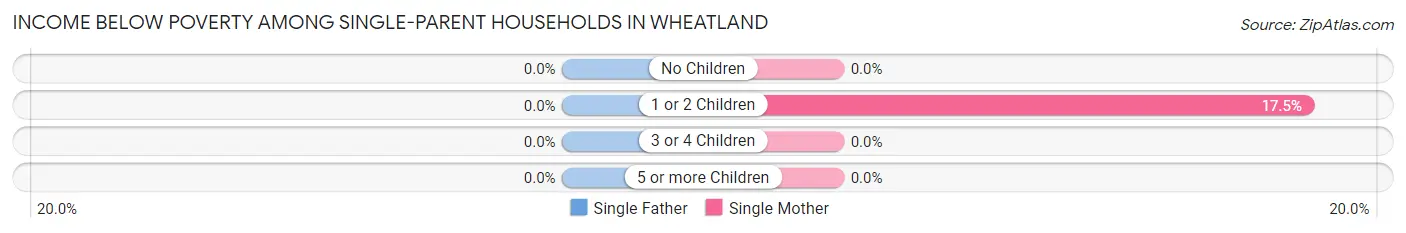
| Children | Single Father | Single Mother |
| No Children | 0 (0.0%) | 0 (0.0%) |
| 1 or 2 Children | 0 (0.0%) | 38 (17.5%) |
| 3 or 4 Children | 0 (0.0%) | 0 (0.0%) |
| 5 or more Children | 0 (0.0%) | 0 (0.0%) |
| Total | 0 (0.0%) | 38 (12.5%) |
Income Below Poverty Among Married-Couple vs Single-Parent Households in Wheatland
The poverty data for Wheatland shows that 6 of the married-couple family households (0.9%) and 38 of the single-parent households (10.4%) are living below the poverty level. Within the married-couple family households, those with no children have the highest poverty rate, with 6 households (1.5%) falling below the poverty line. Among the single-parent households, those with 1 or 2 children have the highest poverty rate, with 38 household (14.4%) living below poverty.
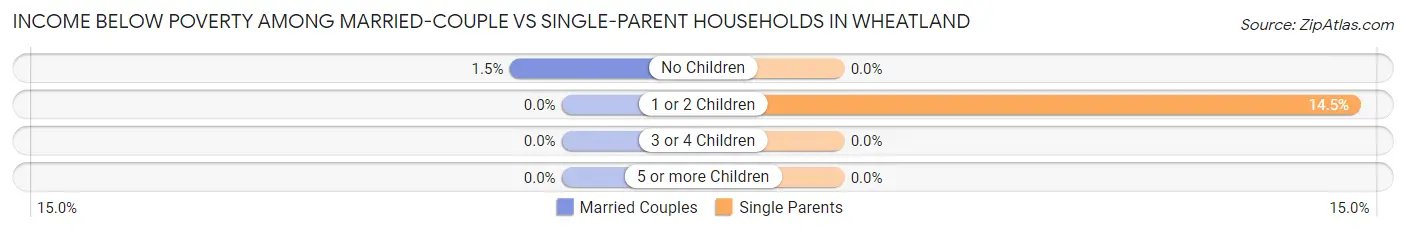
| Children | Married-Couple Families | Single-Parent Households |
| No Children | 6 (1.5%) | 0 (0.0%) |
| 1 or 2 Children | 0 (0.0%) | 38 (14.4%) |
| 3 or 4 Children | 0 (0.0%) | 0 (0.0%) |
| 5 or more Children | 0 (0.0%) | 0 (0.0%) |
| Total | 6 (0.9%) | 38 (10.4%) |
Race in Wheatland
The most populous races in Wheatland are White / Caucasian (3,110 | 84.0%), Hispanic or Latino (705 | 19.0%), and Two or more Races (395 | 10.7%).
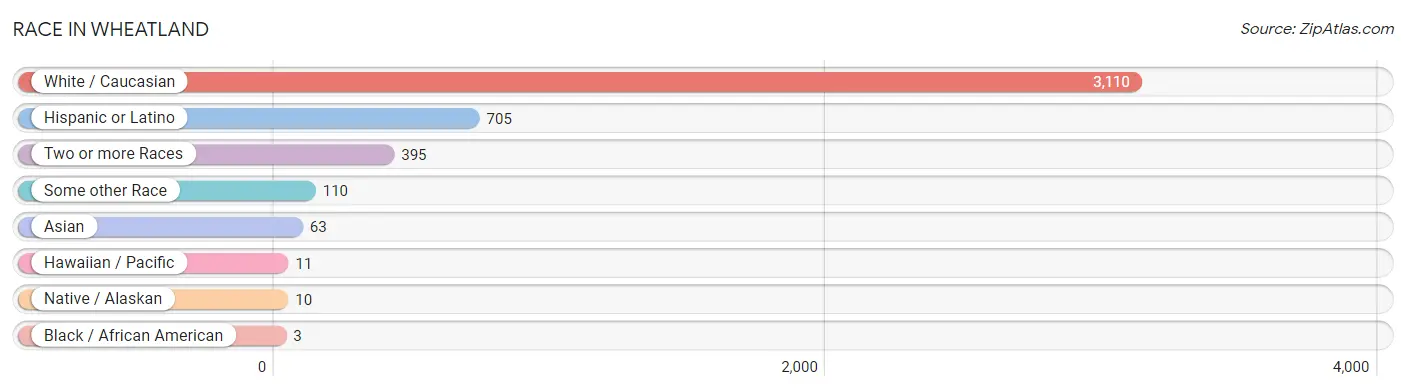
| Race | # Population | % Population |
| Asian | 63 | 1.7% |
| Black / African American | 3 | 0.1% |
| Hawaiian / Pacific | 11 | 0.3% |
| Hispanic or Latino | 705 | 19.0% |
| Native / Alaskan | 10 | 0.3% |
| White / Caucasian | 3,110 | 84.0% |
| Two or more Races | 395 | 10.7% |
| Some other Race | 110 | 3.0% |
| Total | 3,702 | 100.0% |
Ancestry in Wheatland
The most populous ancestries reported in Wheatland are German (701 | 18.9%), Mexican (399 | 10.8%), Italian (290 | 7.8%), English (289 | 7.8%), and French (270 | 7.3%), together accounting for 52.6% of all Wheatland residents.
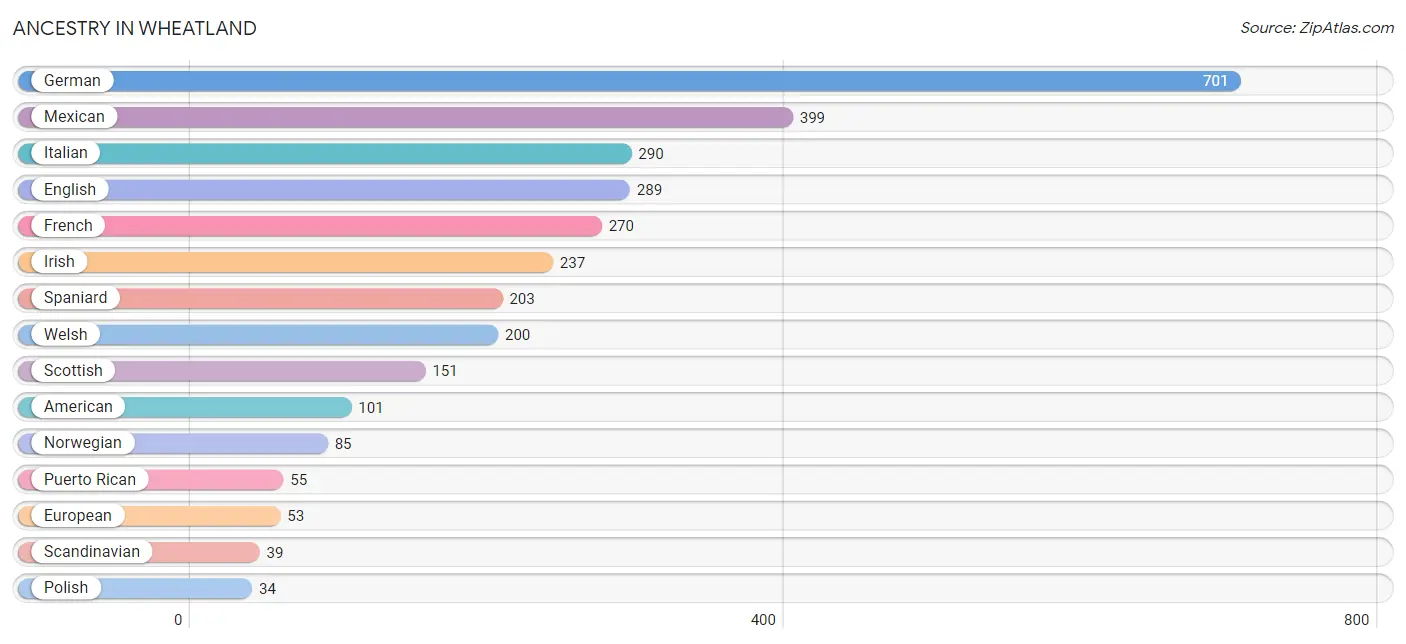
| Ancestry | # Population | % Population |
| American | 101 | 2.7% |
| Apache | 18 | 0.5% |
| Bhutanese | 25 | 0.7% |
| Burmese | 26 | 0.7% |
| Canadian | 14 | 0.4% |
| Central American | 21 | 0.6% |
| Central American Indian | 23 | 0.6% |
| Cherokee | 14 | 0.4% |
| Czech | 19 | 0.5% |
| Dutch | 22 | 0.6% |
| Eastern European | 6 | 0.2% |
| English | 289 | 7.8% |
| European | 53 | 1.4% |
| French | 270 | 7.3% |
| French Canadian | 6 | 0.2% |
| German | 701 | 18.9% |
| Indian (Asian) | 4 | 0.1% |
| Iranian | 8 | 0.2% |
| Irish | 237 | 6.4% |
| Italian | 290 | 7.8% |
| Japanese | 23 | 0.6% |
| Korean | 27 | 0.7% |
| Mexican | 399 | 10.8% |
| Mexican American Indian | 4 | 0.1% |
| Native Hawaiian | 8 | 0.2% |
| Navajo | 6 | 0.2% |
| Norwegian | 85 | 2.3% |
| Polish | 34 | 0.9% |
| Puerto Rican | 55 | 1.5% |
| Salvadoran | 21 | 0.6% |
| Samoan | 11 | 0.3% |
| Scandinavian | 39 | 1.1% |
| Scotch-Irish | 15 | 0.4% |
| Scottish | 151 | 4.1% |
| Slovak | 6 | 0.2% |
| South American | 5 | 0.1% |
| Spaniard | 203 | 5.5% |
| Spanish | 22 | 0.6% |
| Swedish | 8 | 0.2% |
| Tongan | 8 | 0.2% |
| Venezuelan | 5 | 0.1% |
| Welsh | 200 | 5.4% | View All 42 Rows |
Immigrants in Wheatland
The most numerous immigrant groups reported in Wheatland came from Central America (152 | 4.1%), Latin America (152 | 4.1%), Mexico (142 | 3.8%), Asia (36 | 1.0%), and Eastern Asia (16 | 0.4%), together accounting for 13.5% of all Wheatland residents.
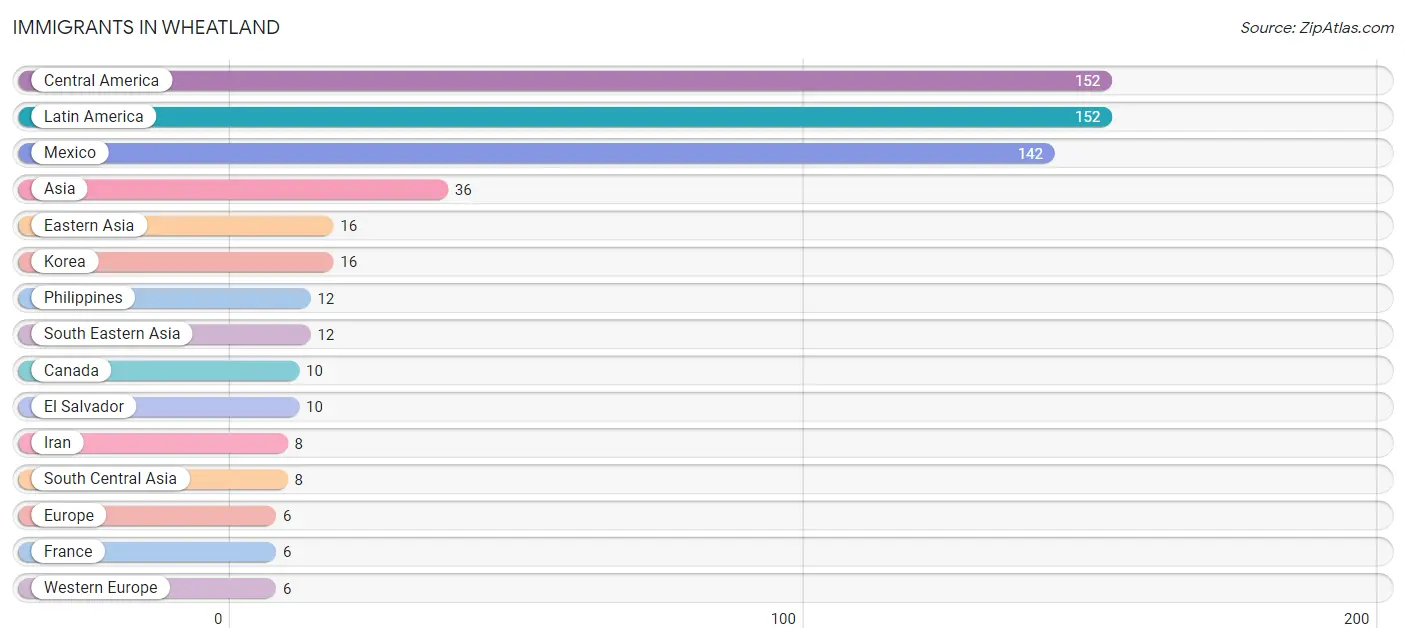
| Immigration Origin | # Population | % Population |
| Asia | 36 | 1.0% |
| Canada | 10 | 0.3% |
| Central America | 152 | 4.1% |
| Eastern Asia | 16 | 0.4% |
| El Salvador | 10 | 0.3% |
| Europe | 6 | 0.2% |
| France | 6 | 0.2% |
| Iran | 8 | 0.2% |
| Korea | 16 | 0.4% |
| Latin America | 152 | 4.1% |
| Mexico | 142 | 3.8% |
| Oceania | 3 | 0.1% |
| Philippines | 12 | 0.3% |
| South Central Asia | 8 | 0.2% |
| South Eastern Asia | 12 | 0.3% |
| Western Europe | 6 | 0.2% | View All 16 Rows |
Sex and Age in Wheatland
Sex and Age in Wheatland
The most populous age groups in Wheatland are 10 to 14 Years (278 | 16.3%) for men and 5 to 9 Years (215 | 10.8%) for women.
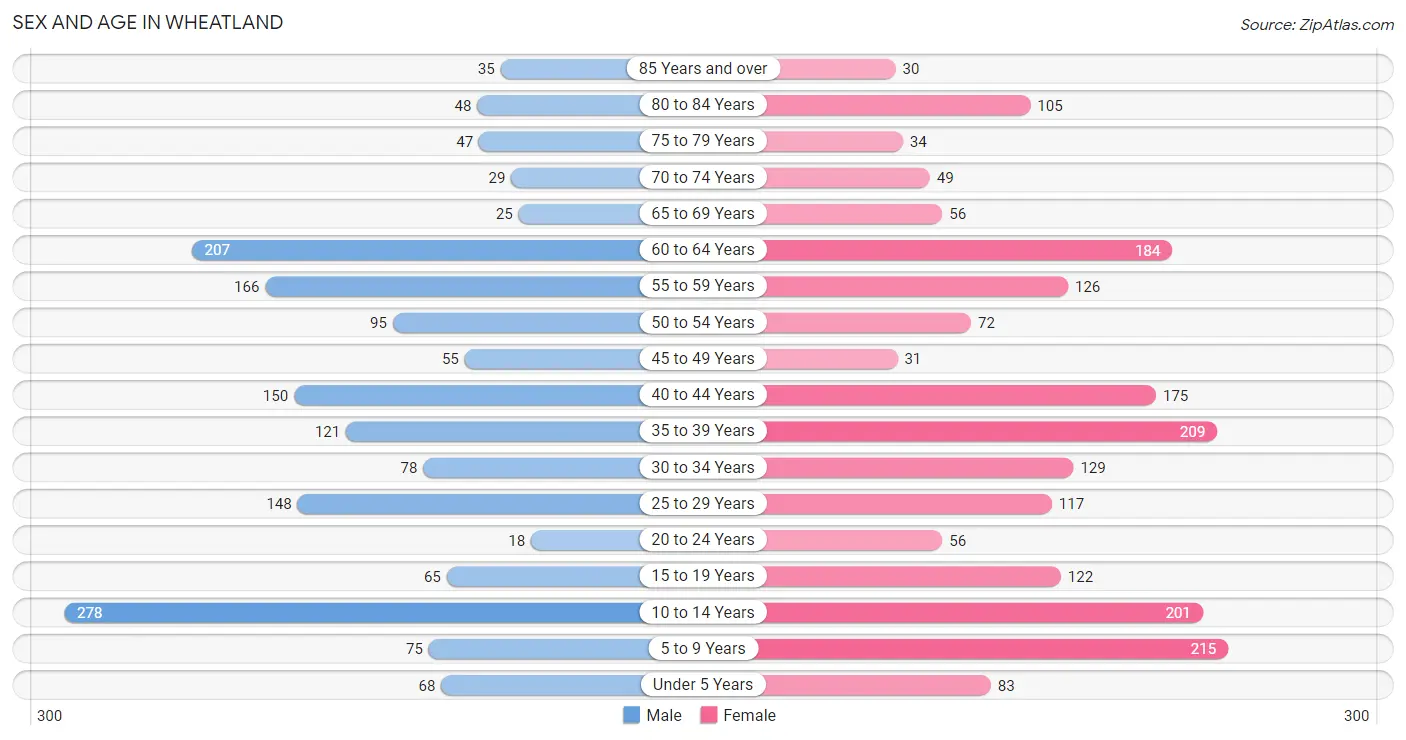
| Age Bracket | Male | Female |
| Under 5 Years | 68 (4.0%) | 83 (4.2%) |
| 5 to 9 Years | 75 (4.4%) | 215 (10.8%) |
| 10 to 14 Years | 278 (16.3%) | 201 (10.1%) |
| 15 to 19 Years | 65 (3.8%) | 122 (6.1%) |
| 20 to 24 Years | 18 (1.1%) | 56 (2.8%) |
| 25 to 29 Years | 148 (8.7%) | 117 (5.9%) |
| 30 to 34 Years | 78 (4.6%) | 129 (6.5%) |
| 35 to 39 Years | 121 (7.1%) | 209 (10.5%) |
| 40 to 44 Years | 150 (8.8%) | 175 (8.8%) |
| 45 to 49 Years | 55 (3.2%) | 31 (1.5%) |
| 50 to 54 Years | 95 (5.6%) | 72 (3.6%) |
| 55 to 59 Years | 166 (9.7%) | 126 (6.3%) |
| 60 to 64 Years | 207 (12.1%) | 184 (9.2%) |
| 65 to 69 Years | 25 (1.5%) | 56 (2.8%) |
| 70 to 74 Years | 29 (1.7%) | 49 (2.5%) |
| 75 to 79 Years | 47 (2.8%) | 34 (1.7%) |
| 80 to 84 Years | 48 (2.8%) | 105 (5.3%) |
| 85 Years and over | 35 (2.1%) | 30 (1.5%) |
| Total | 1,708 (100.0%) | 1,994 (100.0%) |
Families and Households in Wheatland
Median Family Size in Wheatland
The median family size in Wheatland is 3.15 persons per family, with married-couple families (684 | 65.3%) accounting for the largest median family size of 3.31 persons per family. On the other hand, single male/father families (59 | 5.6%) represent the smallest median family size with 2.03 persons per family.
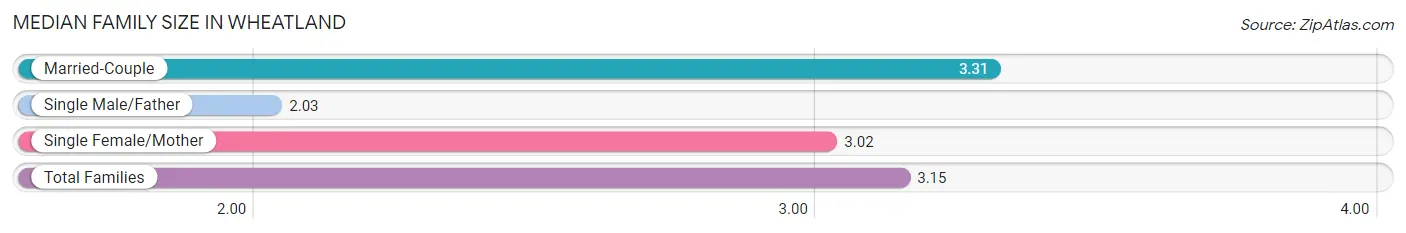
| Family Type | # Families | Family Size |
| Married-Couple | 684 (65.3%) | 3.31 |
| Single Male/Father | 59 (5.6%) | 2.03 |
| Single Female/Mother | 305 (29.1%) | 3.02 |
| Total Families | 1,048 (100.0%) | 3.15 |
Median Household Size in Wheatland
The median household size in Wheatland is 2.86 persons per household, with married-couple households (684 | 53.1%) accounting for the largest median household size of 3.31 persons per household. non-family households (239 | 18.6%) represent the smallest median household size with 1.03 persons per household.
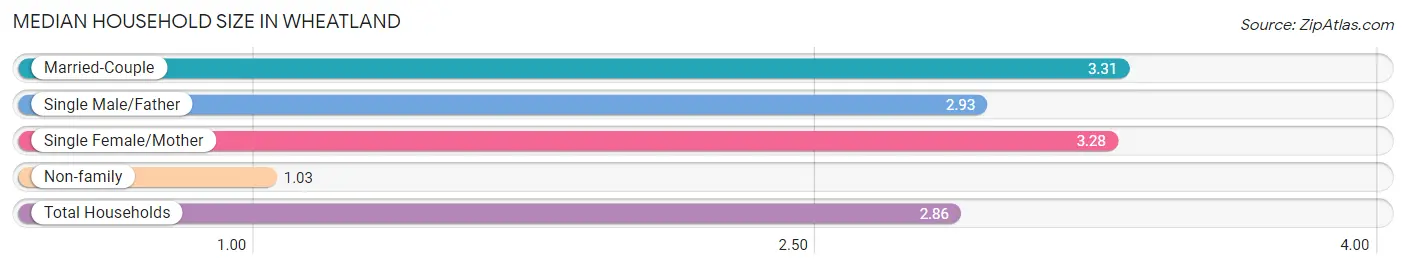
| Household Type | # Households | Household Size |
| Married-Couple | 684 (53.1%) | 3.31 |
| Single Male/Father | 59 (4.6%) | 2.93 |
| Single Female/Mother | 305 (23.7%) | 3.28 |
| Non-family | 239 (18.6%) | 1.03 |
| Total Households | 1,287 (100.0%) | 2.86 |
Household Size by Marriage Status in Wheatland
Out of a total of 1,287 households in Wheatland, 1,048 (81.4%) are family households, while 239 (18.6%) are nonfamily households. The most numerous type of family households are 2-person households, comprising 423, and the most common type of nonfamily households are 1-person households, comprising 235.
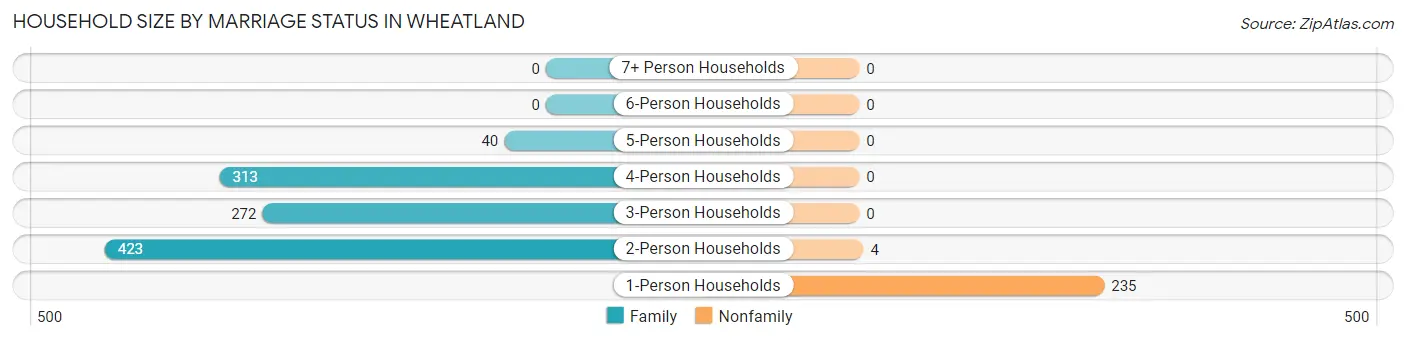
| Household Size | Family Households | Nonfamily Households |
| 1-Person Households | - | 235 (18.3%) |
| 2-Person Households | 423 (32.9%) | 4 (0.3%) |
| 3-Person Households | 272 (21.1%) | 0 (0.0%) |
| 4-Person Households | 313 (24.3%) | 0 (0.0%) |
| 5-Person Households | 40 (3.1%) | 0 (0.0%) |
| 6-Person Households | 0 (0.0%) | 0 (0.0%) |
| 7+ Person Households | 0 (0.0%) | 0 (0.0%) |
| Total | 1,048 (81.4%) | 239 (18.6%) |
Female Fertility in Wheatland
Fertility by Age in Wheatland
| Age Bracket | Women with Births | Births / 1,000 Women |
| 15 to 19 years | 0 (0.0%) | 0.0 |
| 20 to 34 years | 0 (0.0%) | 0.0 |
| 35 to 50 years | 0 (0.0%) | 0.0 |
| Total | 0 (0.0%) | 0.0 |
Fertility by Age by Marriage Status in Wheatland
| Age Bracket | Married | Unmarried |
| 15 to 19 years | 0 (0.0%) | 0 (0.0%) |
| 20 to 34 years | 0 (0.0%) | 0 (0.0%) |
| 35 to 50 years | 0 (0.0%) | 0 (0.0%) |
| Total | 0 (0.0%) | 0 (0.0%) |
Fertility by Education in Wheatland
| Educational Attainment | Women with Births | Births / 1,000 Women |
| Less than High School | 0 (0.0%) | 0.0 |
| High School Diploma | 0 (0.0%) | 0.0 |
| College or Associate's Degree | 0 (0.0%) | 0.0 |
| Bachelor's Degree | 0 (0.0%) | 0.0 |
| Graduate Degree | 0 (0.0%) | 0.0 |
| Total | 0 (0.0%) | 0.0 |
Fertility by Education by Marriage Status in Wheatland
| Educational Attainment | Married | Unmarried |
| Less than High School | 0 (0.0%) | 0 (0.0%) |
| High School Diploma | 0 (0.0%) | 0 (0.0%) |
| College or Associate's Degree | 0 (0.0%) | 0 (0.0%) |
| Bachelor's Degree | 0 (0.0%) | 0 (0.0%) |
| Graduate Degree | 0 (0.0%) | 0 (0.0%) |
| Total | 0 (0.0%) | 0 (0.0%) |
Employment Characteristics in Wheatland
Employment by Class of Employer in Wheatland
Among the 1,673 employed individuals in Wheatland, private company employees (1,139 | 68.1%), local government employees (219 | 13.1%), and self-employed (not incorporated) (82 | 4.9%) make up the most common classes of employment.
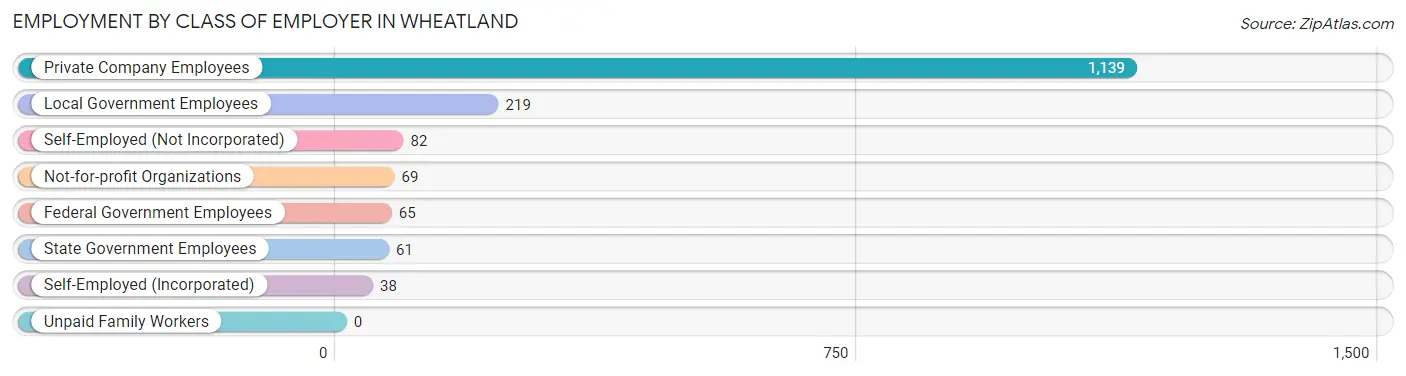
| Employer Class | # Employees | % Employees |
| Private Company Employees | 1,139 | 68.1% |
| Self-Employed (Incorporated) | 38 | 2.3% |
| Self-Employed (Not Incorporated) | 82 | 4.9% |
| Not-for-profit Organizations | 69 | 4.1% |
| Local Government Employees | 219 | 13.1% |
| State Government Employees | 61 | 3.6% |
| Federal Government Employees | 65 | 3.9% |
| Unpaid Family Workers | 0 | 0.0% |
| Total | 1,673 | 100.0% |
Employment Status by Age in Wheatland
According to the labor force statistics for Wheatland, out of the total population over 16 years of age (2,702), 64.0% or 1,729 individuals are in the labor force, with 3.3% or 57 of them unemployed. The age group with the highest labor force participation rate is 55 to 59 years, with 92.1% or 269 individuals in the labor force. Within the labor force, the 30 to 34 years age range has the highest percentage of unemployed individuals, with 23.5% or 38 of them being unemployed.
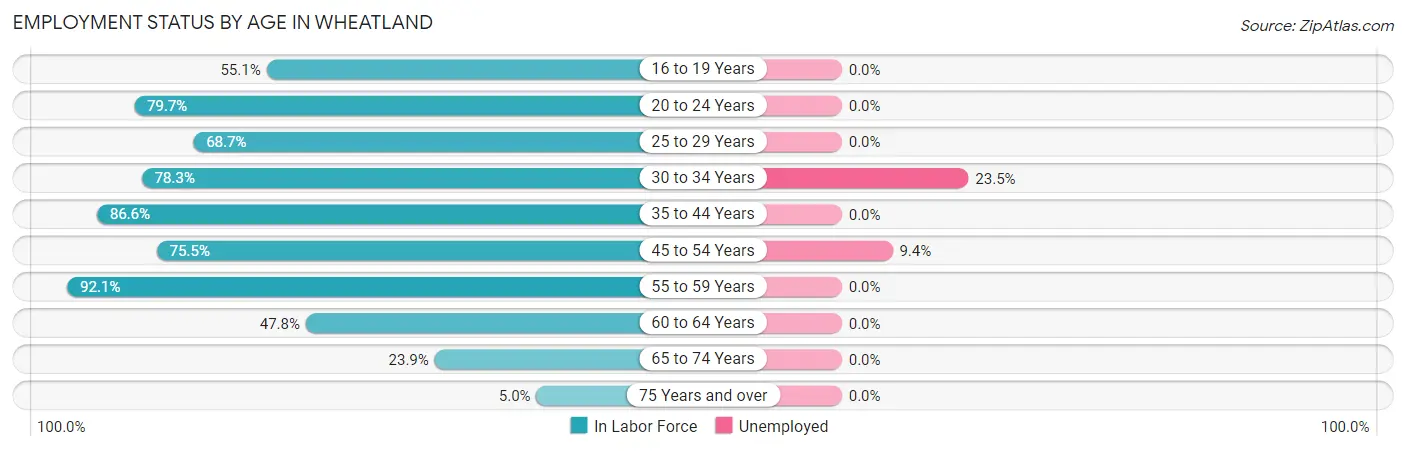
| Age Bracket | In Labor Force | Unemployed |
| 16 to 19 Years | 59 (55.1%) | 0 (0.0%) |
| 20 to 24 Years | 59 (79.7%) | 0 (0.0%) |
| 25 to 29 Years | 182 (68.7%) | 0 (0.0%) |
| 30 to 34 Years | 162 (78.3%) | 38 (23.5%) |
| 35 to 44 Years | 567 (86.6%) | 0 (0.0%) |
| 45 to 54 Years | 191 (75.5%) | 18 (9.4%) |
| 55 to 59 Years | 269 (92.1%) | 0 (0.0%) |
| 60 to 64 Years | 187 (47.8%) | 0 (0.0%) |
| 65 to 74 Years | 38 (23.9%) | 0 (0.0%) |
| 75 Years and over | 15 (5.0%) | 0 (0.0%) |
| Total | 1,729 (64.0%) | 57 (3.3%) |
Employment Status by Educational Attainment in Wheatland
According to labor force statistics for Wheatland, 75.5% of individuals (1,558) out of the total population between 25 and 64 years of age (2,063) are in the labor force, with 3.6% or 56 of them being unemployed. The group with the highest labor force participation rate are those with the educational attainment of less than high school, with 93.0% or 172 individuals in the labor force. Within the labor force, individuals with less than high school education have the highest percentage of unemployment, with 29.7% or 51 of them being unemployed.
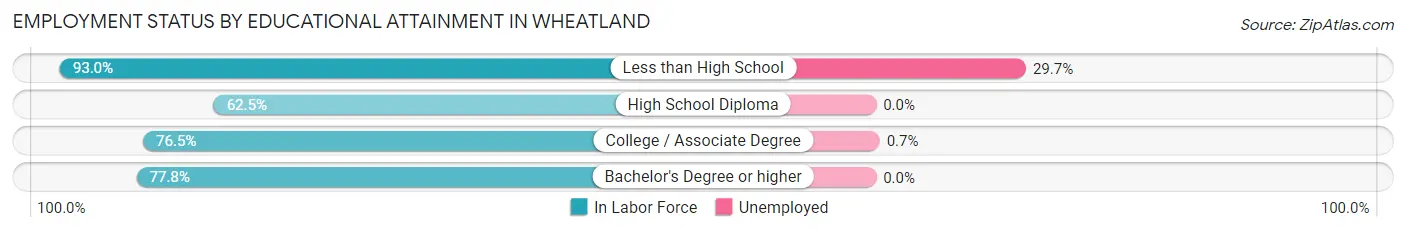
| Educational Attainment | In Labor Force | Unemployed |
| Less than High School | 172 (93.0%) | 55 (29.7%) |
| High School Diploma | 257 (62.5%) | 0 (0.0%) |
| College / Associate Degree | 753 (76.5%) | 7 (0.7%) |
| Bachelor's Degree or higher | 376 (77.8%) | 0 (0.0%) |
| Total | 1,558 (75.5%) | 74 (3.6%) |
Employment Occupations by Sex in Wheatland
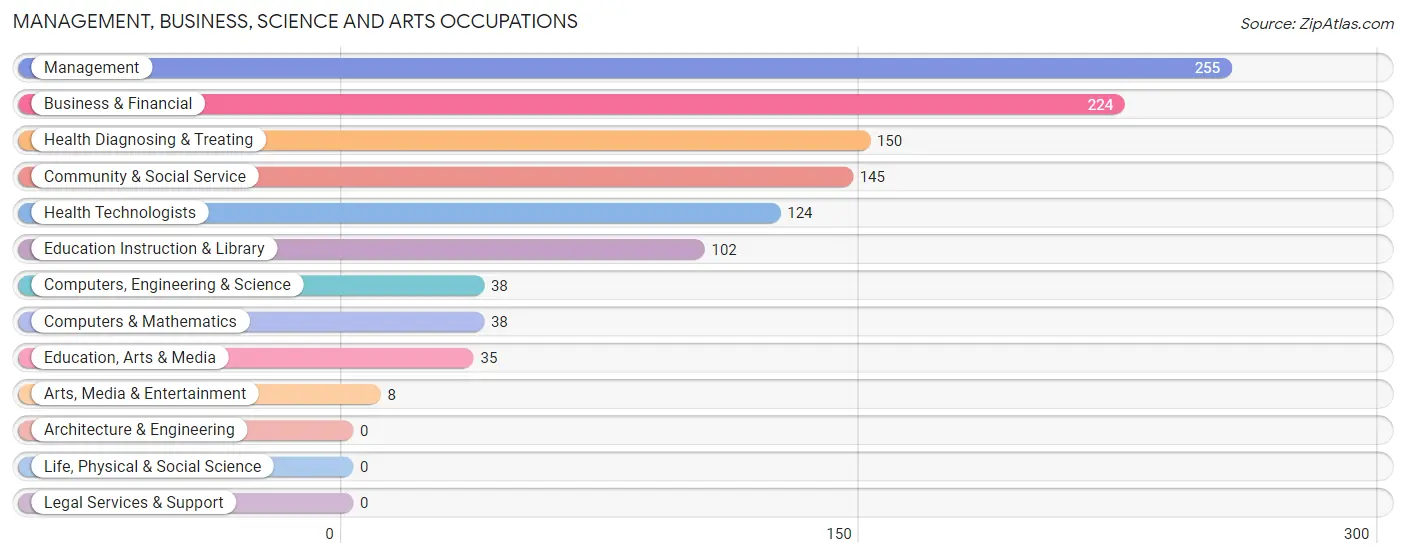
Management, Business, Science and Arts Occupations
The most common Management, Business, Science and Arts occupations in Wheatland are Management (255 | 15.4%), Business & Financial (224 | 13.5%), Health Diagnosing & Treating (150 | 9.1%), Community & Social Service (145 | 8.8%), and Health Technologists (124 | 7.5%).
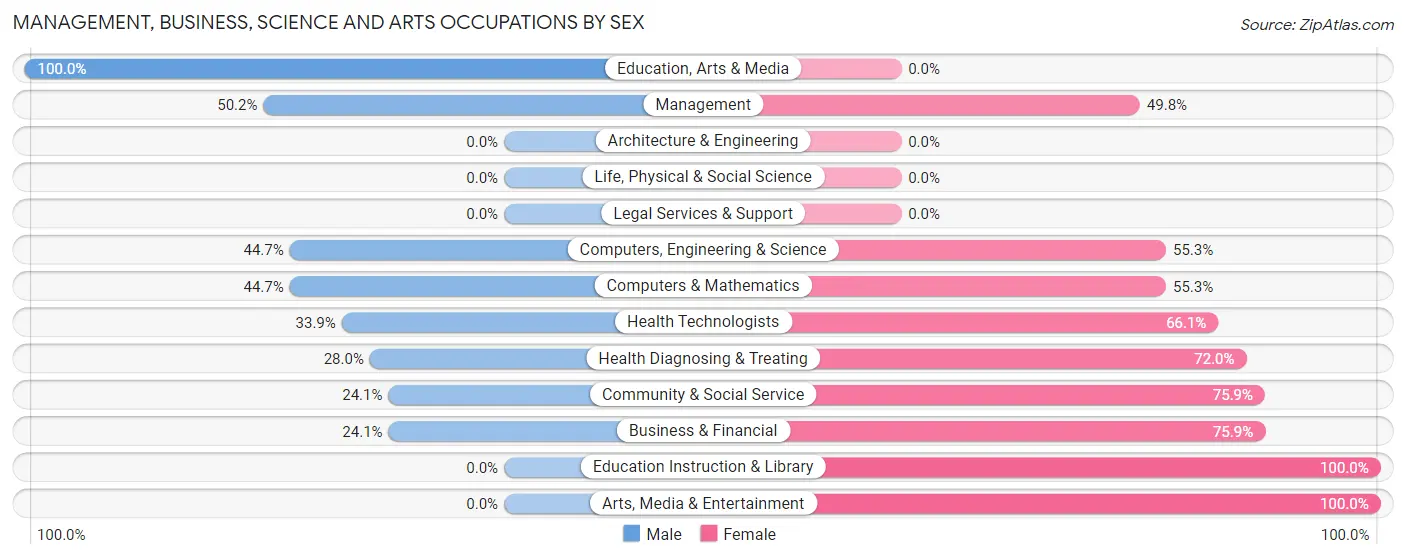
Management, Business, Science and Arts Occupations by Sex
Within the Management, Business, Science and Arts occupations in Wheatland, the most male-oriented occupations are Education, Arts & Media (100.0%), Management (50.2%), and Computers, Engineering & Science (44.7%), while the most female-oriented occupations are Education Instruction & Library (100.0%), Arts, Media & Entertainment (100.0%), and Business & Financial (75.9%).
| Occupation | Male | Female |
| Management | 128 (50.2%) | 127 (49.8%) |
| Business & Financial | 54 (24.1%) | 170 (75.9%) |
| Computers, Engineering & Science | 17 (44.7%) | 21 (55.3%) |
| Computers & Mathematics | 17 (44.7%) | 21 (55.3%) |
| Architecture & Engineering | 0 (0.0%) | 0 (0.0%) |
| Life, Physical & Social Science | 0 (0.0%) | 0 (0.0%) |
| Community & Social Service | 35 (24.1%) | 110 (75.9%) |
| Education, Arts & Media | 35 (100.0%) | 0 (0.0%) |
| Legal Services & Support | 0 (0.0%) | 0 (0.0%) |
| Education Instruction & Library | 0 (0.0%) | 102 (100.0%) |
| Arts, Media & Entertainment | 0 (0.0%) | 8 (100.0%) |
| Health Diagnosing & Treating | 42 (28.0%) | 108 (72.0%) |
| Health Technologists | 42 (33.9%) | 82 (66.1%) |
| Total (Category) | 276 (34.0%) | 536 (66.0%) |
| Total (Overall) | 799 (48.3%) | 855 (51.7%) |
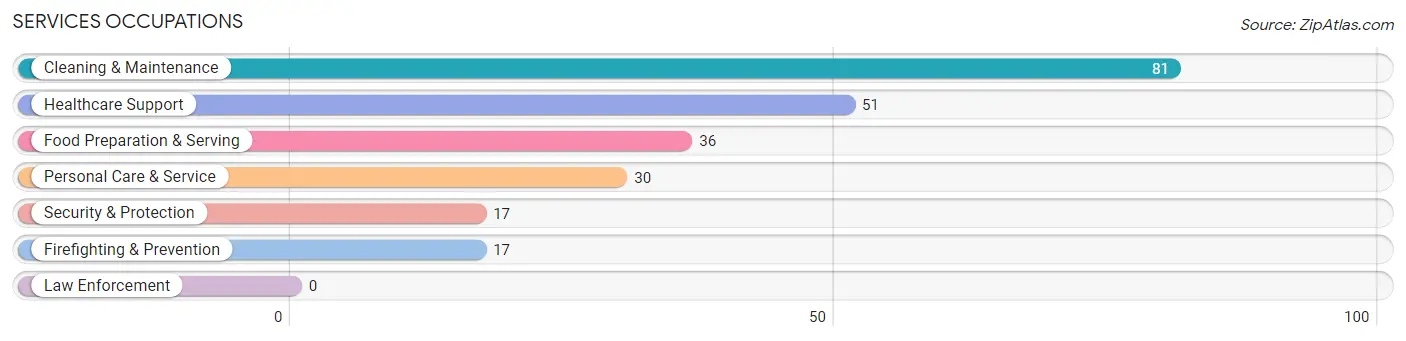
Services Occupations
The most common Services occupations in Wheatland are Cleaning & Maintenance (81 | 4.9%), Healthcare Support (51 | 3.1%), Food Preparation & Serving (36 | 2.2%), Personal Care & Service (30 | 1.8%), and Security & Protection (17 | 1.0%).
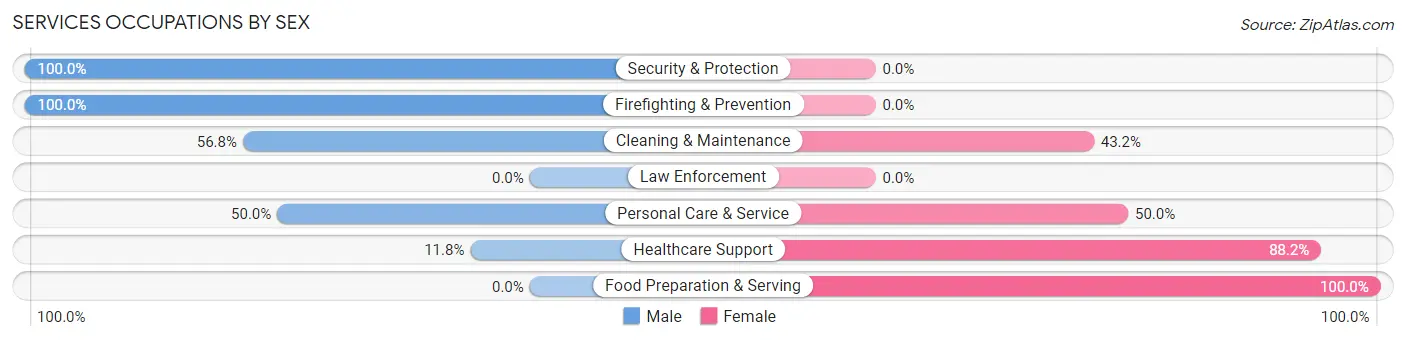
Services Occupations by Sex
Within the Services occupations in Wheatland, the most male-oriented occupations are Security & Protection (100.0%), Firefighting & Prevention (100.0%), and Cleaning & Maintenance (56.8%), while the most female-oriented occupations are Food Preparation & Serving (100.0%), Healthcare Support (88.2%), and Personal Care & Service (50.0%).
| Occupation | Male | Female |
| Healthcare Support | 6 (11.8%) | 45 (88.2%) |
| Security & Protection | 17 (100.0%) | 0 (0.0%) |
| Firefighting & Prevention | 17 (100.0%) | 0 (0.0%) |
| Law Enforcement | 0 (0.0%) | 0 (0.0%) |
| Food Preparation & Serving | 0 (0.0%) | 36 (100.0%) |
| Cleaning & Maintenance | 46 (56.8%) | 35 (43.2%) |
| Personal Care & Service | 15 (50.0%) | 15 (50.0%) |
| Total (Category) | 84 (39.1%) | 131 (60.9%) |
| Total (Overall) | 799 (48.3%) | 855 (51.7%) |
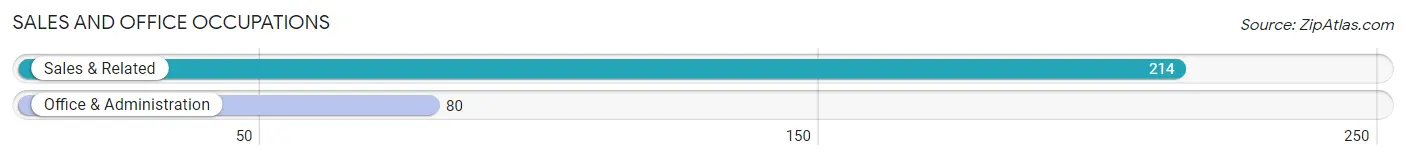
Sales and Office Occupations
The most common Sales and Office occupations in Wheatland are Sales & Related (214 | 12.9%), and Office & Administration (80 | 4.8%).
Sales and Office Occupations by Sex
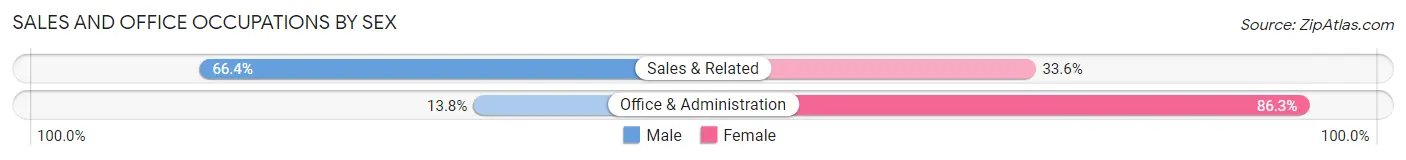
| Occupation | Male | Female |
| Sales & Related | 142 (66.4%) | 72 (33.6%) |
| Office & Administration | 11 (13.8%) | 69 (86.3%) |
| Total (Category) | 153 (52.0%) | 141 (48.0%) |
| Total (Overall) | 799 (48.3%) | 855 (51.7%) |
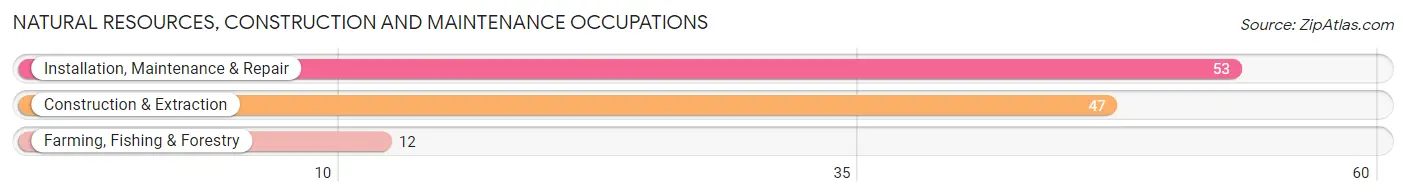
Natural Resources, Construction and Maintenance Occupations
The most common Natural Resources, Construction and Maintenance occupations in Wheatland are Installation, Maintenance & Repair (53 | 3.2%), Construction & Extraction (47 | 2.8%), and Farming, Fishing & Forestry (12 | 0.7%).
Natural Resources, Construction and Maintenance Occupations by Sex
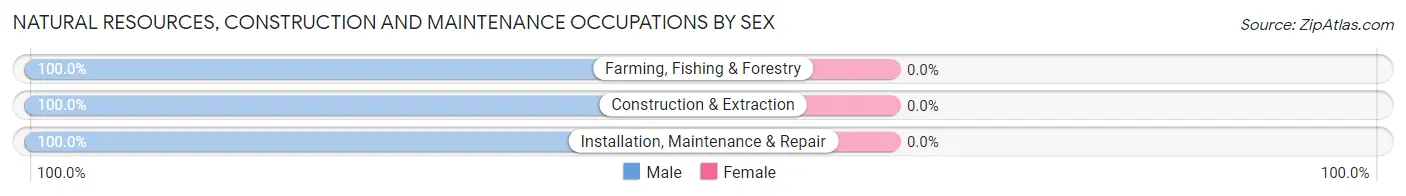
| Occupation | Male | Female |
| Farming, Fishing & Forestry | 12 (100.0%) | 0 (0.0%) |
| Construction & Extraction | 47 (100.0%) | 0 (0.0%) |
| Installation, Maintenance & Repair | 53 (100.0%) | 0 (0.0%) |
| Total (Category) | 112 (100.0%) | 0 (0.0%) |
| Total (Overall) | 799 (48.3%) | 855 (51.7%) |
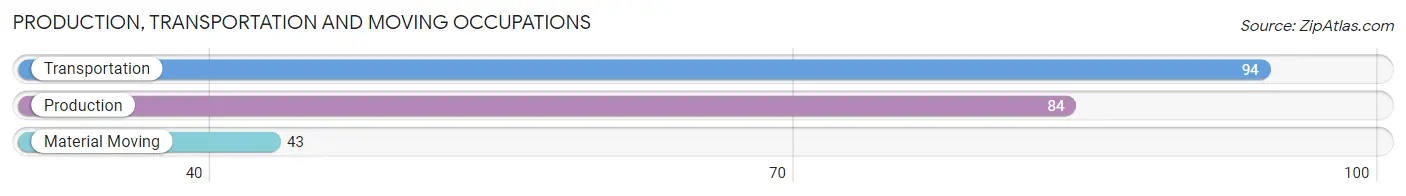
Production, Transportation and Moving Occupations
The most common Production, Transportation and Moving occupations in Wheatland are Transportation (94 | 5.7%), Production (84 | 5.1%), and Material Moving (43 | 2.6%).
Production, Transportation and Moving Occupations by Sex
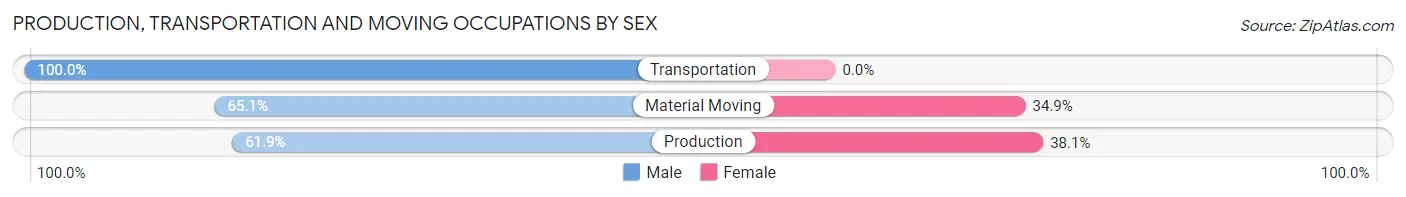
| Occupation | Male | Female |
| Production | 52 (61.9%) | 32 (38.1%) |
| Transportation | 94 (100.0%) | 0 (0.0%) |
| Material Moving | 28 (65.1%) | 15 (34.9%) |
| Total (Category) | 174 (78.7%) | 47 (21.3%) |
| Total (Overall) | 799 (48.3%) | 855 (51.7%) |
Employment Industries by Sex in Wheatland
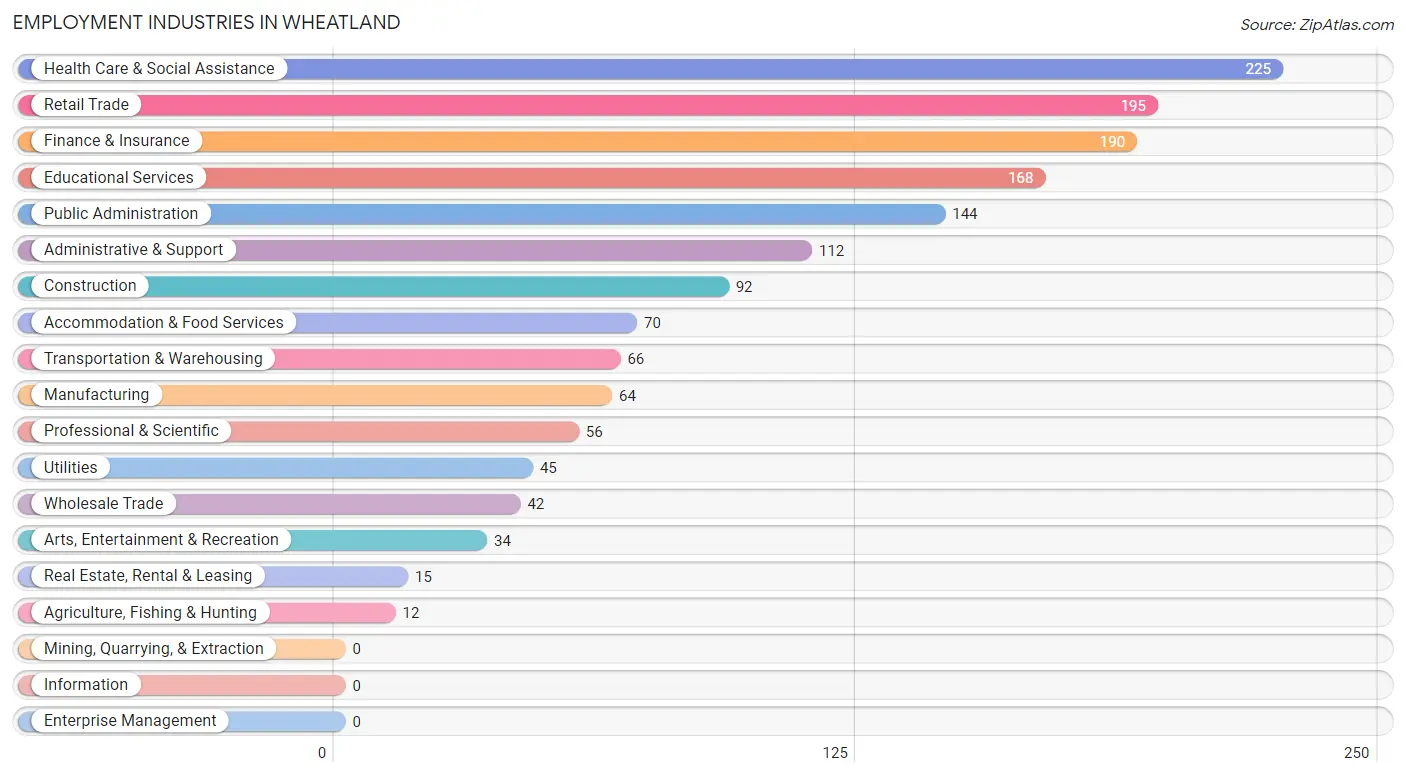
Employment Industries in Wheatland
The major employment industries in Wheatland include Health Care & Social Assistance (225 | 13.6%), Retail Trade (195 | 11.8%), Finance & Insurance (190 | 11.5%), Educational Services (168 | 10.2%), and Public Administration (144 | 8.7%).
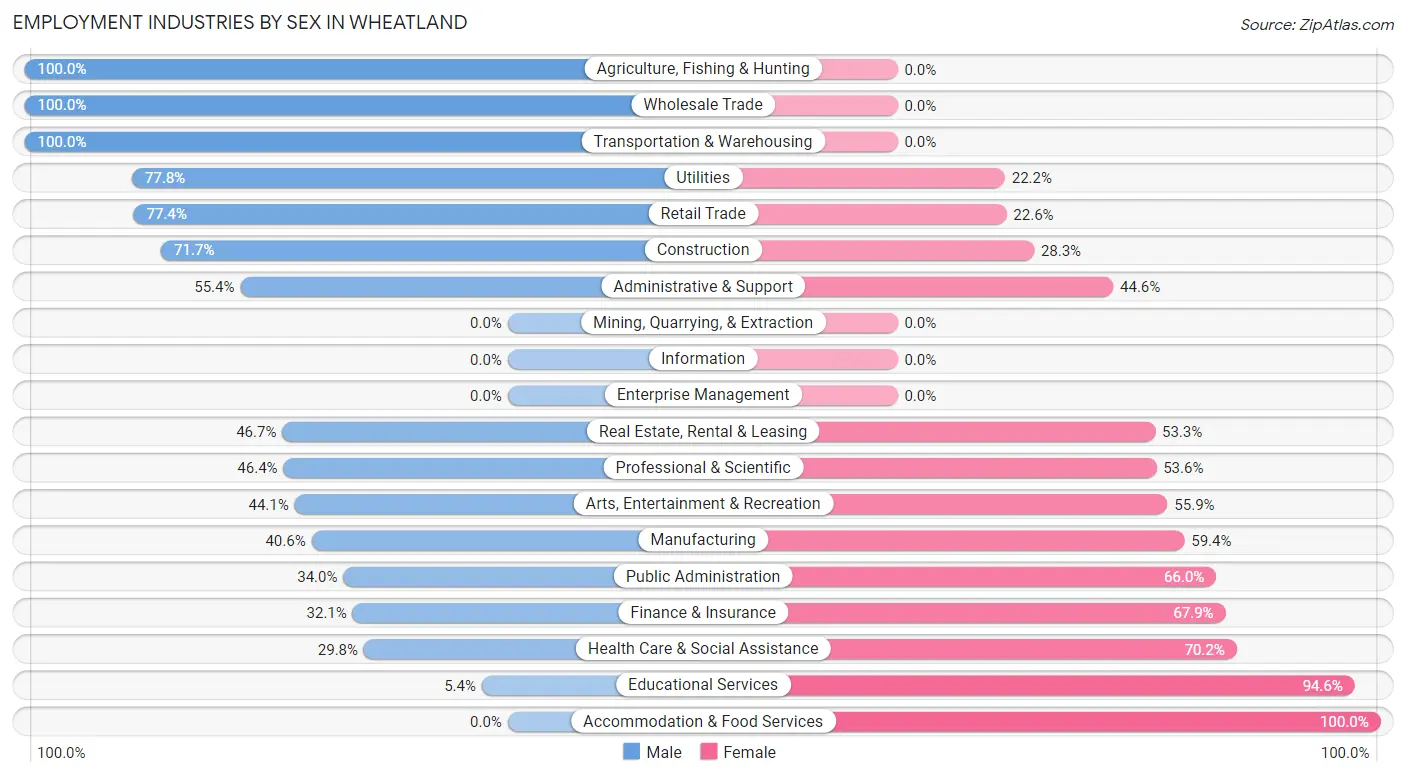
Employment Industries by Sex in Wheatland
The Wheatland industries that see more men than women are Agriculture, Fishing & Hunting (100.0%), Wholesale Trade (100.0%), and Transportation & Warehousing (100.0%), whereas the industries that tend to have a higher number of women are Accommodation & Food Services (100.0%), Educational Services (94.6%), and Health Care & Social Assistance (70.2%).
| Industry | Male | Female |
| Agriculture, Fishing & Hunting | 12 (100.0%) | 0 (0.0%) |
| Mining, Quarrying, & Extraction | 0 (0.0%) | 0 (0.0%) |
| Construction | 66 (71.7%) | 26 (28.3%) |
| Manufacturing | 26 (40.6%) | 38 (59.4%) |
| Wholesale Trade | 42 (100.0%) | 0 (0.0%) |
| Retail Trade | 151 (77.4%) | 44 (22.6%) |
| Transportation & Warehousing | 66 (100.0%) | 0 (0.0%) |
| Utilities | 35 (77.8%) | 10 (22.2%) |
| Information | 0 (0.0%) | 0 (0.0%) |
| Finance & Insurance | 61 (32.1%) | 129 (67.9%) |
| Real Estate, Rental & Leasing | 7 (46.7%) | 8 (53.3%) |
| Professional & Scientific | 26 (46.4%) | 30 (53.6%) |
| Enterprise Management | 0 (0.0%) | 0 (0.0%) |
| Administrative & Support | 62 (55.4%) | 50 (44.6%) |
| Educational Services | 9 (5.4%) | 159 (94.6%) |
| Health Care & Social Assistance | 67 (29.8%) | 158 (70.2%) |
| Arts, Entertainment & Recreation | 15 (44.1%) | 19 (55.9%) |
| Accommodation & Food Services | 0 (0.0%) | 70 (100.0%) |
| Public Administration | 49 (34.0%) | 95 (66.0%) |
| Total | 799 (48.3%) | 855 (51.7%) |
Education in Wheatland
School Enrollment in Wheatland
The most common levels of schooling among the 1,170 students in Wheatland are middle school (346 | 29.6%), high school (265 | 22.7%), and elementary school (229 | 19.6%).
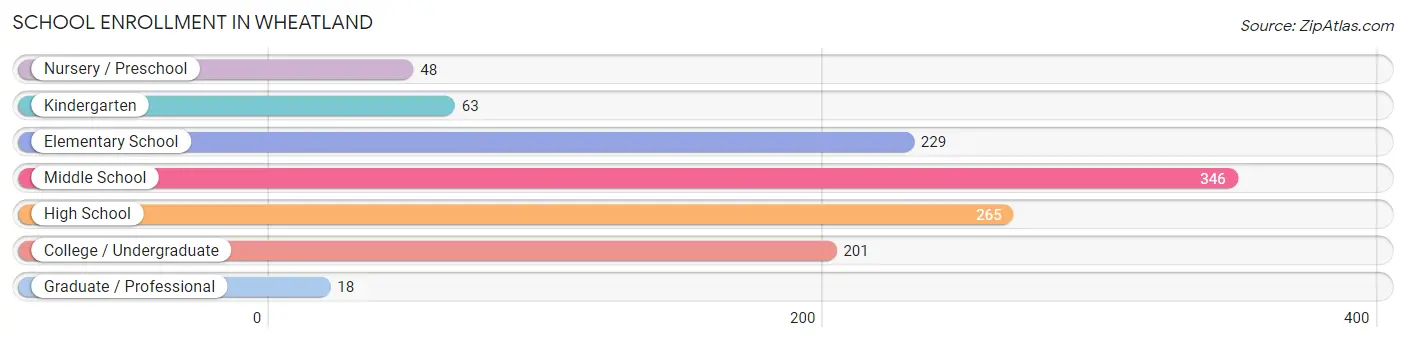
| School Level | # Students | % Students |
| Nursery / Preschool | 48 | 4.1% |
| Kindergarten | 63 | 5.4% |
| Elementary School | 229 | 19.6% |
| Middle School | 346 | 29.6% |
| High School | 265 | 22.7% |
| College / Undergraduate | 201 | 17.2% |
| Graduate / Professional | 18 | 1.5% |
| Total | 1,170 | 100.0% |
School Enrollment by Age by Funding Source in Wheatland
Out of a total of 1,170 students who are enrolled in schools in Wheatland, 49 (4.2%) attend a private institution, while the remaining 1,121 (95.8%) are enrolled in public schools. The age group of 20 to 24 year olds has the highest likelihood of being enrolled in private schools, with 11 (40.7% in the age bracket) enrolled. Conversely, the age group of 5 to 9 year old has the lowest likelihood of being enrolled in a private school, with 290 (100.0% in the age bracket) attending a public institution.
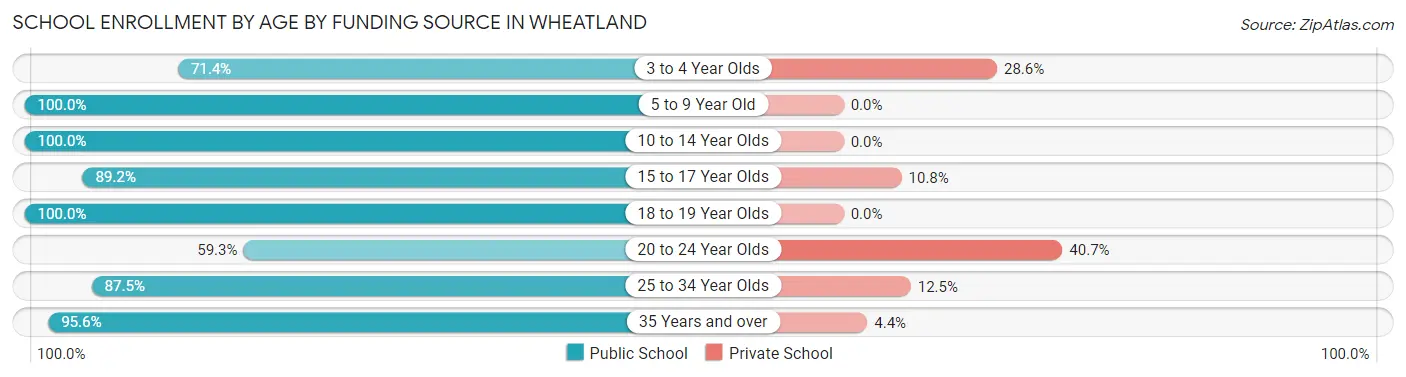
| Age Bracket | Public School | Private School |
| 3 to 4 Year Olds | 25 (71.4%) | 10 (28.6%) |
| 5 to 9 Year Old | 290 (100.0%) | 0 (0.0%) |
| 10 to 14 Year Olds | 479 (100.0%) | 0 (0.0%) |
| 15 to 17 Year Olds | 124 (89.2%) | 15 (10.8%) |
| 18 to 19 Year Olds | 8 (100.0%) | 0 (0.0%) |
| 20 to 24 Year Olds | 16 (59.3%) | 11 (40.7%) |
| 25 to 34 Year Olds | 49 (87.5%) | 7 (12.5%) |
| 35 Years and over | 130 (95.6%) | 6 (4.4%) |
| Total | 1,121 (95.8%) | 49 (4.2%) |
Educational Attainment by Field of Study in Wheatland
Liberal arts & history (108 | 19.0%), science & technology (102 | 18.0%), business (93 | 16.4%), psychology (51 | 9.0%), and multidisciplinary studies (47 | 8.3%) are the most common fields of study among 568 individuals in Wheatland who have obtained a bachelor's degree or higher.
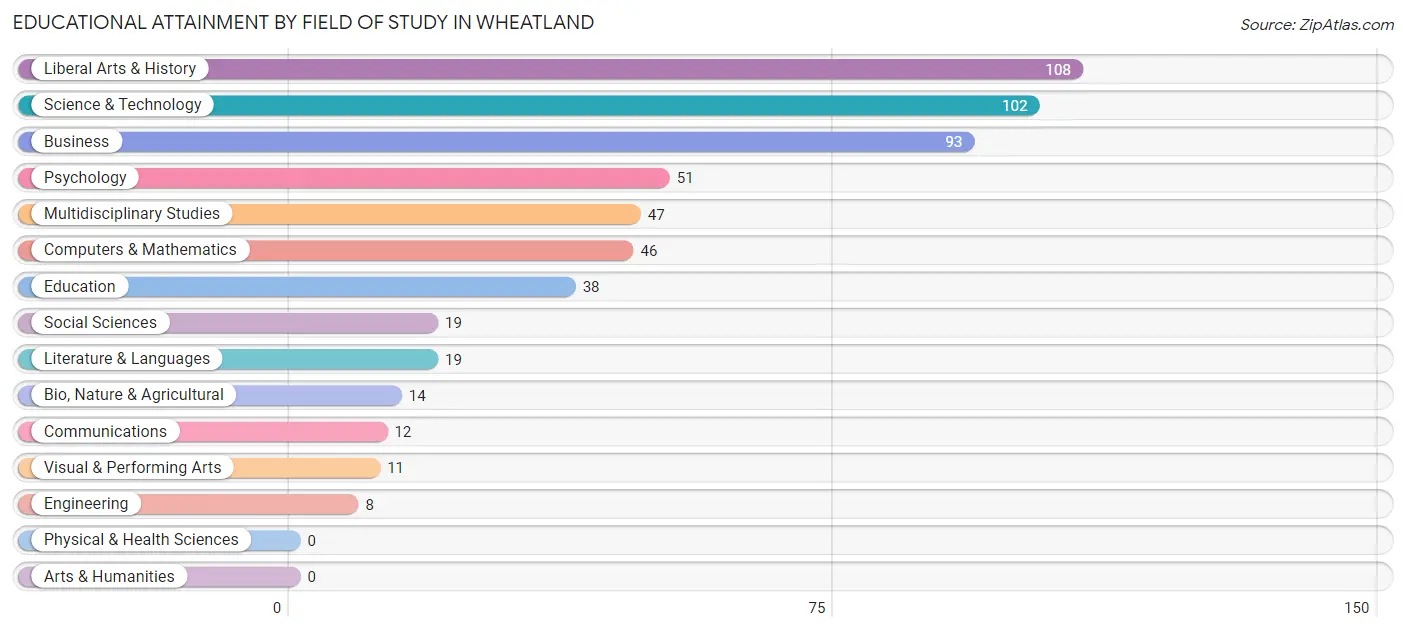
| Field of Study | # Graduates | % Graduates |
| Computers & Mathematics | 46 | 8.1% |
| Bio, Nature & Agricultural | 14 | 2.5% |
| Physical & Health Sciences | 0 | 0.0% |
| Psychology | 51 | 9.0% |
| Social Sciences | 19 | 3.4% |
| Engineering | 8 | 1.4% |
| Multidisciplinary Studies | 47 | 8.3% |
| Science & Technology | 102 | 18.0% |
| Business | 93 | 16.4% |
| Education | 38 | 6.7% |
| Literature & Languages | 19 | 3.4% |
| Liberal Arts & History | 108 | 19.0% |
| Visual & Performing Arts | 11 | 1.9% |
| Communications | 12 | 2.1% |
| Arts & Humanities | 0 | 0.0% |
| Total | 568 | 100.0% |
Transportation & Commute in Wheatland
Vehicle Availability by Sex in Wheatland
The most prevalent vehicle ownership categories in Wheatland are males with 3 vehicles (350, accounting for 42.8%) and females with 3 vehicles (191, making up 40.9%).
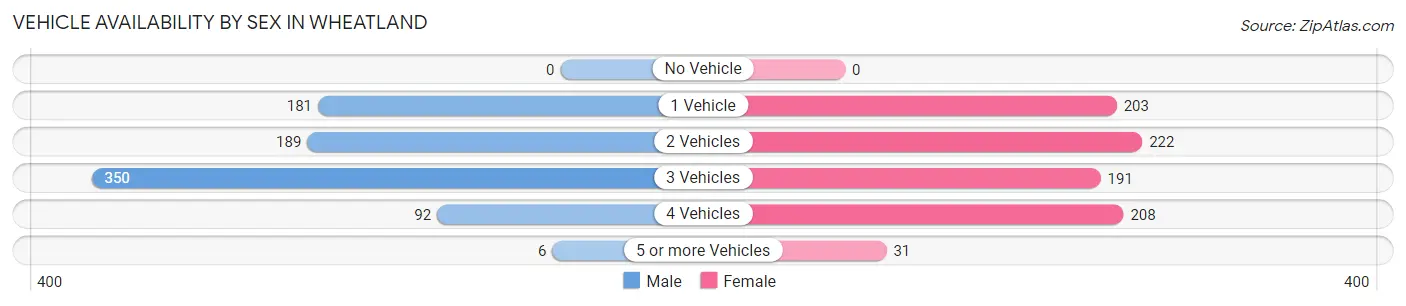
| Vehicles Available | Male | Female |
| No Vehicle | 0 (0.0%) | 0 (0.0%) |
| 1 Vehicle | 181 (22.1%) | 203 (23.7%) |
| 2 Vehicles | 189 (23.1%) | 222 (26.0%) |
| 3 Vehicles | 350 (42.8%) | 191 (22.3%) |
| 4 Vehicles | 92 (11.3%) | 208 (24.3%) |
| 5 or more Vehicles | 6 (0.7%) | 31 (3.6%) |
| Total | 818 (100.0%) | 855 (100.0%) |
Commute Time in Wheatland
The most frequently occuring commute durations in Wheatland are 20 to 24 minutes (340 commuters, 22.8%), 30 to 34 minutes (173 commuters, 11.6%), and 15 to 19 minutes (170 commuters, 11.4%).
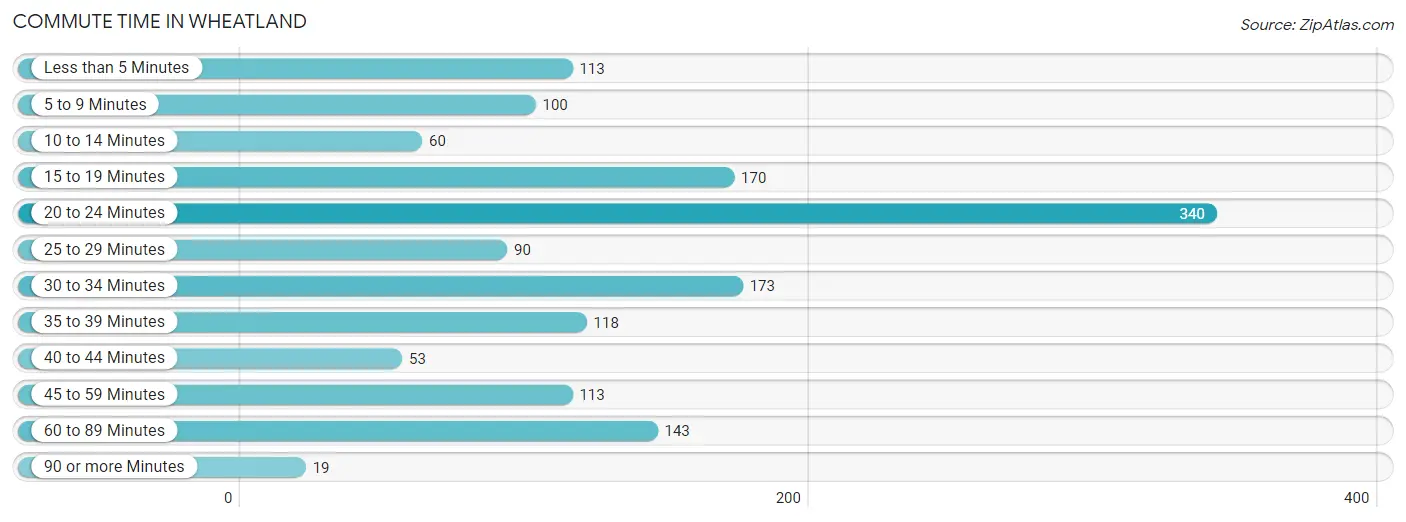
| Commute Time | # Commuters | % Commuters |
| Less than 5 Minutes | 113 | 7.6% |
| 5 to 9 Minutes | 100 | 6.7% |
| 10 to 14 Minutes | 60 | 4.0% |
| 15 to 19 Minutes | 170 | 11.4% |
| 20 to 24 Minutes | 340 | 22.8% |
| 25 to 29 Minutes | 90 | 6.0% |
| 30 to 34 Minutes | 173 | 11.6% |
| 35 to 39 Minutes | 118 | 7.9% |
| 40 to 44 Minutes | 53 | 3.5% |
| 45 to 59 Minutes | 113 | 7.6% |
| 60 to 89 Minutes | 143 | 9.6% |
| 90 or more Minutes | 19 | 1.3% |
Commute Time by Sex in Wheatland
The most common commute times in Wheatland are 20 to 24 minutes (265 commuters, 33.4%) for males and 15 to 19 minutes (110 commuters, 15.8%) for females.
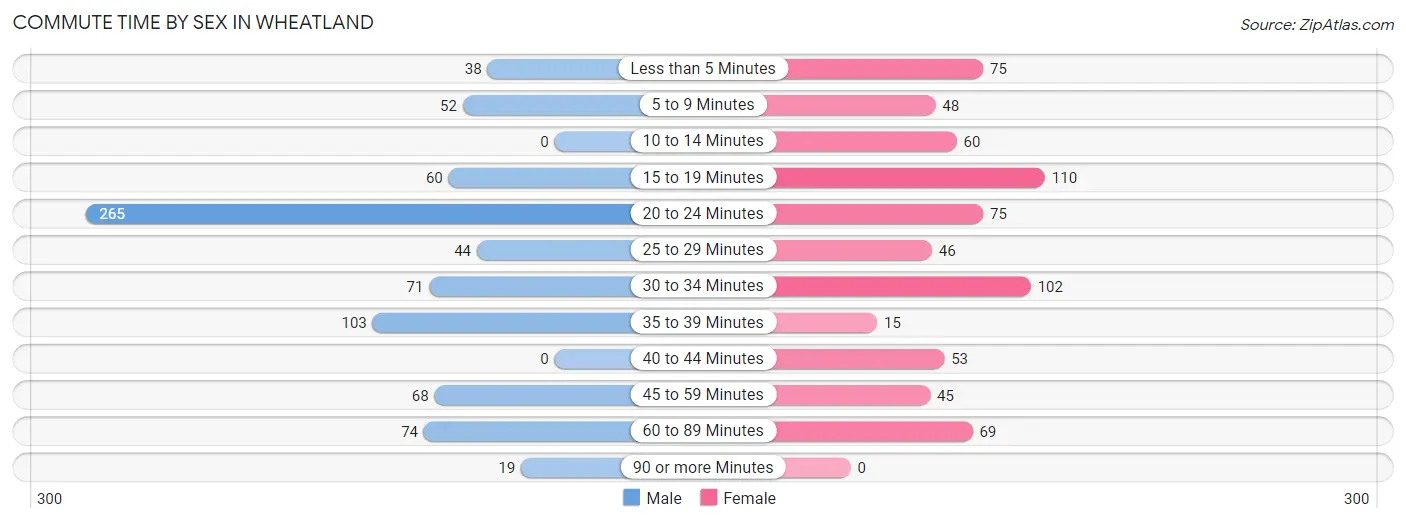
| Commute Time | Male | Female |
| Less than 5 Minutes | 38 (4.8%) | 75 (10.7%) |
| 5 to 9 Minutes | 52 (6.6%) | 48 (6.9%) |
| 10 to 14 Minutes | 0 (0.0%) | 60 (8.6%) |
| 15 to 19 Minutes | 60 (7.6%) | 110 (15.8%) |
| 20 to 24 Minutes | 265 (33.4%) | 75 (10.7%) |
| 25 to 29 Minutes | 44 (5.5%) | 46 (6.6%) |
| 30 to 34 Minutes | 71 (8.9%) | 102 (14.6%) |
| 35 to 39 Minutes | 103 (13.0%) | 15 (2.1%) |
| 40 to 44 Minutes | 0 (0.0%) | 53 (7.6%) |
| 45 to 59 Minutes | 68 (8.6%) | 45 (6.5%) |
| 60 to 89 Minutes | 74 (9.3%) | 69 (9.9%) |
| 90 or more Minutes | 19 (2.4%) | 0 (0.0%) |
Time of Departure to Work by Sex in Wheatland
The most frequent times of departure to work in Wheatland are 12:00 PM to 3:59 PM (144, 18.1%) for males and 8:00 AM to 8:29 AM (114, 16.3%) for females.
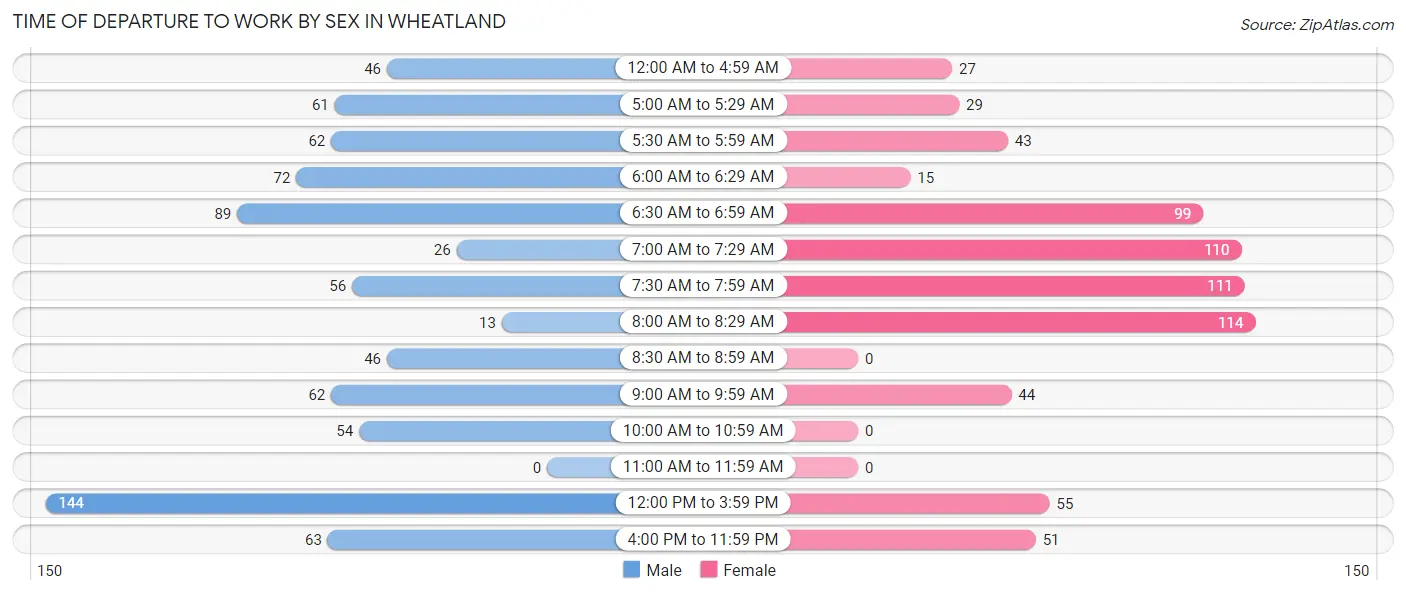
| Time of Departure | Male | Female |
| 12:00 AM to 4:59 AM | 46 (5.8%) | 27 (3.9%) |
| 5:00 AM to 5:29 AM | 61 (7.7%) | 29 (4.2%) |
| 5:30 AM to 5:59 AM | 62 (7.8%) | 43 (6.2%) |
| 6:00 AM to 6:29 AM | 72 (9.1%) | 15 (2.1%) |
| 6:30 AM to 6:59 AM | 89 (11.2%) | 99 (14.2%) |
| 7:00 AM to 7:29 AM | 26 (3.3%) | 110 (15.8%) |
| 7:30 AM to 7:59 AM | 56 (7.0%) | 111 (15.9%) |
| 8:00 AM to 8:29 AM | 13 (1.6%) | 114 (16.3%) |
| 8:30 AM to 8:59 AM | 46 (5.8%) | 0 (0.0%) |
| 9:00 AM to 9:59 AM | 62 (7.8%) | 44 (6.3%) |
| 10:00 AM to 10:59 AM | 54 (6.8%) | 0 (0.0%) |
| 11:00 AM to 11:59 AM | 0 (0.0%) | 0 (0.0%) |
| 12:00 PM to 3:59 PM | 144 (18.1%) | 55 (7.9%) |
| 4:00 PM to 11:59 PM | 63 (7.9%) | 51 (7.3%) |
| Total | 794 (100.0%) | 698 (100.0%) |
Housing Occupancy in Wheatland
Occupancy by Ownership in Wheatland
Of the total 1,287 dwellings in Wheatland, owner-occupied units account for 798 (62.0%), while renter-occupied units make up 489 (38.0%).
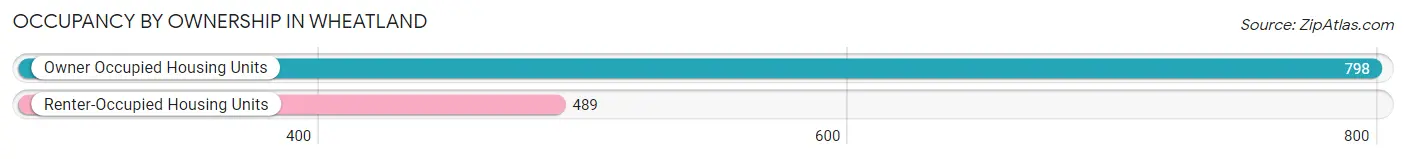
| Occupancy | # Housing Units | % Housing Units |
| Owner Occupied Housing Units | 798 | 62.0% |
| Renter-Occupied Housing Units | 489 | 38.0% |
| Total Occupied Housing Units | 1,287 | 100.0% |
Occupancy by Household Size in Wheatland
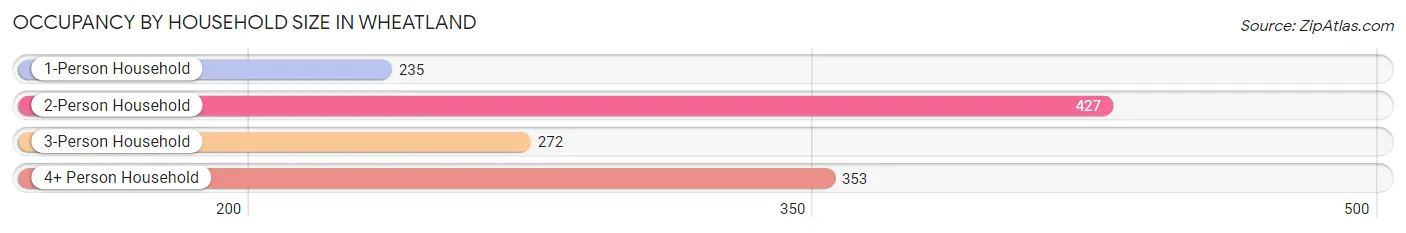
| Household Size | # Housing Units | % Housing Units |
| 1-Person Household | 235 | 18.3% |
| 2-Person Household | 427 | 33.2% |
| 3-Person Household | 272 | 21.1% |
| 4+ Person Household | 353 | 27.4% |
| Total Housing Units | 1,287 | 100.0% |
Occupancy by Ownership by Household Size in Wheatland
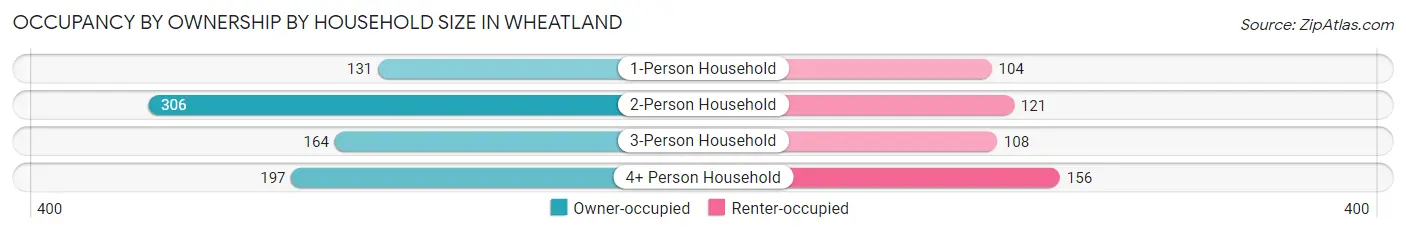
| Household Size | Owner-occupied | Renter-occupied |
| 1-Person Household | 131 (55.7%) | 104 (44.3%) |
| 2-Person Household | 306 (71.7%) | 121 (28.3%) |
| 3-Person Household | 164 (60.3%) | 108 (39.7%) |
| 4+ Person Household | 197 (55.8%) | 156 (44.2%) |
| Total Housing Units | 798 (62.0%) | 489 (38.0%) |
Occupancy by Educational Attainment in Wheatland
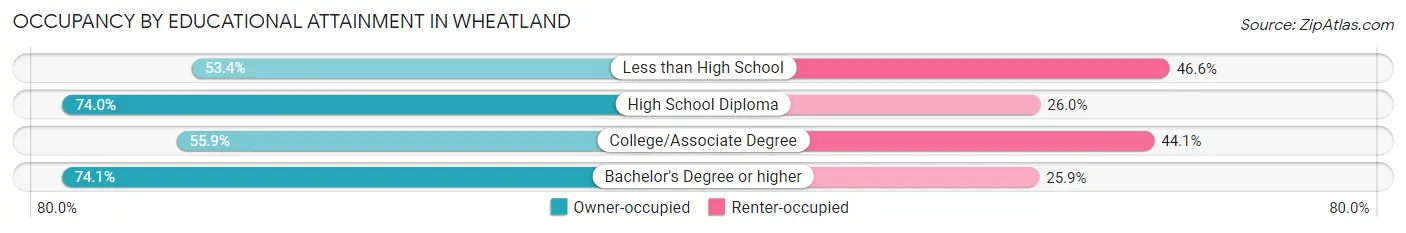
| Household Size | Owner-occupied | Renter-occupied |
| Less than High School | 70 (53.4%) | 61 (46.6%) |
| High School Diploma | 142 (74.0%) | 50 (26.0%) |
| College/Associate Degree | 394 (55.9%) | 311 (44.1%) |
| Bachelor's Degree or higher | 192 (74.1%) | 67 (25.9%) |
Occupancy by Age of Householder in Wheatland
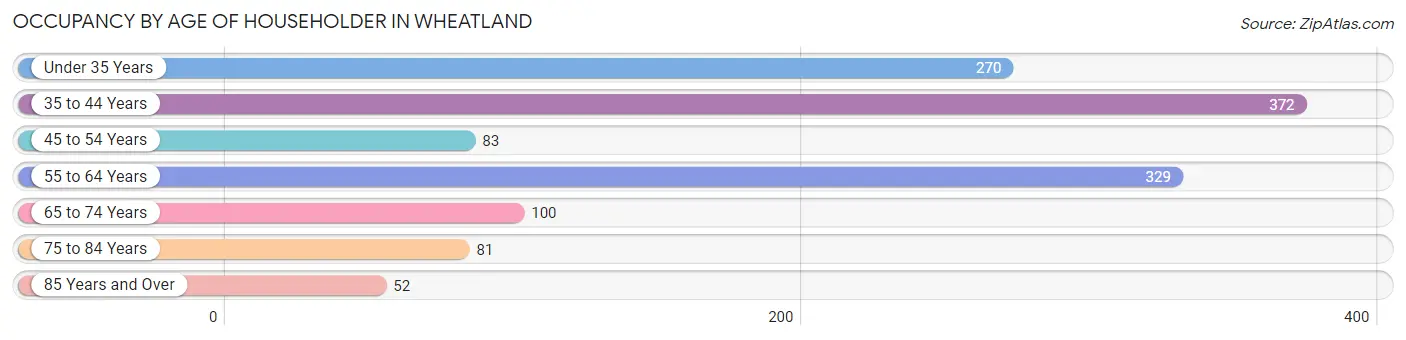
| Age Bracket | # Households | % Households |
| Under 35 Years | 270 | 21.0% |
| 35 to 44 Years | 372 | 28.9% |
| 45 to 54 Years | 83 | 6.5% |
| 55 to 64 Years | 329 | 25.6% |
| 65 to 74 Years | 100 | 7.8% |
| 75 to 84 Years | 81 | 6.3% |
| 85 Years and Over | 52 | 4.0% |
| Total | 1,287 | 100.0% |
Housing Finances in Wheatland
Median Income by Occupancy in Wheatland
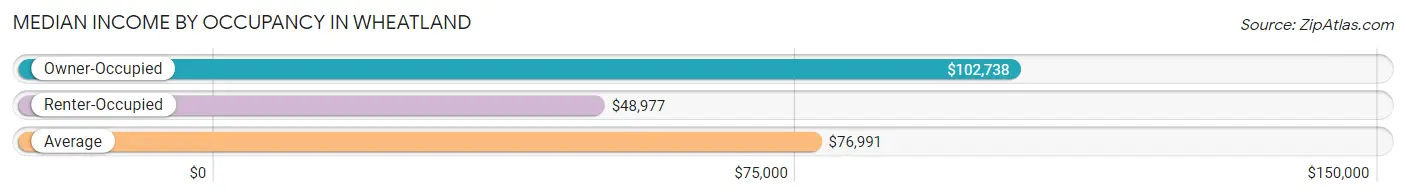
| Occupancy Type | # Households | Median Income |
| Owner-Occupied | 798 (62.0%) | $102,738 |
| Renter-Occupied | 489 (38.0%) | $48,977 |
| Average | 1,287 (100.0%) | $76,991 |
Occupancy by Householder Income Bracket in Wheatland
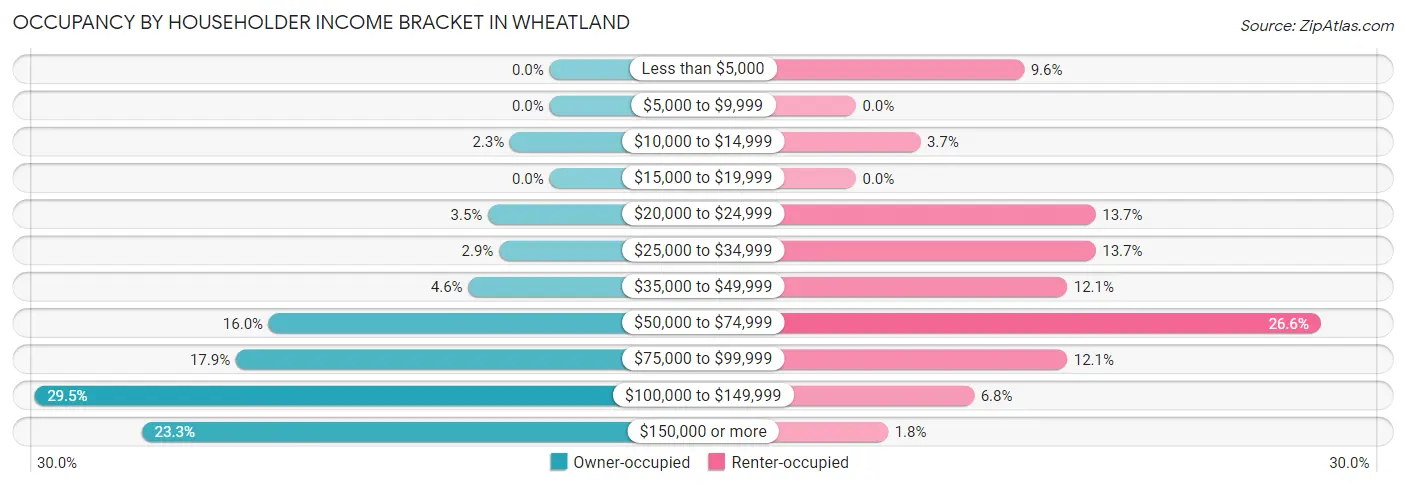
| Income Bracket | Owner-occupied | Renter-occupied |
| Less than $5,000 | 0 (0.0%) | 47 (9.6%) |
| $5,000 to $9,999 | 0 (0.0%) | 0 (0.0%) |
| $10,000 to $14,999 | 18 (2.3%) | 18 (3.7%) |
| $15,000 to $19,999 | 0 (0.0%) | 0 (0.0%) |
| $20,000 to $24,999 | 28 (3.5%) | 67 (13.7%) |
| $25,000 to $34,999 | 23 (2.9%) | 67 (13.7%) |
| $35,000 to $49,999 | 37 (4.6%) | 59 (12.1%) |
| $50,000 to $74,999 | 128 (16.0%) | 130 (26.6%) |
| $75,000 to $99,999 | 143 (17.9%) | 59 (12.1%) |
| $100,000 to $149,999 | 235 (29.4%) | 33 (6.8%) |
| $150,000 or more | 186 (23.3%) | 9 (1.8%) |
| Total | 798 (100.0%) | 489 (100.0%) |
Monthly Housing Cost Tiers in Wheatland
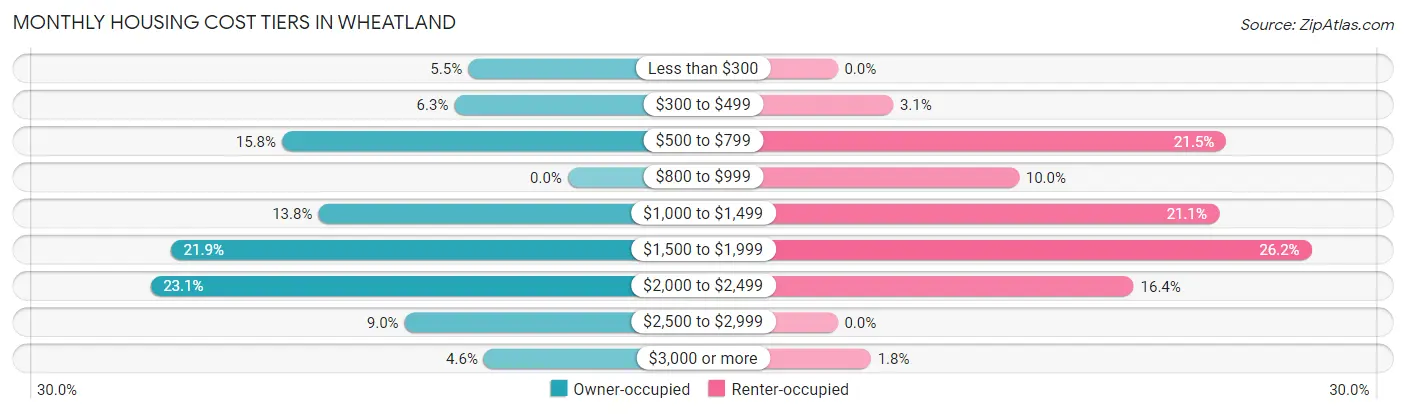
| Monthly Cost | Owner-occupied | Renter-occupied |
| Less than $300 | 44 (5.5%) | 0 (0.0%) |
| $300 to $499 | 50 (6.3%) | 15 (3.1%) |
| $500 to $799 | 126 (15.8%) | 105 (21.5%) |
| $800 to $999 | 0 (0.0%) | 49 (10.0%) |
| $1,000 to $1,499 | 110 (13.8%) | 103 (21.1%) |
| $1,500 to $1,999 | 175 (21.9%) | 128 (26.2%) |
| $2,000 to $2,499 | 184 (23.1%) | 80 (16.4%) |
| $2,500 to $2,999 | 72 (9.0%) | 0 (0.0%) |
| $3,000 or more | 37 (4.6%) | 9 (1.8%) |
| Total | 798 (100.0%) | 489 (100.0%) |
Physical Housing Characteristics in Wheatland
Housing Structures in Wheatland
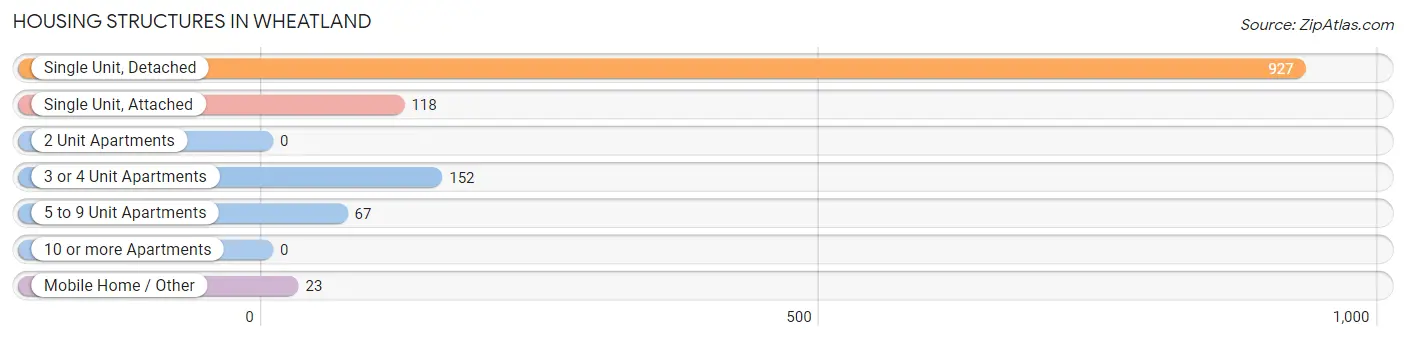
| Structure Type | # Housing Units | % Housing Units |
| Single Unit, Detached | 927 | 72.0% |
| Single Unit, Attached | 118 | 9.2% |
| 2 Unit Apartments | 0 | 0.0% |
| 3 or 4 Unit Apartments | 152 | 11.8% |
| 5 to 9 Unit Apartments | 67 | 5.2% |
| 10 or more Apartments | 0 | 0.0% |
| Mobile Home / Other | 23 | 1.8% |
| Total | 1,287 | 100.0% |
Housing Structures by Occupancy in Wheatland
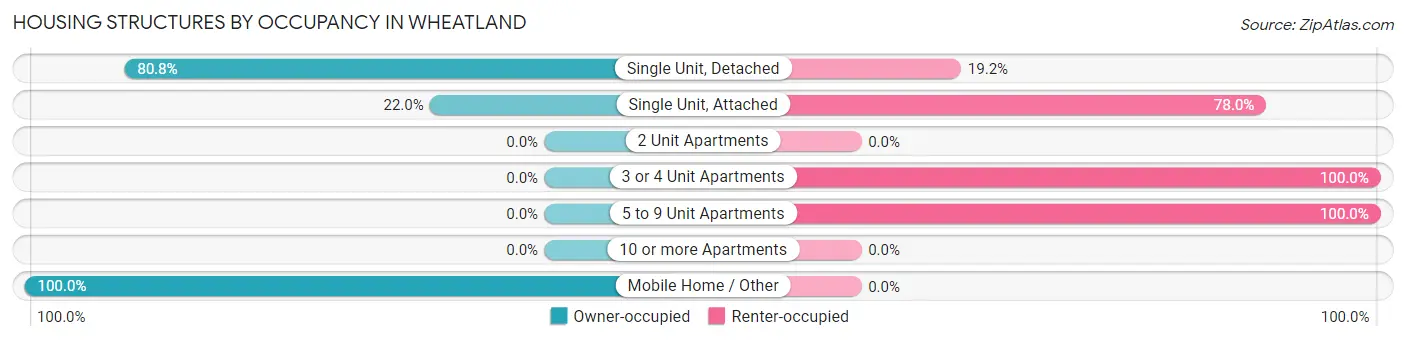
| Structure Type | Owner-occupied | Renter-occupied |
| Single Unit, Detached | 749 (80.8%) | 178 (19.2%) |
| Single Unit, Attached | 26 (22.0%) | 92 (78.0%) |
| 2 Unit Apartments | 0 (0.0%) | 0 (0.0%) |
| 3 or 4 Unit Apartments | 0 (0.0%) | 152 (100.0%) |
| 5 to 9 Unit Apartments | 0 (0.0%) | 67 (100.0%) |
| 10 or more Apartments | 0 (0.0%) | 0 (0.0%) |
| Mobile Home / Other | 23 (100.0%) | 0 (0.0%) |
| Total | 798 (62.0%) | 489 (38.0%) |
Housing Structures by Number of Rooms in Wheatland
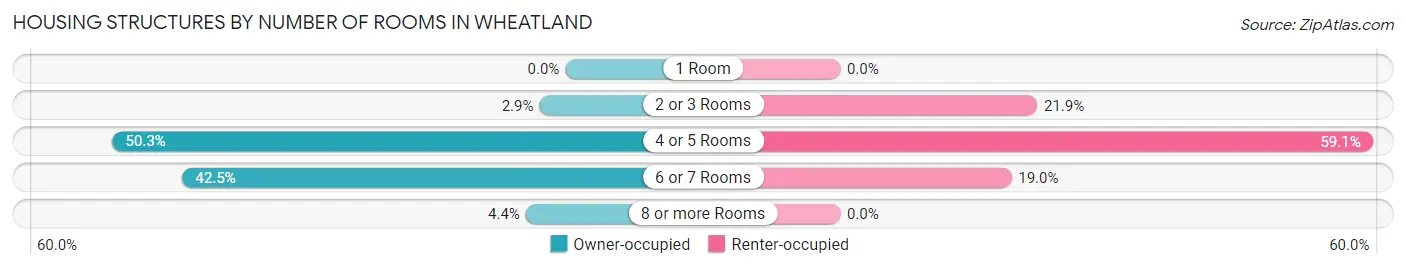
| Number of Rooms | Owner-occupied | Renter-occupied |
| 1 Room | 0 (0.0%) | 0 (0.0%) |
| 2 or 3 Rooms | 23 (2.9%) | 107 (21.9%) |
| 4 or 5 Rooms | 401 (50.2%) | 289 (59.1%) |
| 6 or 7 Rooms | 339 (42.5%) | 93 (19.0%) |
| 8 or more Rooms | 35 (4.4%) | 0 (0.0%) |
| Total | 798 (100.0%) | 489 (100.0%) |
Housing Structure by Heating Type in Wheatland
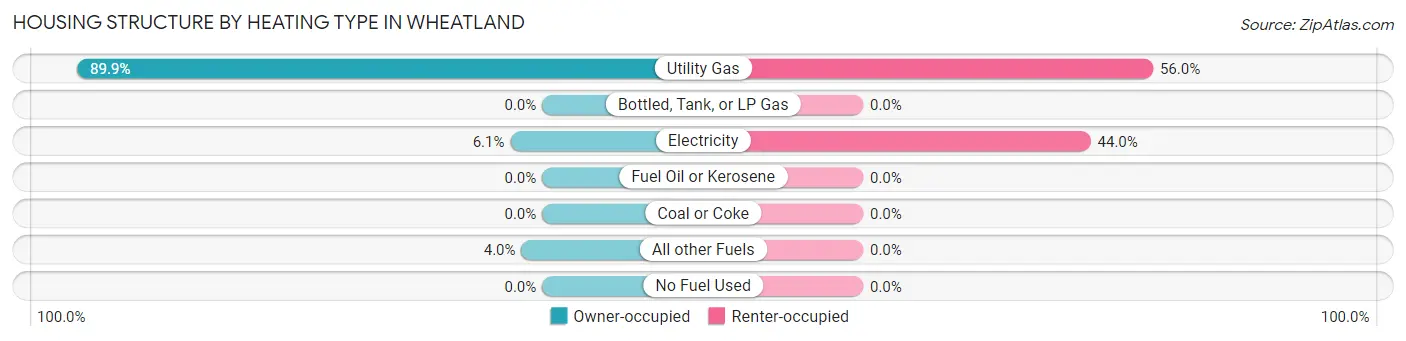
| Heating Type | Owner-occupied | Renter-occupied |
| Utility Gas | 717 (89.8%) | 274 (56.0%) |
| Bottled, Tank, or LP Gas | 0 (0.0%) | 0 (0.0%) |
| Electricity | 49 (6.1%) | 215 (44.0%) |
| Fuel Oil or Kerosene | 0 (0.0%) | 0 (0.0%) |
| Coal or Coke | 0 (0.0%) | 0 (0.0%) |
| All other Fuels | 32 (4.0%) | 0 (0.0%) |
| No Fuel Used | 0 (0.0%) | 0 (0.0%) |
| Total | 798 (100.0%) | 489 (100.0%) |
Household Vehicle Usage in Wheatland
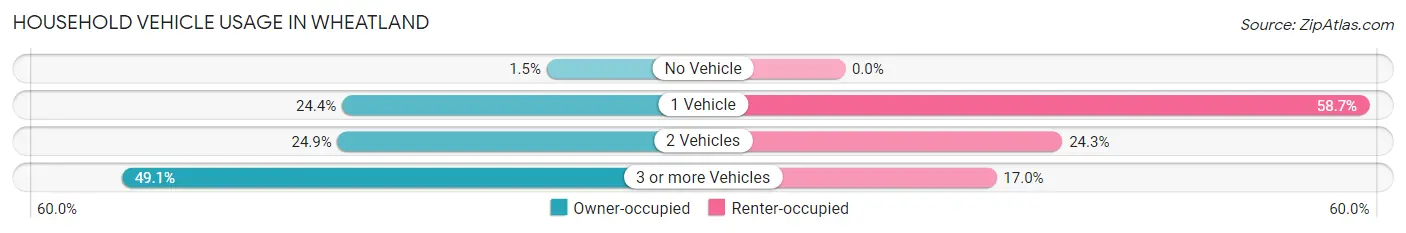
| Vehicles per Household | Owner-occupied | Renter-occupied |
| No Vehicle | 12 (1.5%) | 0 (0.0%) |
| 1 Vehicle | 195 (24.4%) | 287 (58.7%) |
| 2 Vehicles | 199 (24.9%) | 119 (24.3%) |
| 3 or more Vehicles | 392 (49.1%) | 83 (17.0%) |
| Total | 798 (100.0%) | 489 (100.0%) |
Real Estate & Mortgages in Wheatland
Real Estate and Mortgage Overview in Wheatland
| Characteristic | Without Mortgage | With Mortgage |
| Housing Units | 191 | 607 |
| Median Property Value | $289,400 | $343,800 |
| Median Household Income | $85,515 | $174 |
| Monthly Housing Costs | $502 | $37 |
| Real Estate Taxes | $1,836 | $23 |
Property Value by Mortgage Status in Wheatland
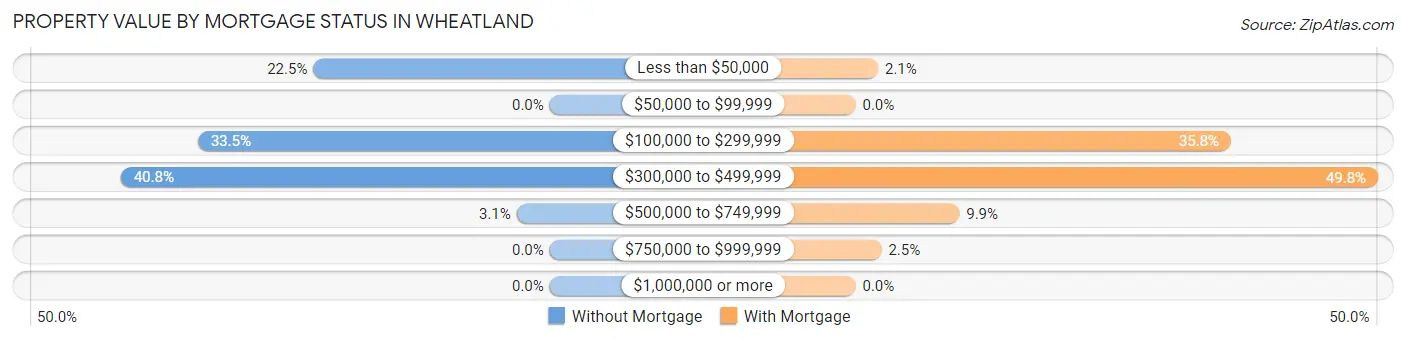
| Property Value | Without Mortgage | With Mortgage |
| Less than $50,000 | 43 (22.5%) | 13 (2.1%) |
| $50,000 to $99,999 | 0 (0.0%) | 0 (0.0%) |
| $100,000 to $299,999 | 64 (33.5%) | 217 (35.7%) |
| $300,000 to $499,999 | 78 (40.8%) | 302 (49.7%) |
| $500,000 to $749,999 | 6 (3.1%) | 60 (9.9%) |
| $750,000 to $999,999 | 0 (0.0%) | 15 (2.5%) |
| $1,000,000 or more | 0 (0.0%) | 0 (0.0%) |
| Total | 191 (100.0%) | 607 (100.0%) |
Household Income by Mortgage Status in Wheatland
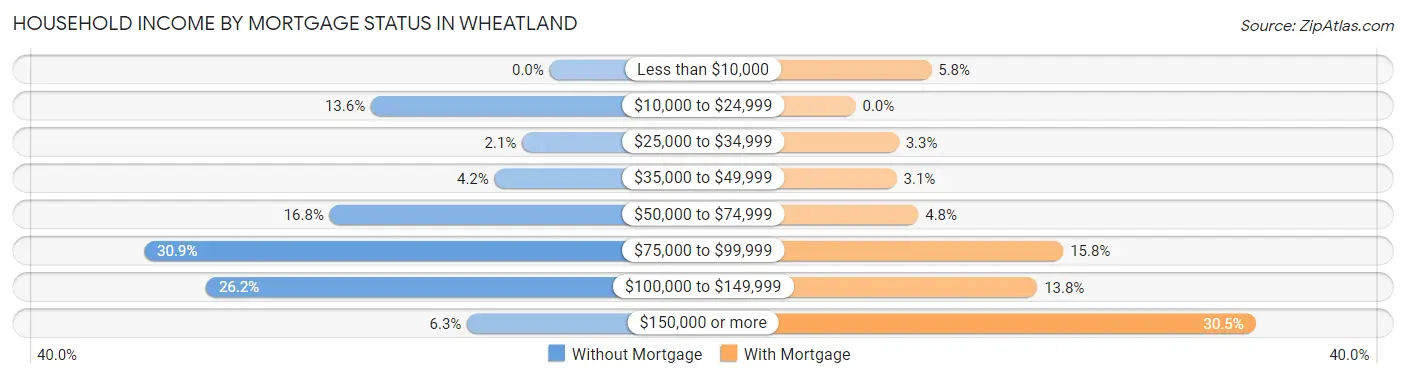
| Household Income | Without Mortgage | With Mortgage |
| Less than $10,000 | 0 (0.0%) | 35 (5.8%) |
| $10,000 to $24,999 | 26 (13.6%) | 0 (0.0%) |
| $25,000 to $34,999 | 4 (2.1%) | 20 (3.3%) |
| $35,000 to $49,999 | 8 (4.2%) | 19 (3.1%) |
| $50,000 to $74,999 | 32 (16.8%) | 29 (4.8%) |
| $75,000 to $99,999 | 59 (30.9%) | 96 (15.8%) |
| $100,000 to $149,999 | 50 (26.2%) | 84 (13.8%) |
| $150,000 or more | 12 (6.3%) | 185 (30.5%) |
| Total | 191 (100.0%) | 607 (100.0%) |
Property Value to Household Income Ratio in Wheatland
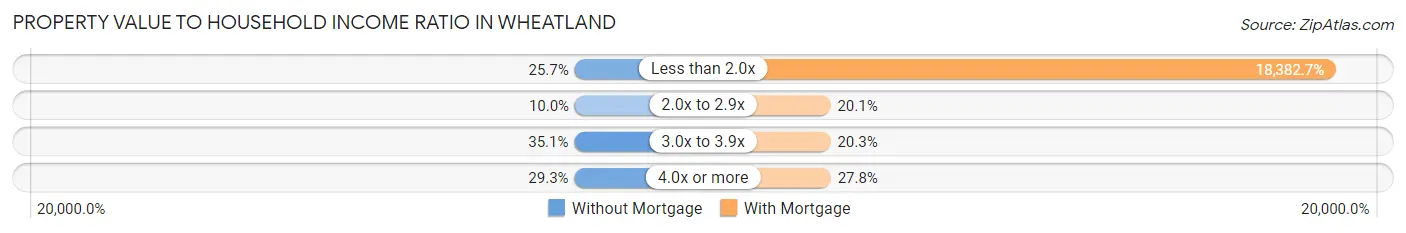
| Value-to-Income Ratio | Without Mortgage | With Mortgage |
| Less than 2.0x | 49 (25.7%) | 111,583 (18,382.7%) |
| 2.0x to 2.9x | 19 (10.0%) | 122 (20.1%) |
| 3.0x to 3.9x | 67 (35.1%) | 123 (20.3%) |
| 4.0x or more | 56 (29.3%) | 169 (27.8%) |
| Total | 191 (100.0%) | 607 (100.0%) |
Real Estate Taxes by Mortgage Status in Wheatland
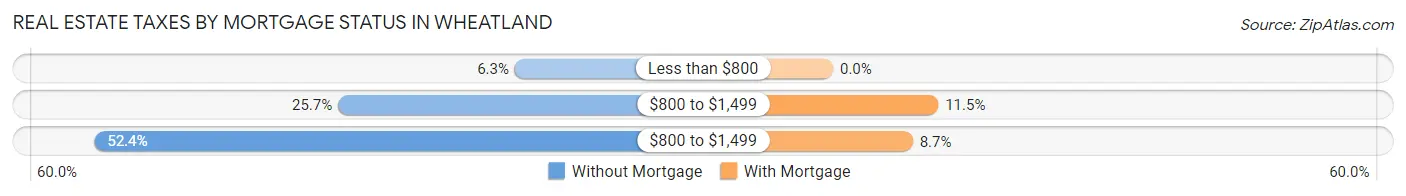
| Property Taxes | Without Mortgage | With Mortgage |
| Less than $800 | 12 (6.3%) | 0 (0.0%) |
| $800 to $1,499 | 49 (25.7%) | 70 (11.5%) |
| $800 to $1,499 | 100 (52.4%) | 53 (8.7%) |
| Total | 191 (100.0%) | 607 (100.0%) |
Health & Disability in Wheatland
Health Insurance Coverage by Age in Wheatland
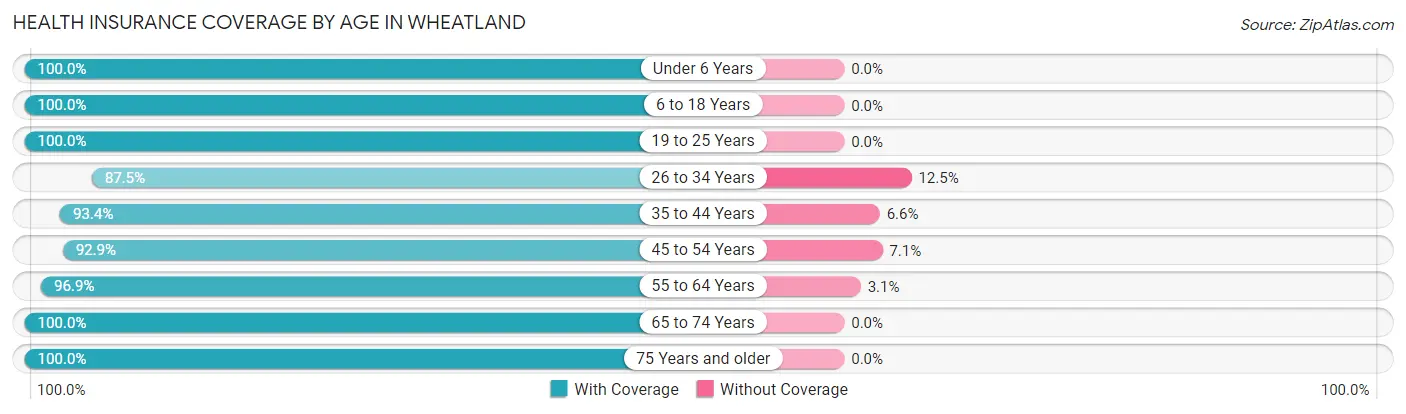
| Age Bracket | With Coverage | Without Coverage |
| Under 6 Years | 164 (100.0%) | 0 (0.0%) |
| 6 to 18 Years | 903 (100.0%) | 0 (0.0%) |
| 19 to 25 Years | 179 (100.0%) | 0 (0.0%) |
| 26 to 34 Years | 356 (87.5%) | 51 (12.5%) |
| 35 to 44 Years | 594 (93.4%) | 42 (6.6%) |
| 45 to 54 Years | 235 (92.9%) | 18 (7.1%) |
| 55 to 64 Years | 662 (96.9%) | 21 (3.1%) |
| 65 to 74 Years | 159 (100.0%) | 0 (0.0%) |
| 75 Years and older | 299 (100.0%) | 0 (0.0%) |
| Total | 3,551 (96.4%) | 132 (3.6%) |
Health Insurance Coverage by Citizenship Status in Wheatland
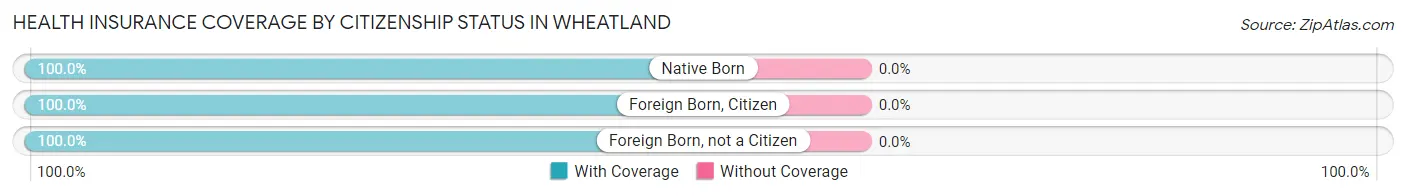
| Citizenship Status | With Coverage | Without Coverage |
| Native Born | 164 (100.0%) | 0 (0.0%) |
| Foreign Born, Citizen | 903 (100.0%) | 0 (0.0%) |
| Foreign Born, not a Citizen | 179 (100.0%) | 0 (0.0%) |
Health Insurance Coverage by Household Income in Wheatland
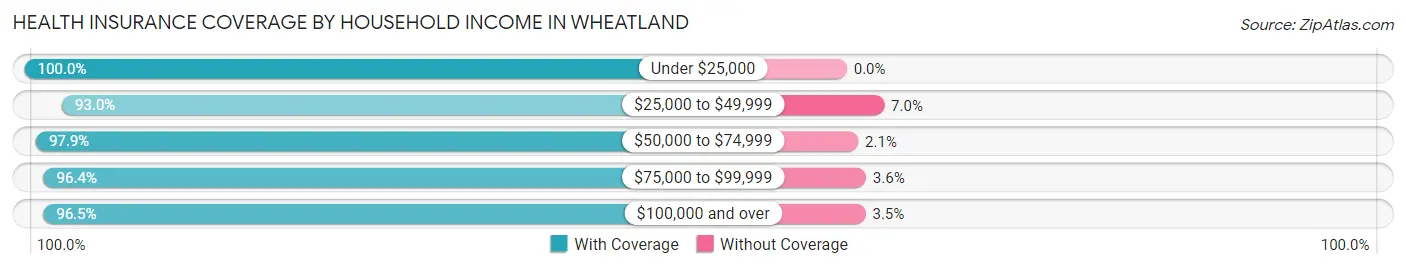
| Household Income | With Coverage | Without Coverage |
| Under $25,000 | 315 (100.0%) | 0 (0.0%) |
| $25,000 to $49,999 | 558 (93.0%) | 42 (7.0%) |
| $50,000 to $74,999 | 690 (97.9%) | 15 (2.1%) |
| $75,000 to $99,999 | 512 (96.4%) | 19 (3.6%) |
| $100,000 and over | 1,459 (96.5%) | 53 (3.5%) |
Public vs Private Health Insurance Coverage by Age in Wheatland
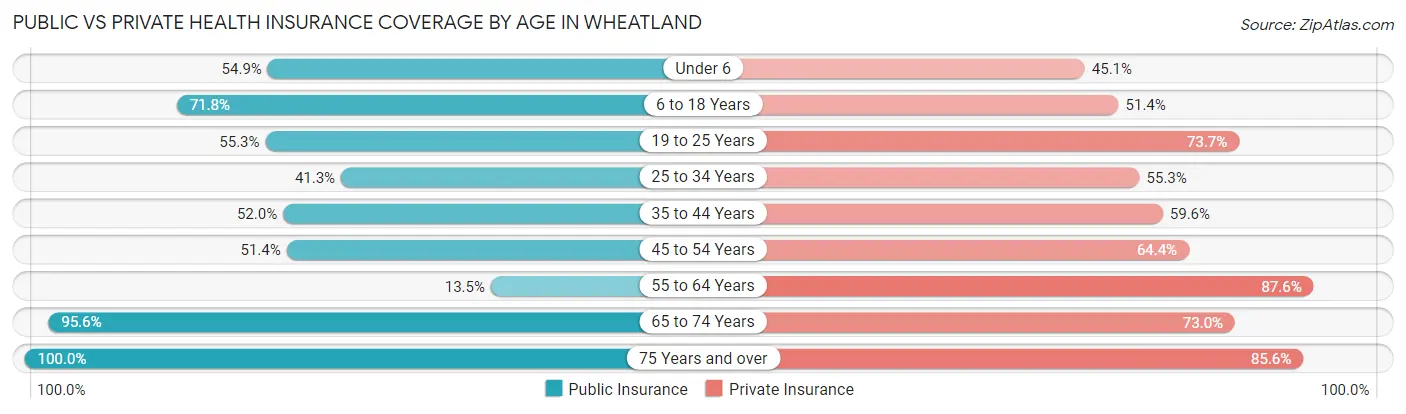
| Age Bracket | Public Insurance | Private Insurance |
| Under 6 | 90 (54.9%) | 74 (45.1%) |
| 6 to 18 Years | 648 (71.8%) | 464 (51.4%) |
| 19 to 25 Years | 99 (55.3%) | 132 (73.7%) |
| 25 to 34 Years | 168 (41.3%) | 225 (55.3%) |
| 35 to 44 Years | 331 (52.0%) | 379 (59.6%) |
| 45 to 54 Years | 130 (51.4%) | 163 (64.4%) |
| 55 to 64 Years | 92 (13.5%) | 598 (87.5%) |
| 65 to 74 Years | 152 (95.6%) | 116 (73.0%) |
| 75 Years and over | 299 (100.0%) | 256 (85.6%) |
| Total | 2,009 (54.5%) | 2,407 (65.3%) |
Disability Status by Sex by Age in Wheatland
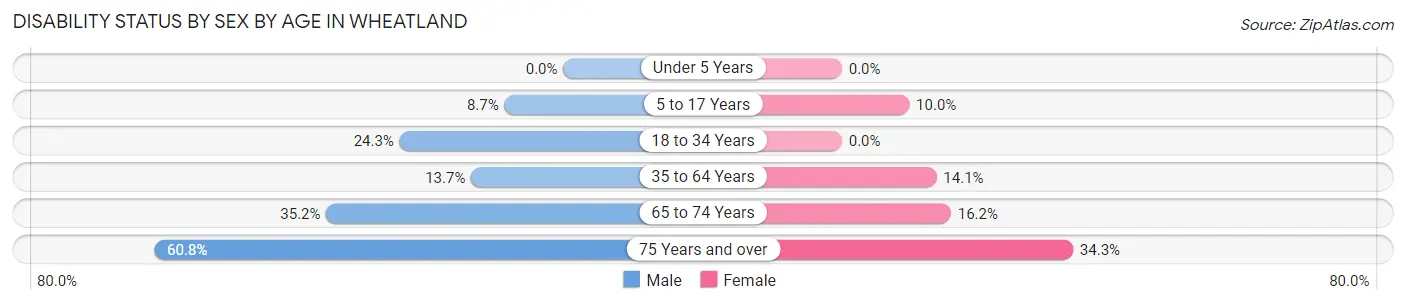
| Age Bracket | Male | Female |
| Under 5 Years | 0 (0.0%) | 0 (0.0%) |
| 5 to 17 Years | 33 (8.7%) | 53 (10.0%) |
| 18 to 34 Years | 69 (24.3%) | 0 (0.0%) |
| 35 to 64 Years | 106 (13.7%) | 112 (14.1%) |
| 65 to 74 Years | 19 (35.2%) | 17 (16.2%) |
| 75 Years and over | 79 (60.8%) | 58 (34.3%) |
Disability Class by Sex by Age in Wheatland
Disability Class: Hearing Difficulty
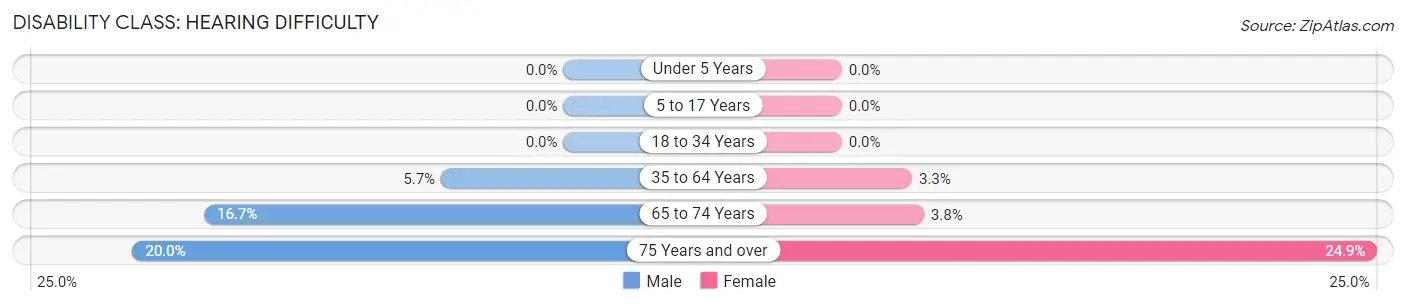
| Age Bracket | Male | Female |
| Under 5 Years | 0 (0.0%) | 0 (0.0%) |
| 5 to 17 Years | 0 (0.0%) | 0 (0.0%) |
| 18 to 34 Years | 0 (0.0%) | 0 (0.0%) |
| 35 to 64 Years | 44 (5.7%) | 26 (3.3%) |
| 65 to 74 Years | 9 (16.7%) | 4 (3.8%) |
| 75 Years and over | 26 (20.0%) | 42 (24.8%) |
Disability Class: Vision Difficulty
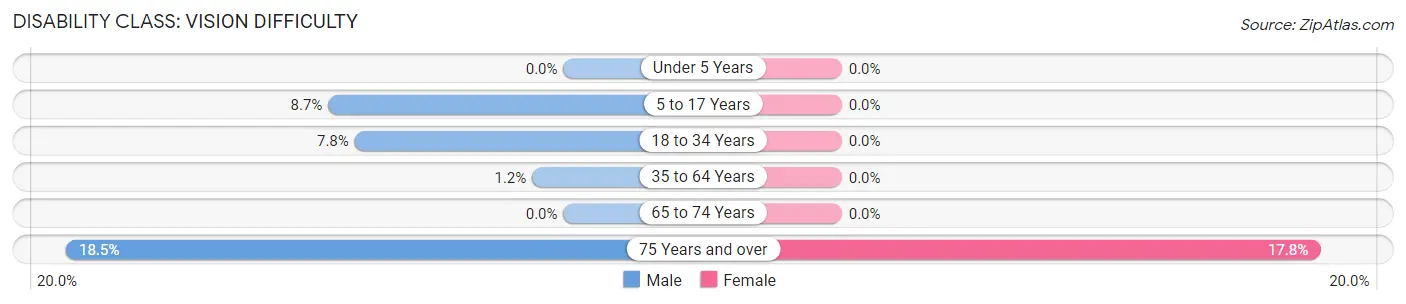
| Age Bracket | Male | Female |
| Under 5 Years | 0 (0.0%) | 0 (0.0%) |
| 5 to 17 Years | 33 (8.7%) | 0 (0.0%) |
| 18 to 34 Years | 22 (7.7%) | 0 (0.0%) |
| 35 to 64 Years | 9 (1.2%) | 0 (0.0%) |
| 65 to 74 Years | 0 (0.0%) | 0 (0.0%) |
| 75 Years and over | 24 (18.5%) | 30 (17.7%) |
Disability Class: Cognitive Difficulty
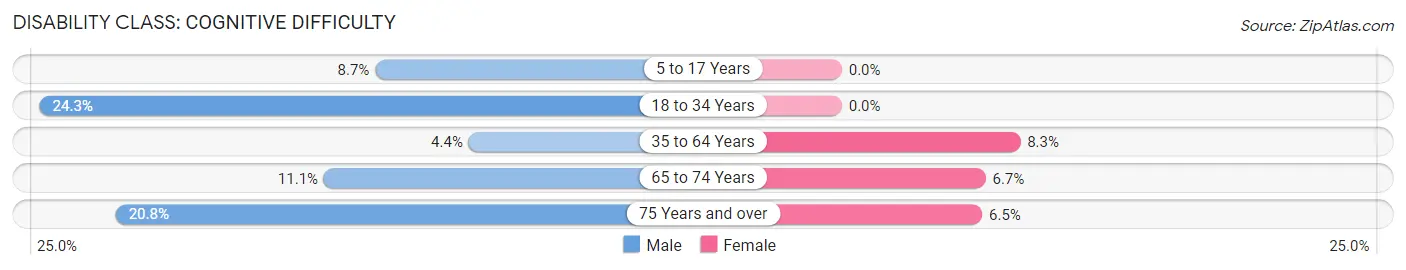
| Age Bracket | Male | Female |
| 5 to 17 Years | 33 (8.7%) | 0 (0.0%) |
| 18 to 34 Years | 69 (24.3%) | 0 (0.0%) |
| 35 to 64 Years | 34 (4.4%) | 66 (8.3%) |
| 65 to 74 Years | 6 (11.1%) | 7 (6.7%) |
| 75 Years and over | 27 (20.8%) | 11 (6.5%) |
Disability Class: Ambulatory Difficulty
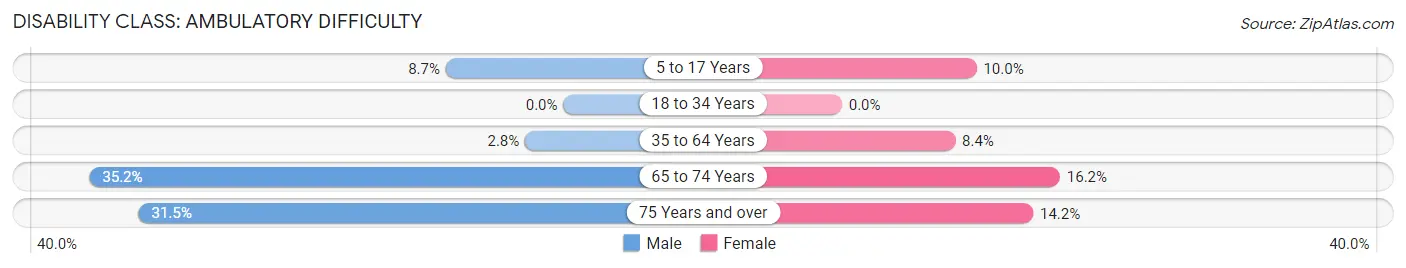
| Age Bracket | Male | Female |
| 5 to 17 Years | 33 (8.7%) | 53 (10.0%) |
| 18 to 34 Years | 0 (0.0%) | 0 (0.0%) |
| 35 to 64 Years | 22 (2.8%) | 67 (8.4%) |
| 65 to 74 Years | 19 (35.2%) | 17 (16.2%) |
| 75 Years and over | 41 (31.5%) | 24 (14.2%) |
Disability Class: Self-Care Difficulty
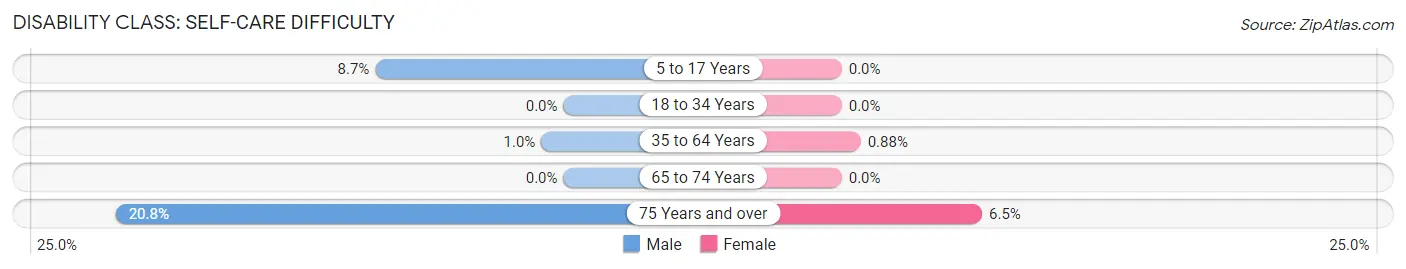
| Age Bracket | Male | Female |
| 5 to 17 Years | 33 (8.7%) | 0 (0.0%) |
| 18 to 34 Years | 0 (0.0%) | 0 (0.0%) |
| 35 to 64 Years | 8 (1.0%) | 7 (0.9%) |
| 65 to 74 Years | 0 (0.0%) | 0 (0.0%) |
| 75 Years and over | 27 (20.8%) | 11 (6.5%) |
Technology Access in Wheatland
Computing Device Access in Wheatland
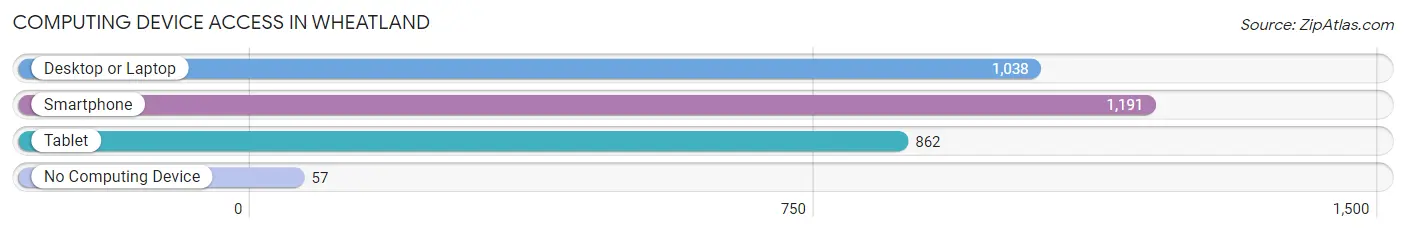
| Device Type | # Households | % Households |
| Desktop or Laptop | 1,038 | 80.6% |
| Smartphone | 1,191 | 92.5% |
| Tablet | 862 | 67.0% |
| No Computing Device | 57 | 4.4% |
| Total | 1,287 | 100.0% |
Internet Access in Wheatland
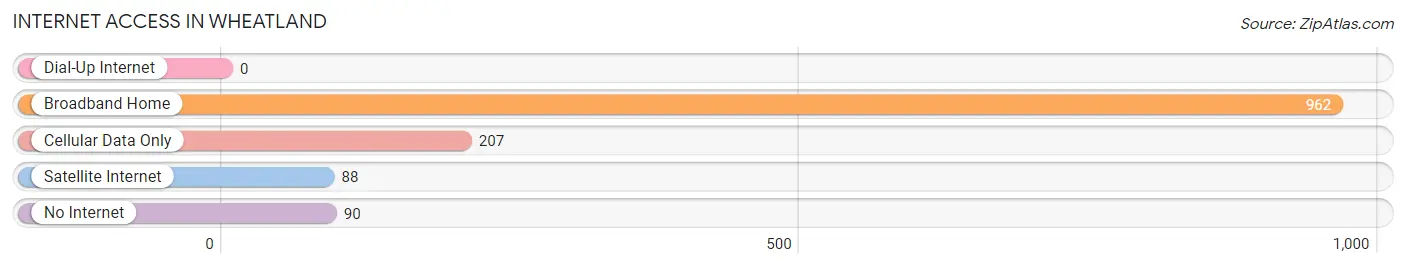
| Internet Type | # Households | % Households |
| Dial-Up Internet | 0 | 0.0% |
| Broadband Home | 962 | 74.8% |
| Cellular Data Only | 207 | 16.1% |
| Satellite Internet | 88 | 6.8% |
| No Internet | 90 | 7.0% |
| Total | 1,287 | 100.0% |
Wheatland Summary
Wheatland, California is a small town located in Yuba County, California. It is situated in the foothills of the Sierra Nevada Mountains, about 40 miles north of Sacramento. The town has a population of 3,456 people, according to the 2010 census.
History
Wheatland was founded in 1855 by a group of settlers from the Midwest. The town was named after the abundance of wheat that was grown in the area. The town was incorporated in 1867 and has remained a small, rural community ever since.
The town was an important stop on the Central Pacific Railroad, which connected the east and west coasts of the United States. The railroad brought many new settlers to the area, and the town grew rapidly.
In the early 1900s, Wheatland was a major producer of wheat, and the town was known as the “Wheat Capital of the World.” The town was also home to a large cannery, which canned fruits and vegetables for the local market.
Geography
Wheatland is located in the foothills of the Sierra Nevada Mountains, about 40 miles north of Sacramento. The town is situated at an elevation of about 500 feet above sea level.
The town is surrounded by rolling hills and farmland. The nearby Feather River provides a source of irrigation for the local farms.
The climate in Wheatland is mild and dry, with hot summers and cool winters. The average annual temperature is about 60 degrees Fahrenheit.
Economy
Wheatland’s economy is largely based on agriculture. The town is home to several large farms, which produce a variety of crops, including wheat, corn, alfalfa, and hay.
The town is also home to several small businesses, including restaurants, shops, and a movie theater.
Demographics
According to the 2010 census, Wheatland has a population of 3,456 people. The town is predominantly white, with about 75% of the population identifying as Caucasian. The remaining 25% of the population is made up of African Americans, Hispanics, and Asians.
The median household income in Wheatland is $45,000, and the median home value is $175,000. The town has a low unemployment rate of 4.2%.
Conclusion
Wheatland, California is a small town located in Yuba County, California. It is situated in the foothills of the Sierra Nevada Mountains, about 40 miles north of Sacramento. The town has a population of 3,456 people, according to the 2010 census. Wheatland’s economy is largely based on agriculture, and the town is home to several small businesses. The town is predominantly white, with about 75% of the population identifying as Caucasian. The median household income in Wheatland is $45,000, and the median home value is $175,000. The town has a low unemployment rate of 4.2%.
Common Questions
What is Per Capita Income in Wheatland?
Per Capita income in Wheatland is $35,512.
What is the Median Family Income in Wheatland?
Median Family Income in Wheatland is $82,879.
What is the Median Household income in Wheatland?
Median Household Income in Wheatland is $76,991.
What is Income or Wage Gap in Wheatland?
Income or Wage Gap in Wheatland is 4.0%.
Women in Wheatland earn 96.0 cents for every dollar earned by a man.
What is Inequality or Gini Index in Wheatland?
Inequality or Gini Index in Wheatland is 0.40.
What is the Total Population of Wheatland?
Total Population of Wheatland is 3,702.
What is the Total Male Population of Wheatland?
Total Male Population of Wheatland is 1,708.
What is the Total Female Population of Wheatland?
Total Female Population of Wheatland is 1,994.
What is the Ratio of Males per 100 Females in Wheatland?
There are 85.66 Males per 100 Females in Wheatland.
What is the Ratio of Females per 100 Males in Wheatland?
There are 116.74 Females per 100 Males in Wheatland.
What is the Median Population Age in Wheatland?
Median Population Age in Wheatland is 39.1 Years.
What is the Average Family Size in Wheatland
Average Family Size in Wheatland is 3.1 People.
What is the Average Household Size in Wheatland
Average Household Size in Wheatland is 2.9 People.
How Large is the Labor Force in Wheatland?
There are 1,729 People in the Labor Forcein in Wheatland.
What is the Percentage of People in the Labor Force in Wheatland?
64.0% of People are in the Labor Force in Wheatland.
What is the Unemployment Rate in Wheatland?
Unemployment Rate in Wheatland is 3.3%.