Cities with the Highest Percentage of Population with a Degree in Liberal Arts and History in Kansas
RELATED REPORTS & OPTIONS
Liberal Arts and History
Kansas
Compare Cities
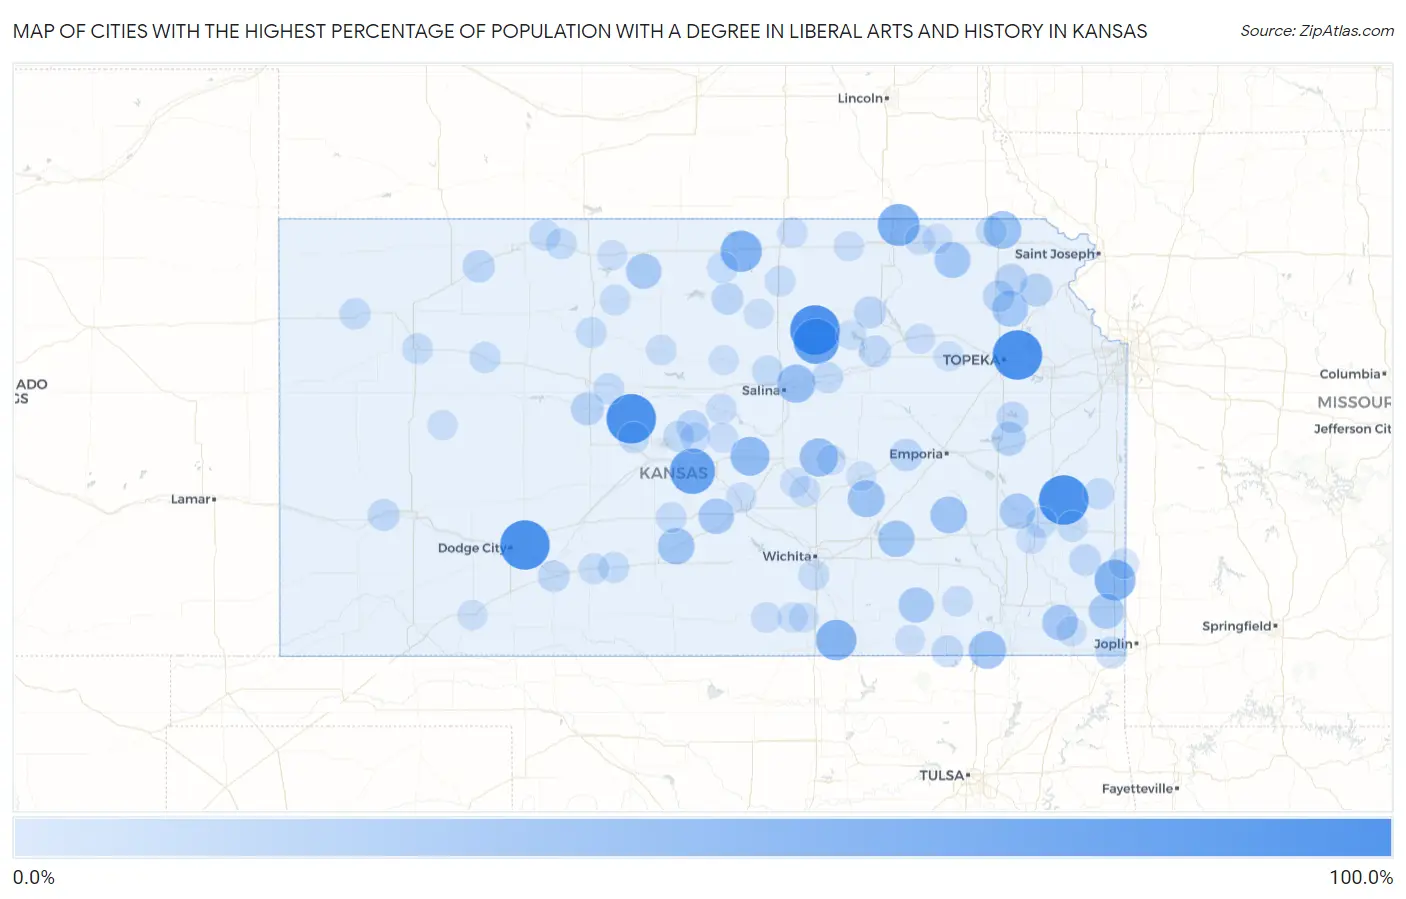
Map of Cities with the Highest Percentage of Population with a Degree in Liberal Arts and History in Kansas
0.0%
100.0%
Cities with the Highest Percentage of Population with a Degree in Liberal Arts and History in Kansas
| City | % Graduates | vs State | vs National | |
| 1. | Grantville | 100.0% | 4.6%(+95.4)#1 | 4.9%(+95.1)#31 |
| 2. | Wright | 100.0% | 4.6%(+95.4)#2 | 4.9%(+95.1)#55 |
| 3. | Kincaid | 100.0% | 4.6%(+95.4)#3 | 4.9%(+95.1)#60 |
| 4. | Codell | 100.0% | 4.6%(+95.4)#5 | 4.9%(+95.1)#75 |
| 5. | Furley | 100.0% | 4.6%(+95.4)#6 | 4.9%(+95.1)#76 |
| 6. | Galatia | 100.0% | 4.6%(+95.4)#7 | 4.9%(+95.1)#86 |
| 7. | Oak Hill | 100.0% | 4.6%(+95.4)#8 | 4.9%(+95.1)#88 |
| 8. | Longford | 80.0% | 4.6%(+75.4)#9 | 4.9%(+75.1)#106 |
| 9. | Raymond | 79.2% | 4.6%(+74.6)#10 | 4.9%(+74.3)#108 |
| 10. | Oketo | 63.6% | 4.6%(+59.1)#11 | 4.9%(+58.8)#154 |
| 11. | Formoso | 60.0% | 4.6%(+55.4)#12 | 4.9%(+55.1)#179 |
| 12. | Franklin | 58.8% | 4.6%(+54.2)#13 | 4.9%(+53.9)#183 |
| 13. | Geuda Springs | 57.1% | 4.6%(+52.6)#14 | 4.9%(+52.3)#188 |
| 14. | Windom | 50.0% | 4.6%(+45.4)#15 | 4.9%(+45.1)#265 |
| 15. | Lehigh | 45.9% | 4.6%(+41.4)#16 | 4.9%(+41.1)#301 |
| 16. | New Cambria | 45.5% | 4.6%(+40.9)#17 | 4.9%(+40.6)#306 |
| 17. | Tyro | 42.9% | 4.6%(+38.3)#18 | 4.9%(+38.0)#336 |
| 18. | Morrill | 42.9% | 4.6%(+38.3)#19 | 4.9%(+38.0)#340 |
| 19. | Burns | 40.0% | 4.6%(+35.4)#20 | 4.9%(+35.1)#377 |
| 20. | Hamilton | 38.9% | 4.6%(+34.3)#21 | 4.9%(+34.0)#399 |
| 21. | Preston | 38.1% | 4.6%(+33.5)#22 | 4.9%(+33.2)#409 |
| 22. | Rosalia | 37.5% | 4.6%(+32.9)#23 | 4.9%(+32.6)#420 |
| 23. | Yale | 37.5% | 4.6%(+32.9)#24 | 4.9%(+32.6)#422 |
| 24. | Centralia | 35.5% | 4.6%(+30.9)#25 | 4.9%(+30.6)#473 |
| 25. | Denison | 35.0% | 4.6%(+30.4)#26 | 4.9%(+30.1)#483 |
| 26. | Neosho Falls | 33.3% | 4.6%(+28.8)#27 | 4.9%(+28.5)#537 |
| 27. | Abbyville | 33.3% | 4.6%(+28.8)#28 | 4.9%(+28.5)#552 |
| 28. | Labette | 33.3% | 4.6%(+28.8)#29 | 4.9%(+28.5)#563 |
| 29. | Grenola | 32.3% | 4.6%(+27.7)#30 | 4.9%(+27.4)#588 |
| 30. | Weir | 31.6% | 4.6%(+27.0)#31 | 4.9%(+26.7)#602 |
| 31. | Gaylord | 31.6% | 4.6%(+27.0)#32 | 4.9%(+26.7)#608 |
| 32. | Melvern | 26.1% | 4.6%(+21.5)#33 | 4.9%(+21.2)#837 |
| 33. | Schoenchen | 22.4% | 4.6%(+17.9)#34 | 4.9%(+17.6)#1,068 |
| 34. | Effingham | 22.0% | 4.6%(+17.4)#35 | 4.9%(+17.1)#1,115 |
| 35. | Whiting | 20.7% | 4.6%(+16.1)#36 | 4.9%(+15.8)#1,218 |
| 36. | Strong City | 20.0% | 4.6%(+15.4)#37 | 4.9%(+15.1)#1,273 |
| 37. | St. Marks | 20.0% | 4.6%(+15.4)#38 | 4.9%(+15.1)#1,303 |
| 38. | Jennings | 18.8% | 4.6%(+14.2)#39 | 4.9%(+13.9)#1,427 |
| 39. | Beloit | 18.2% | 4.6%(+13.6)#40 | 4.9%(+13.3)#1,474 |
| 40. | Leonardville | 17.9% | 4.6%(+13.3)#41 | 4.9%(+13.0)#1,531 |
| 41. | Holyrood | 17.4% | 4.6%(+12.8)#42 | 4.9%(+12.5)#1,595 |
| 42. | Holton | 17.4% | 4.6%(+12.8)#43 | 4.9%(+12.5)#1,605 |
| 43. | Fort Riley | 17.1% | 4.6%(+12.5)#44 | 4.9%(+12.2)#1,651 |
| 44. | Vassar | 16.9% | 4.6%(+12.3)#45 | 4.9%(+12.0)#1,674 |
| 45. | Deerfield | 16.7% | 4.6%(+12.1)#46 | 4.9%(+11.8)#1,698 |
| 46. | Hepler | 16.7% | 4.6%(+12.1)#47 | 4.9%(+11.8)#1,744 |
| 47. | Chautauqua | 16.7% | 4.6%(+12.1)#48 | 4.9%(+11.8)#1,752 |
| 48. | Baxter Springs | 16.6% | 4.6%(+12.1)#49 | 4.9%(+11.8)#1,760 |
| 49. | Bucklin | 16.3% | 4.6%(+11.7)#50 | 4.9%(+11.4)#1,806 |
| 50. | Abilene | 14.5% | 4.6%(+9.97)#51 | 4.9%(+9.66)#2,147 |
| 51. | Brewster | 14.3% | 4.6%(+9.73)#52 | 4.9%(+9.41)#2,207 |
| 52. | Olmitz | 14.3% | 4.6%(+9.73)#53 | 4.9%(+9.41)#2,248 |
| 53. | Culver | 14.3% | 4.6%(+9.73)#54 | 4.9%(+9.41)#2,252 |
| 54. | Almena | 14.0% | 4.6%(+9.47)#55 | 4.9%(+9.16)#2,296 |
| 55. | Victoria | 13.9% | 4.6%(+9.30)#56 | 4.9%(+8.99)#2,339 |
| 56. | Mound City | 13.8% | 4.6%(+9.20)#57 | 4.9%(+8.89)#2,373 |
| 57. | Quinter | 13.7% | 4.6%(+9.11)#58 | 4.9%(+8.80)#2,395 |
| 58. | Claflin | 13.6% | 4.6%(+9.08)#59 | 4.9%(+8.76)#2,408 |
| 59. | Jewell | 13.6% | 4.6%(+9.08)#60 | 4.9%(+8.76)#2,410 |
| 60. | Bronson | 13.5% | 4.6%(+8.95)#61 | 4.9%(+8.64)#2,450 |
| 61. | Gas | 13.5% | 4.6%(+8.95)#62 | 4.9%(+8.64)#2,451 |
| 62. | Haviland | 13.0% | 4.6%(+8.45)#63 | 4.9%(+8.14)#2,607 |
| 63. | Prairie View | 12.9% | 4.6%(+8.34)#64 | 4.9%(+8.03)#2,648 |
| 64. | Plainville | 12.8% | 4.6%(+8.25)#65 | 4.9%(+7.94)#2,674 |
| 65. | Oakley | 12.7% | 4.6%(+8.10)#66 | 4.9%(+7.79)#2,710 |
| 66. | Stafford | 12.6% | 4.6%(+8.04)#67 | 4.9%(+7.73)#2,727 |
| 67. | Woodston | 12.5% | 4.6%(+7.94)#68 | 4.9%(+7.63)#2,799 |
| 68. | Haysville | 12.4% | 4.6%(+7.88)#69 | 4.9%(+7.57)#2,810 |
| 69. | Hesston | 12.1% | 4.6%(+7.54)#70 | 4.9%(+7.23)#2,925 |
| 70. | Greensburg | 12.1% | 4.6%(+7.52)#71 | 4.9%(+7.21)#2,935 |
| 71. | Concordia | 12.0% | 4.6%(+7.48)#72 | 4.9%(+7.16)#2,954 |
| 72. | Sabetha | 11.9% | 4.6%(+7.37)#73 | 4.9%(+7.06)#3,002 |
| 73. | Longton | 11.8% | 4.6%(+7.20)#74 | 4.9%(+6.89)#3,076 |
| 74. | Arcadia | 11.8% | 4.6%(+7.20)#75 | 4.9%(+6.89)#3,079 |
| 75. | Beattie | 11.1% | 4.6%(+6.55)#76 | 4.9%(+6.24)#3,369 |
| 76. | Luray | 11.1% | 4.6%(+6.55)#77 | 4.9%(+6.24)#3,377 |
| 77. | Argonia | 11.0% | 4.6%(+6.42)#78 | 4.9%(+6.10)#3,440 |
| 78. | Kanopolis | 10.9% | 4.6%(+6.31)#79 | 4.9%(+6.00)#3,498 |
| 79. | Willowbrook | 10.8% | 4.6%(+6.25)#80 | 4.9%(+5.94)#3,541 |
| 80. | Humboldt | 10.5% | 4.6%(+5.97)#81 | 4.9%(+5.65)#3,681 |
| 81. | Washington | 10.1% | 4.6%(+5.52)#82 | 4.9%(+5.21)#3,929 |
| 82. | Munden | 10.0% | 4.6%(+5.44)#83 | 4.9%(+5.13)#4,015 |
| 83. | Mayfield | 10.0% | 4.6%(+5.44)#84 | 4.9%(+5.13)#4,020 |
| 84. | St George | 9.8% | 4.6%(+5.27)#85 | 4.9%(+4.96)#4,087 |
| 85. | Wakefield | 9.8% | 4.6%(+5.24)#86 | 4.9%(+4.93)#4,102 |
| 86. | Cedar Vale | 9.8% | 4.6%(+5.24)#87 | 4.9%(+4.93)#4,105 |
| 87. | Oswego | 9.7% | 4.6%(+5.15)#88 | 4.9%(+4.84)#4,166 |
| 88. | Bushton | 9.7% | 4.6%(+5.12)#89 | 4.9%(+4.81)#4,201 |
| 89. | Geneseo | 9.5% | 4.6%(+4.96)#90 | 4.9%(+4.65)#4,322 |
| 90. | Paxico | 9.4% | 4.6%(+4.81)#91 | 4.9%(+4.50)#4,420 |
| 91. | Wellington | 9.4% | 4.6%(+4.80)#92 | 4.9%(+4.49)#4,435 |
| 92. | Hillsboro | 9.3% | 4.6%(+4.72)#93 | 4.9%(+4.40)#4,485 |
| 93. | Healy | 9.3% | 4.6%(+4.70)#94 | 4.9%(+4.39)#4,505 |
| 94. | Moundridge | 9.2% | 4.6%(+4.66)#95 | 4.9%(+4.34)#4,542 |
| 95. | Lincoln Center | 9.2% | 4.6%(+4.65)#96 | 4.9%(+4.34)#4,546 |
| 96. | Meade | 9.1% | 4.6%(+4.57)#97 | 4.9%(+4.26)#4,606 |
| 97. | Axtell | 9.1% | 4.6%(+4.53)#98 | 4.9%(+4.22)#4,648 |
| 98. | Glasco | 9.1% | 4.6%(+4.53)#99 | 4.9%(+4.22)#4,655 |
| 99. | Agra | 9.1% | 4.6%(+4.53)#100 | 4.9%(+4.22)#4,670 |
| 100. | Florence | 8.7% | 4.6%(+4.19)#101 | 4.9%(+3.88)#4,923 |
Common Questions
What are the Top 10 Cities with the Highest Percentage of Population with a Degree in Liberal Arts and History in Kansas?
Top 10 Cities with the Highest Percentage of Population with a Degree in Liberal Arts and History in Kansas are:
What city has the Highest Percentage of Population with a Degree in Liberal Arts and History in Kansas?
Grantville has the Highest Percentage of Population with a Degree in Liberal Arts and History in Kansas with 100.0%.
What is the Percentage of Population with a Degree in Liberal Arts and History in the State of Kansas?
Percentage of Population with a Degree in Liberal Arts and History in Kansas is 4.6%.
What is the Percentage of Population with a Degree in Liberal Arts and History in the United States?
Percentage of Population with a Degree in Liberal Arts and History in the United States is 4.9%.