Delft Colony, CA Map & Demographics
Delft Colony Map
Delft Colony Overview
$6,714
PER CAPITA INCOME
$33,320
AVG FAMILY INCOME
$33,594
AVG HOUSEHOLD INCOME
0.44
INEQUALITY / GINI INDEX
1,038
TOTAL POPULATION
458
MALE POPULATION
580
FEMALE POPULATION
78.97
MALES / 100 FEMALES
126.64
FEMALES / 100 MALES
24.3
MEDIAN AGE
5.7
AVG FAMILY SIZE
5.7
AVG HOUSEHOLD SIZE
380
LABOR FORCE [ PEOPLE ]
49.9%
PERCENT IN LABOR FORCE
50.3%
UNEMPLOYMENT RATE
Income in Delft Colony
Income Overview in Delft Colony
Per Capita Income in Delft Colony is $6,714, while median incomes of families and households are $33,320 and $33,594 respectively.
| Characteristic | Number | Measure |
| Per Capita Income | 1,038 | $6,714 |
| Median Family Income | 168 | $33,320 |
| Mean Family Income | 168 | $34,197 |
| Median Household Income | 182 | $33,594 |
| Mean Household Income | 182 | $36,931 |
| Income Deficit | 168 | $0 |
| Wage / Income Gap (%) | 1,038 | 0.00% |
| Wage / Income Gap ($) | 1,038 | 100.00¢ per $1 |
| Gini / Inequality Index | 1,038 | 0.44 |
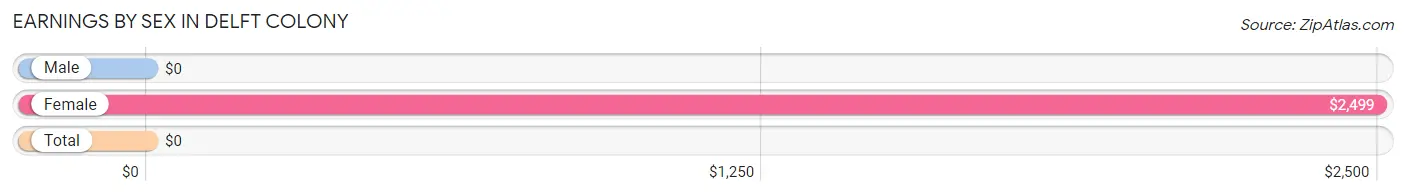
Earnings by Sex in Delft Colony
| Sex | Number | Average Earnings |
| Male | 146 (60.3%) | $0 |
| Female | 96 (39.7%) | $2,499 |
| Total | 242 (100.0%) | $0 |
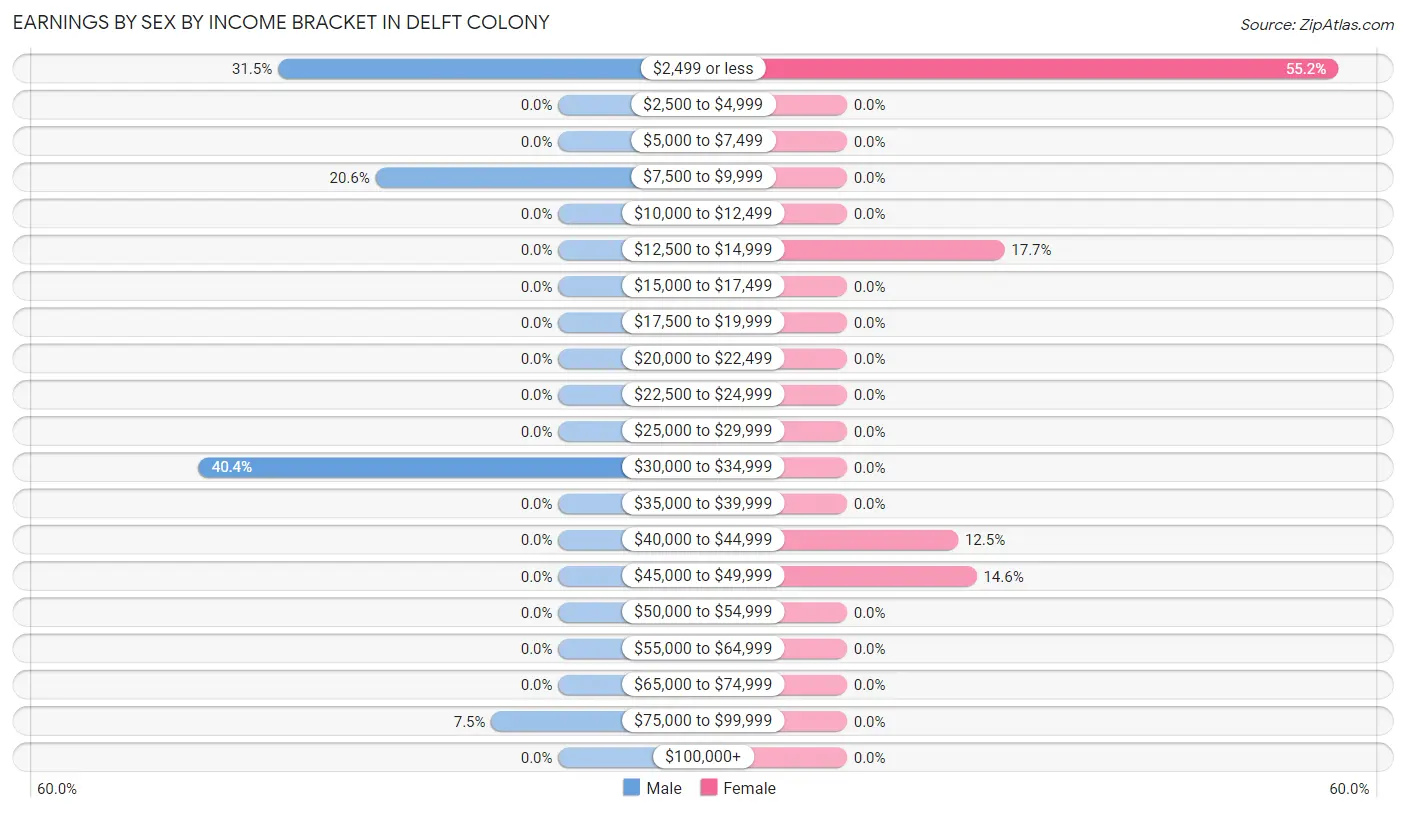
Earnings by Sex by Income Bracket in Delft Colony
The most common earnings brackets in Delft Colony are $30,000 to $34,999 for men (59 | 40.4%) and $2,499 or less for women (53 | 55.2%).
| Income | Male | Female |
| $2,499 or less | 46 (31.5%) | 53 (55.2%) |
| $2,500 to $4,999 | 0 (0.0%) | 0 (0.0%) |
| $5,000 to $7,499 | 0 (0.0%) | 0 (0.0%) |
| $7,500 to $9,999 | 30 (20.5%) | 0 (0.0%) |
| $10,000 to $12,499 | 0 (0.0%) | 0 (0.0%) |
| $12,500 to $14,999 | 0 (0.0%) | 17 (17.7%) |
| $15,000 to $17,499 | 0 (0.0%) | 0 (0.0%) |
| $17,500 to $19,999 | 0 (0.0%) | 0 (0.0%) |
| $20,000 to $22,499 | 0 (0.0%) | 0 (0.0%) |
| $22,500 to $24,999 | 0 (0.0%) | 0 (0.0%) |
| $25,000 to $29,999 | 0 (0.0%) | 0 (0.0%) |
| $30,000 to $34,999 | 59 (40.4%) | 0 (0.0%) |
| $35,000 to $39,999 | 0 (0.0%) | 0 (0.0%) |
| $40,000 to $44,999 | 0 (0.0%) | 12 (12.5%) |
| $45,000 to $49,999 | 0 (0.0%) | 14 (14.6%) |
| $50,000 to $54,999 | 0 (0.0%) | 0 (0.0%) |
| $55,000 to $64,999 | 0 (0.0%) | 0 (0.0%) |
| $65,000 to $74,999 | 0 (0.0%) | 0 (0.0%) |
| $75,000 to $99,999 | 11 (7.5%) | 0 (0.0%) |
| $100,000+ | 0 (0.0%) | 0 (0.0%) |
| Total | 146 (100.0%) | 96 (100.0%) |
Earnings by Sex by Educational Attainment in Delft Colony
| Educational Attainment | Male Income | Female Income |
| Less than High School | - | - |
| High School Diploma | - | - |
| College or Associate's Degree | - | - |
| Bachelor's Degree | - | - |
| Graduate Degree | - | - |
| Total | - | - |
Family Income in Delft Colony
Family Income Brackets in Delft Colony
According to the Delft Colony family income data, there are 64 families falling into the $25,000 to $34,999 income range, which is the most common income bracket and makes up 38.1% of all families.
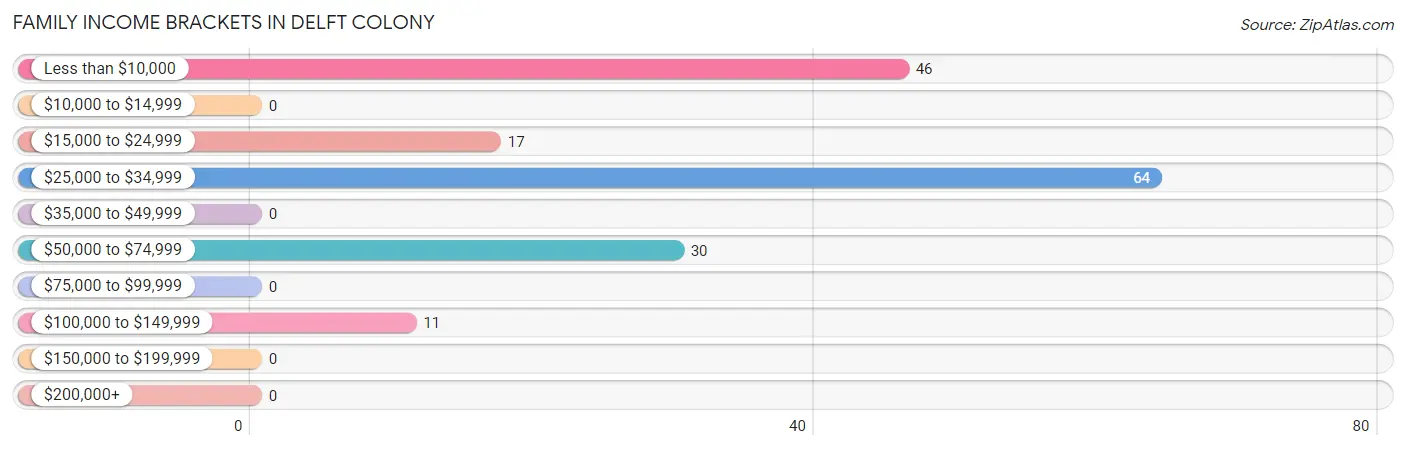
| Income Bracket | # Families | % Families |
| Less than $10,000 | 46 | 27.4% |
| $10,000 to $14,999 | 0 | 0.0% |
| $15,000 to $24,999 | 17 | 10.1% |
| $25,000 to $34,999 | 64 | 38.1% |
| $35,000 to $49,999 | 0 | 0.0% |
| $50,000 to $74,999 | 30 | 17.9% |
| $75,000 to $99,999 | 0 | 0.0% |
| $100,000 to $149,999 | 11 | 6.5% |
| $150,000 to $199,999 | 0 | 0.0% |
| $200,000+ | 0 | 0.0% |
Family Income by Famaliy Size in Delft Colony
2-person families (58 | 34.5%) account for the highest median family income in Delft Colony with $56,000 per family, while 2-person families (58 | 34.5%) have the highest median income of $28,000 per family member.
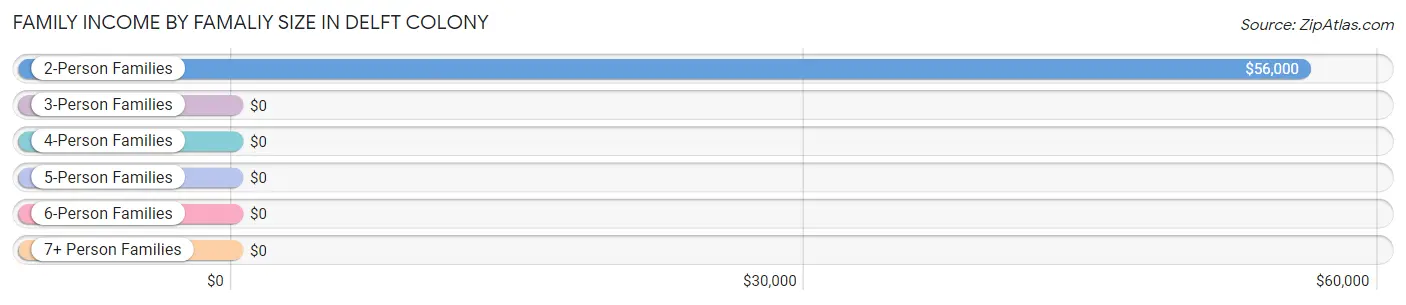
| Income Bracket | # Families | Median Income |
| 2-Person Families | 58 (34.5%) | $56,000 |
| 3-Person Families | 46 (27.4%) | $0 |
| 4-Person Families | 0 (0.0%) | $0 |
| 5-Person Families | 64 (38.1%) | $0 |
| 6-Person Families | 0 (0.0%) | $0 |
| 7+ Person Families | 0 (0.0%) | $0 |
| Total | 168 (100.0%) | $33,320 |
Family Income by Number of Earners in Delft Colony
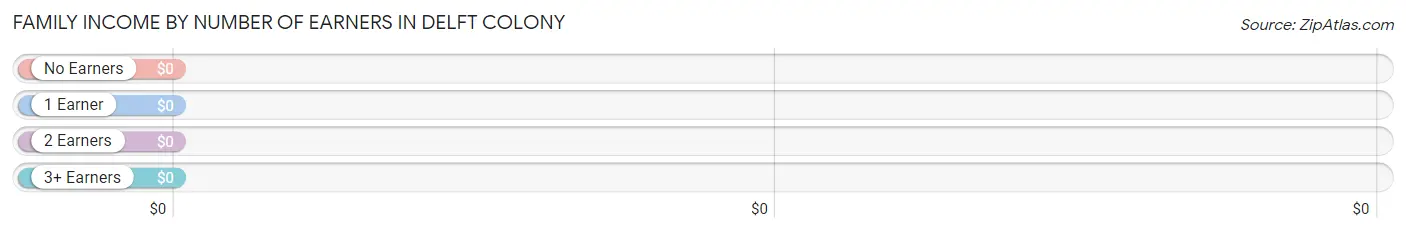
| Number of Earners | # Families | Median Income |
| No Earners | 17 (10.1%) | $0 |
| 1 Earner | 110 (65.5%) | $0 |
| 2 Earners | 41 (24.4%) | $0 |
| 3+ Earners | 0 (0.0%) | $0 |
| Total | 168 (100.0%) | $33,320 |
Household Income in Delft Colony
Household Income Brackets in Delft Colony
With 64 households falling in the category, the $25,000 to $34,999 income range is the most frequent in Delft Colony, accounting for 35.2% of all households.
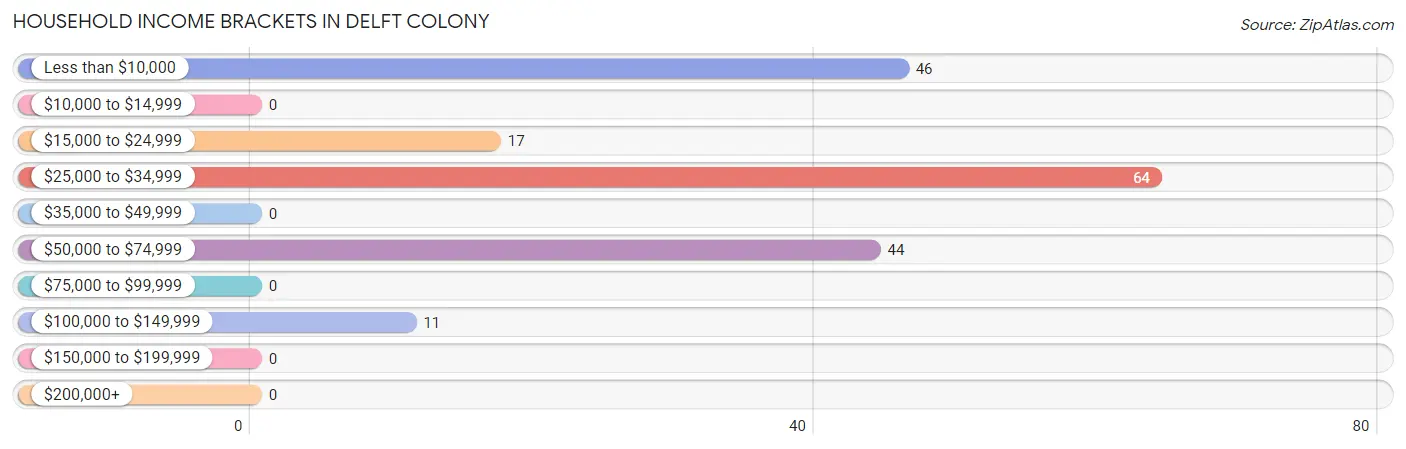
| Income Bracket | # Households | % Households |
| Less than $10,000 | 46 | 25.3% |
| $10,000 to $14,999 | 0 | 0.0% |
| $15,000 to $24,999 | 17 | 9.3% |
| $25,000 to $34,999 | 64 | 35.2% |
| $35,000 to $49,999 | 0 | 0.0% |
| $50,000 to $74,999 | 44 | 24.2% |
| $75,000 to $99,999 | 0 | 0.0% |
| $100,000 to $149,999 | 11 | 6.0% |
| $150,000 to $199,999 | 0 | 0.0% |
| $200,000+ | 0 | 0.0% |
Household Income by Householder Age in Delft Colony
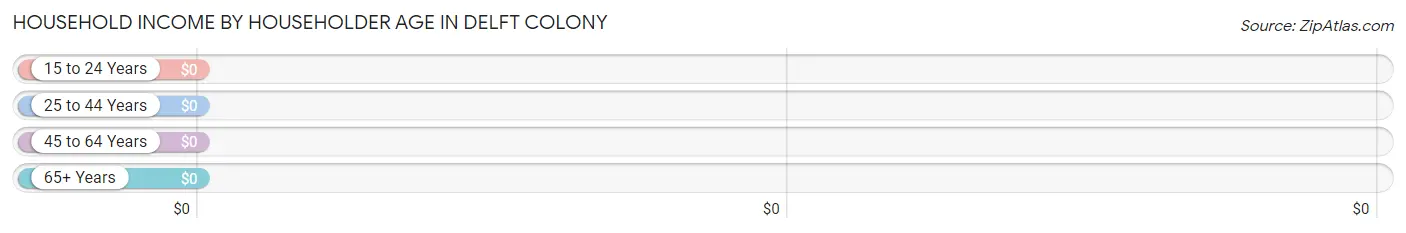
| Income Bracket | # Households | Median Income |
| 15 to 24 Years | 11 (6.0%) | $0 |
| 25 to 44 Years | 46 (25.3%) | $0 |
| 45 to 64 Years | 108 (59.3%) | $0 |
| 65+ Years | 17 (9.3%) | $0 |
| Total | 182 (100.0%) | $33,594 |
Poverty in Delft Colony
Income Below Poverty by Sex and Age in Delft Colony
With 87.5% poverty level for males and 92.6% for females among the residents of Delft Colony, under 5 year old males and 25 to 34 year old females are the most vulnerable to poverty, with 277 males (100.0%) and 191 females (100.0%) in their respective age groups living below the poverty level.
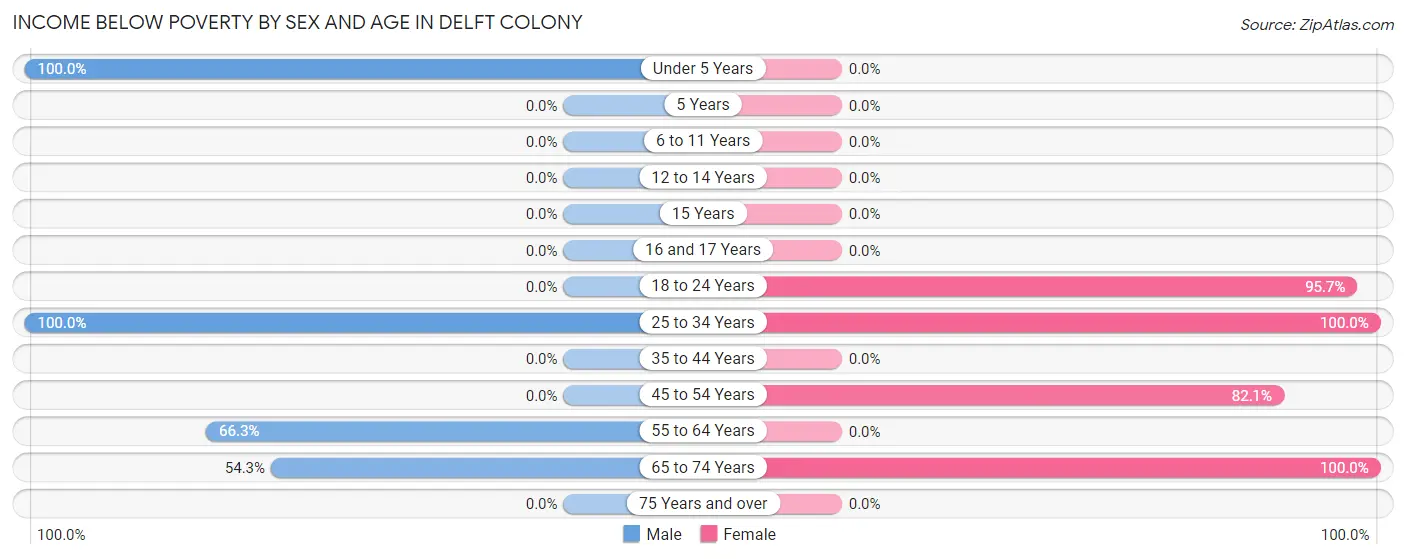
| Age Bracket | Male | Female |
| Under 5 Years | 277 (100.0%) | 0 (0.0%) |
| 5 Years | 0 (0.0%) | 0 (0.0%) |
| 6 to 11 Years | 0 (0.0%) | 0 (0.0%) |
| 12 to 14 Years | 0 (0.0%) | 0 (0.0%) |
| 15 Years | 0 (0.0%) | 0 (0.0%) |
| 16 and 17 Years | 0 (0.0%) | 0 (0.0%) |
| 18 to 24 Years | 0 (0.0%) | 265 (95.7%) |
| 25 to 34 Years | 46 (100.0%) | 191 (100.0%) |
| 35 to 44 Years | 0 (0.0%) | 0 (0.0%) |
| 45 to 54 Years | 0 (0.0%) | 64 (82.1%) |
| 55 to 64 Years | 59 (66.3%) | 0 (0.0%) |
| 65 to 74 Years | 19 (54.3%) | 17 (100.0%) |
| 75 Years and over | 0 (0.0%) | 0 (0.0%) |
| Total | 401 (87.5%) | 537 (92.6%) |
Income Above Poverty by Sex and Age in Delft Colony
According to the poverty statistics in Delft Colony, males aged 18 to 24 years and females aged 55 to 64 years are the age groups that are most secure financially, with 100.0% of males and 100.0% of females in these age groups living above the poverty line.
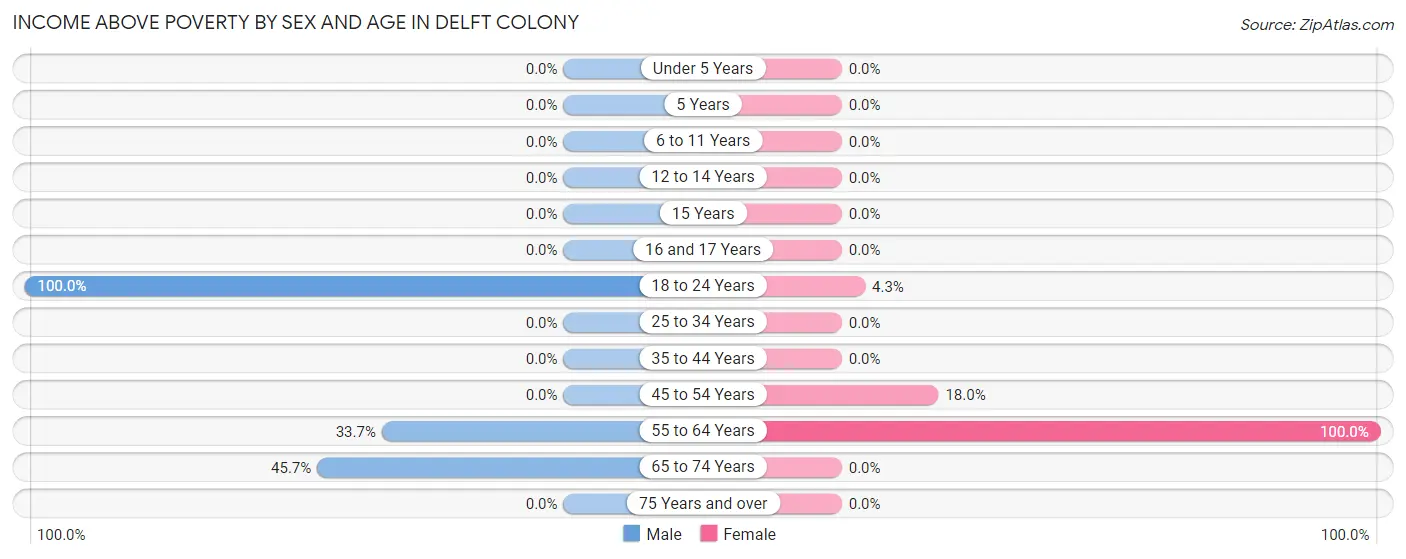
| Age Bracket | Male | Female |
| Under 5 Years | 0 (0.0%) | 0 (0.0%) |
| 5 Years | 0 (0.0%) | 0 (0.0%) |
| 6 to 11 Years | 0 (0.0%) | 0 (0.0%) |
| 12 to 14 Years | 0 (0.0%) | 0 (0.0%) |
| 15 Years | 0 (0.0%) | 0 (0.0%) |
| 16 and 17 Years | 0 (0.0%) | 0 (0.0%) |
| 18 to 24 Years | 11 (100.0%) | 12 (4.3%) |
| 25 to 34 Years | 0 (0.0%) | 0 (0.0%) |
| 35 to 44 Years | 0 (0.0%) | 0 (0.0%) |
| 45 to 54 Years | 0 (0.0%) | 14 (17.9%) |
| 55 to 64 Years | 30 (33.7%) | 17 (100.0%) |
| 65 to 74 Years | 16 (45.7%) | 0 (0.0%) |
| 75 Years and over | 0 (0.0%) | 0 (0.0%) |
| Total | 57 (12.4%) | 43 (7.4%) |
Income Below Poverty Among Married-Couple Families in Delft Colony
The poverty statistics for married-couple families in Delft Colony show that 66.4% or 81 of the total 122 families live below the poverty line. Families with 1 or 2 children have the highest poverty rate of 100.0%, comprising of 64 families. On the other hand, families with no children have the lowest poverty rate of 29.3%, which includes 17 families.
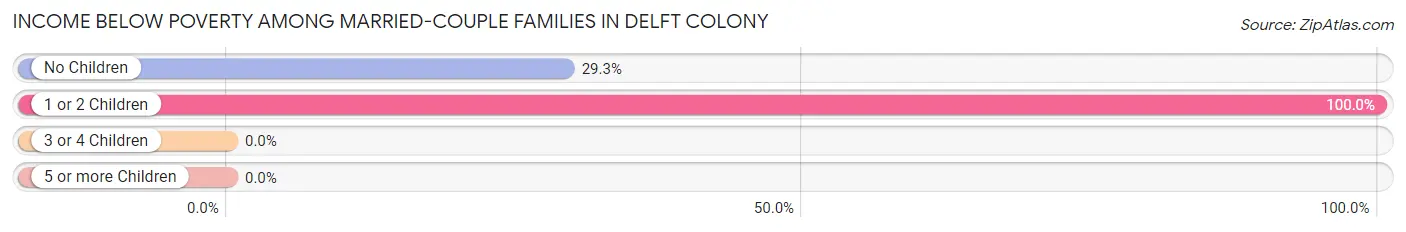
| Children | Above Poverty | Below Poverty |
| No Children | 41 (70.7%) | 17 (29.3%) |
| 1 or 2 Children | 0 (0.0%) | 64 (100.0%) |
| 3 or 4 Children | 0 (0.0%) | 0 (0.0%) |
| 5 or more Children | 0 (0.0%) | 0 (0.0%) |
| Total | 41 (33.6%) | 81 (66.4%) |
Income Below Poverty Among Single-Parent Households in Delft Colony
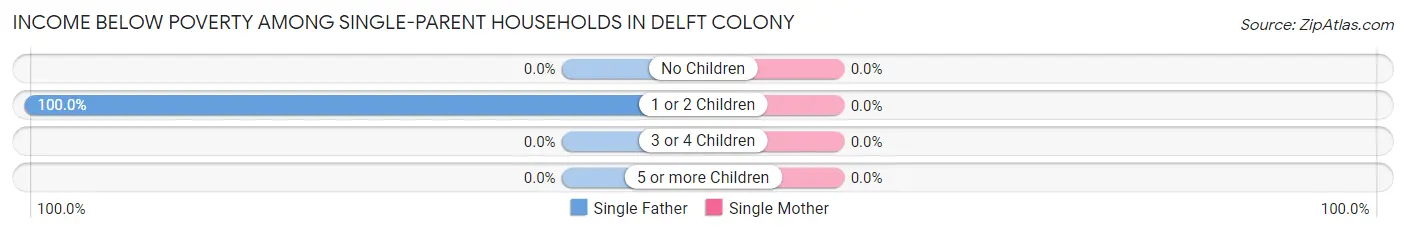
| Children | Single Father | Single Mother |
| No Children | 0 (0.0%) | 0 (0.0%) |
| 1 or 2 Children | 46 (100.0%) | 0 (0.0%) |
| 3 or 4 Children | 0 (0.0%) | 0 (0.0%) |
| 5 or more Children | 0 (0.0%) | 0 (0.0%) |
| Total | 46 (100.0%) | 0 (0.0%) |
Income Below Poverty Among Married-Couple vs Single-Parent Households in Delft Colony
The poverty data for Delft Colony shows that 81 of the married-couple family households (66.4%) and 46 of the single-parent households (100.0%) are living below the poverty level. Within the married-couple family households, those with 1 or 2 children have the highest poverty rate, with 64 households (100.0%) falling below the poverty line. Among the single-parent households, those with 1 or 2 children have the highest poverty rate, with 46 household (100.0%) living below poverty.
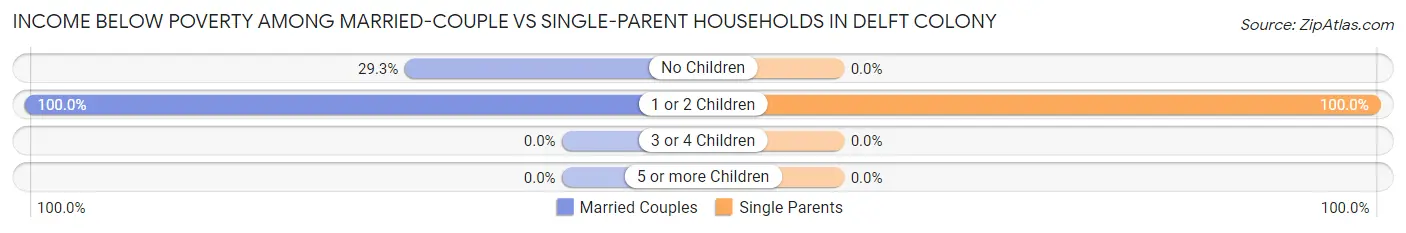
| Children | Married-Couple Families | Single-Parent Households |
| No Children | 17 (29.3%) | 0 (0.0%) |
| 1 or 2 Children | 64 (100.0%) | 46 (100.0%) |
| 3 or 4 Children | 0 (0.0%) | 0 (0.0%) |
| 5 or more Children | 0 (0.0%) | 0 (0.0%) |
| Total | 81 (66.4%) | 46 (100.0%) |
Race in Delft Colony
The most populous races in Delft Colony are Hispanic or Latino (932 | 89.8%), White / Caucasian (696 | 67.0%), and Some other Race (295 | 28.4%).
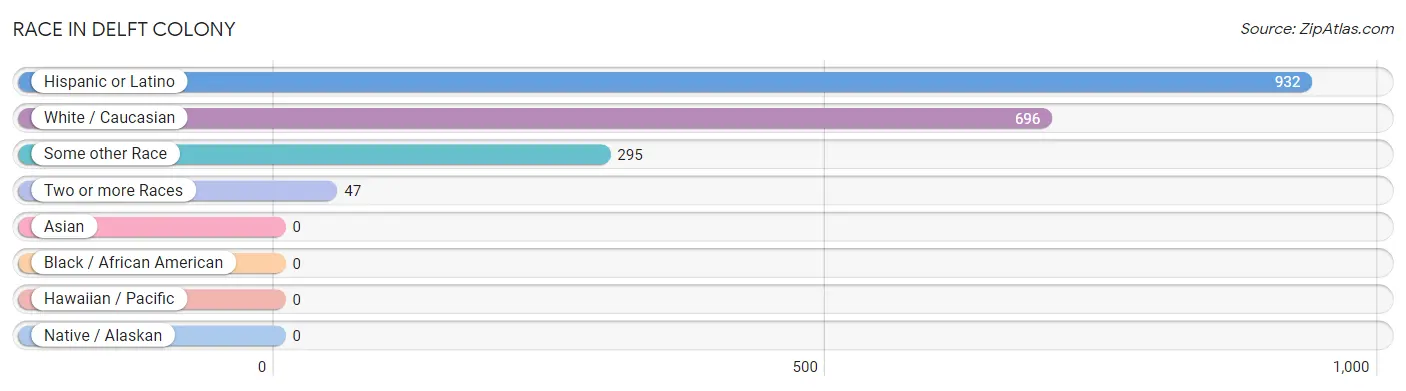
| Race | # Population | % Population |
| Asian | 0 | 0.0% |
| Black / African American | 0 | 0.0% |
| Hawaiian / Pacific | 0 | 0.0% |
| Hispanic or Latino | 932 | 89.8% |
| Native / Alaskan | 0 | 0.0% |
| White / Caucasian | 696 | 67.0% |
| Two or more Races | 47 | 4.5% |
| Some other Race | 295 | 28.4% |
| Total | 1,038 | 100.0% |
Ancestry in Delft Colony
The most populous ancestries reported in Delft Colony are Mexican (932 | 89.8%), Portuguese (53 | 5.1%), and Irish (30 | 2.9%), together accounting for 97.8% of all Delft Colony residents.
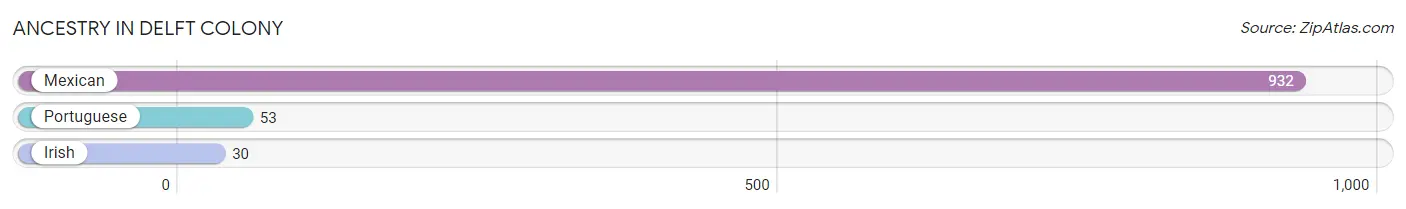
| Ancestry | # Population | % Population |
| Irish | 30 | 2.9% |
| Mexican | 932 | 89.8% |
| Portuguese | 53 | 5.1% | View All 3 Rows |
Immigrants in Delft Colony
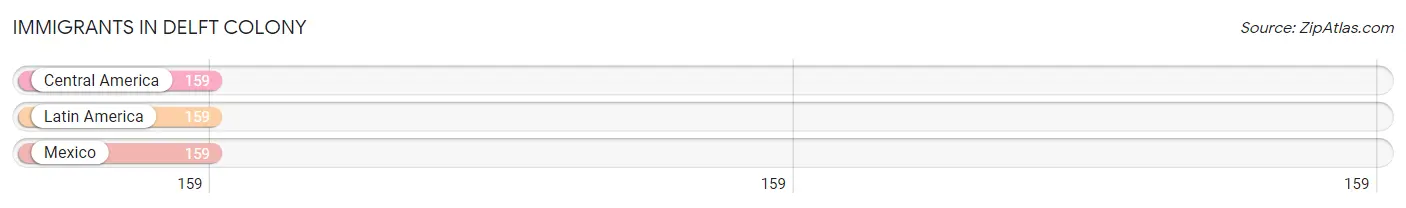
The most numerous immigrant groups reported in Delft Colony came from Central America (159 | 15.3%), Latin America (159 | 15.3%), and Mexico (159 | 15.3%), together accounting for 46.0% of all Delft Colony residents.
| Immigration Origin | # Population | % Population |
| Central America | 159 | 15.3% |
| Latin America | 159 | 15.3% |
| Mexico | 159 | 15.3% | View All 3 Rows |
Sex and Age in Delft Colony
Sex and Age in Delft Colony
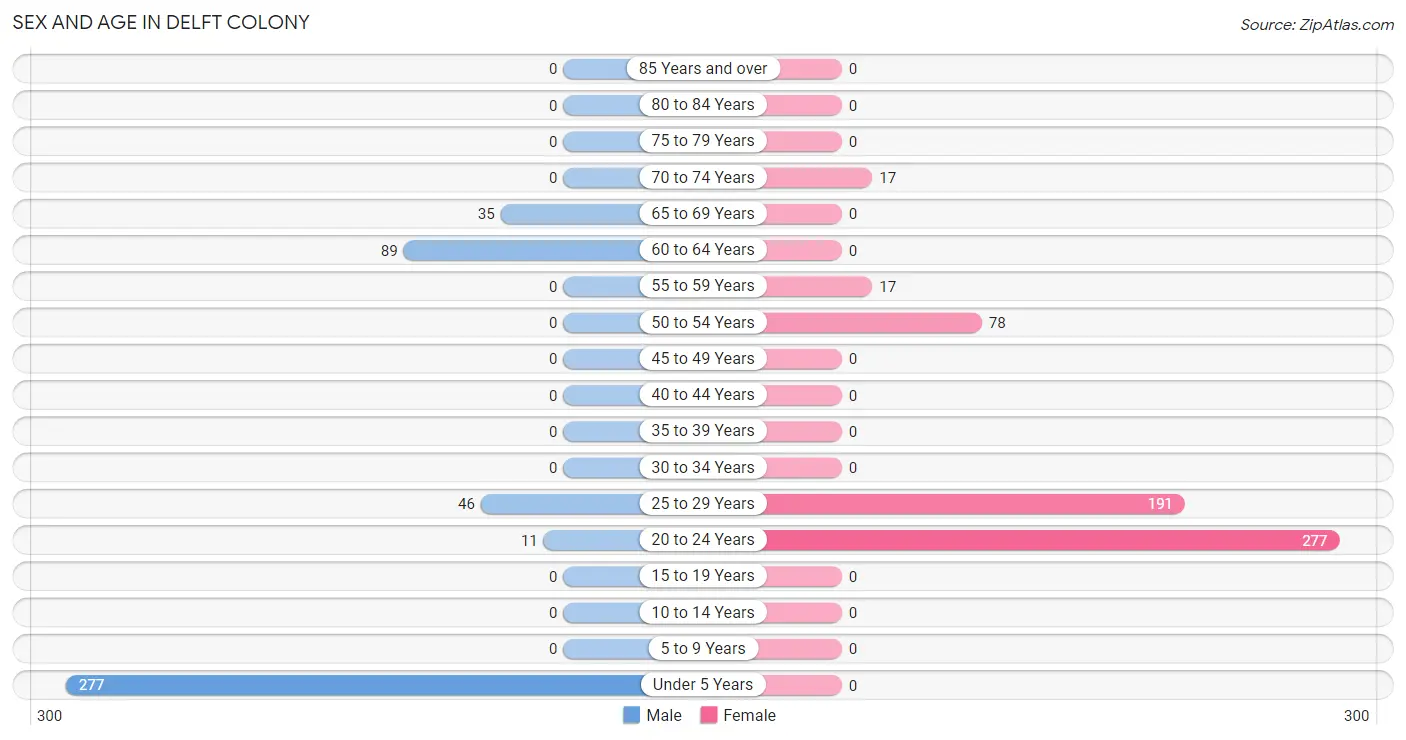
The most populous age groups in Delft Colony are Under 5 Years (277 | 60.5%) for men and 20 to 24 Years (277 | 47.8%) for women.
| Age Bracket | Male | Female |
| Under 5 Years | 277 (60.5%) | 0 (0.0%) |
| 5 to 9 Years | 0 (0.0%) | 0 (0.0%) |
| 10 to 14 Years | 0 (0.0%) | 0 (0.0%) |
| 15 to 19 Years | 0 (0.0%) | 0 (0.0%) |
| 20 to 24 Years | 11 (2.4%) | 277 (47.8%) |
| 25 to 29 Years | 46 (10.0%) | 191 (32.9%) |
| 30 to 34 Years | 0 (0.0%) | 0 (0.0%) |
| 35 to 39 Years | 0 (0.0%) | 0 (0.0%) |
| 40 to 44 Years | 0 (0.0%) | 0 (0.0%) |
| 45 to 49 Years | 0 (0.0%) | 0 (0.0%) |
| 50 to 54 Years | 0 (0.0%) | 78 (13.5%) |
| 55 to 59 Years | 0 (0.0%) | 17 (2.9%) |
| 60 to 64 Years | 89 (19.4%) | 0 (0.0%) |
| 65 to 69 Years | 35 (7.6%) | 0 (0.0%) |
| 70 to 74 Years | 0 (0.0%) | 17 (2.9%) |
| 75 to 79 Years | 0 (0.0%) | 0 (0.0%) |
| 80 to 84 Years | 0 (0.0%) | 0 (0.0%) |
| 85 Years and over | 0 (0.0%) | 0 (0.0%) |
| Total | 458 (100.0%) | 580 (100.0%) |
Families and Households in Delft Colony
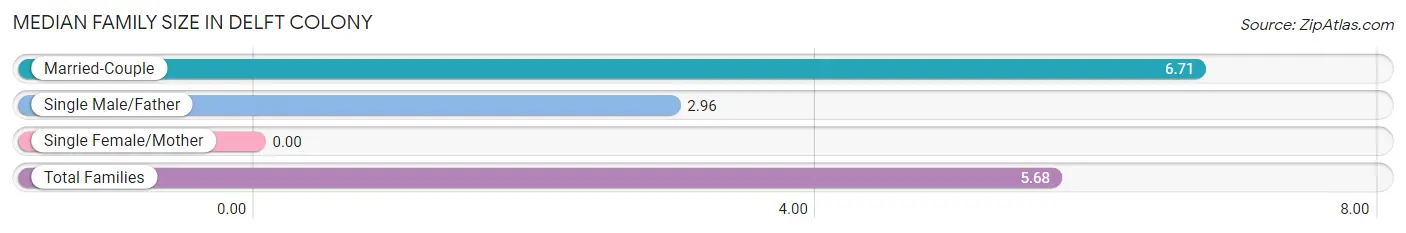
Median Family Size in Delft Colony
| Family Type | # Families | Family Size |
| Married-Couple | 122 (72.6%) | 6.71 |
| Single Male/Father | 46 (27.4%) | 2.96 |
| Single Female/Mother | 0 (0.0%) | - |
| Total Families | 168 (100.0%) | 5.68 |
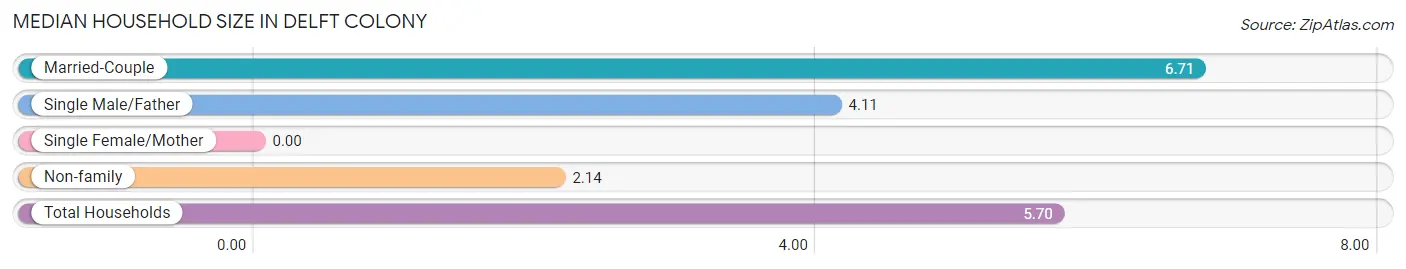
Median Household Size in Delft Colony
| Household Type | # Households | Household Size |
| Married-Couple | 122 (67.0%) | 6.71 |
| Single Male/Father | 46 (25.3%) | 4.11 |
| Single Female/Mother | 0 (0.0%) | - |
| Non-family | 14 (7.7%) | 2.14 |
| Total Households | 182 (100.0%) | 5.70 |
Household Size by Marriage Status in Delft Colony
Out of a total of 182 households in Delft Colony, 168 (92.3%) are family households, while 14 (7.7%) are nonfamily households. The most numerous type of family households are 5-person households, comprising 64, and the most common type of nonfamily households are 2-person households, comprising 14.
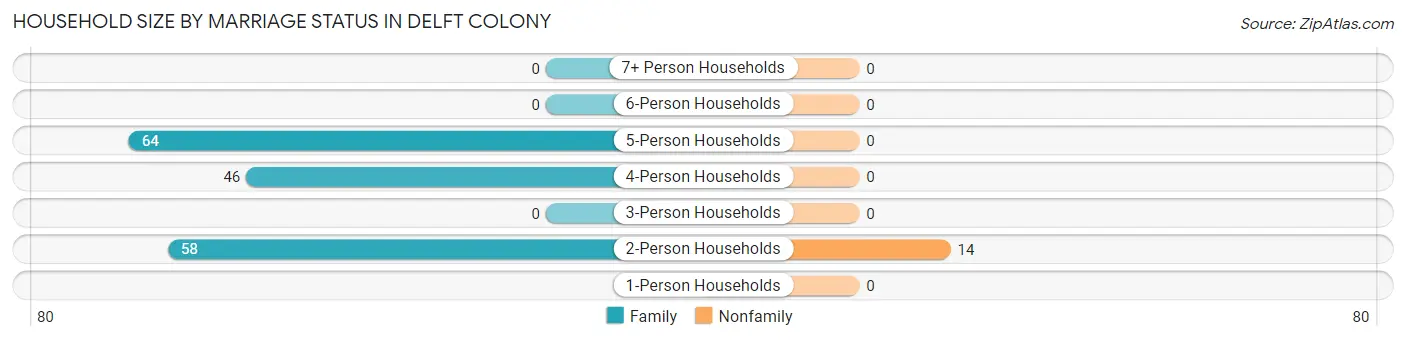
| Household Size | Family Households | Nonfamily Households |
| 1-Person Households | - | 0 (0.0%) |
| 2-Person Households | 58 (31.9%) | 14 (7.7%) |
| 3-Person Households | 0 (0.0%) | 0 (0.0%) |
| 4-Person Households | 46 (25.3%) | 0 (0.0%) |
| 5-Person Households | 64 (35.2%) | 0 (0.0%) |
| 6-Person Households | 0 (0.0%) | 0 (0.0%) |
| 7+ Person Households | 0 (0.0%) | 0 (0.0%) |
| Total | 168 (92.3%) | 14 (7.7%) |
Female Fertility in Delft Colony
Fertility by Age in Delft Colony
| Age Bracket | Women with Births | Births / 1,000 Women |
| 15 to 19 years | 0 (0.0%) | 0.0 |
| 20 to 34 years | 0 (0.0%) | 0.0 |
| 35 to 50 years | 0 (0.0%) | 0.0 |
| Total | 0 (0.0%) | 0.0 |
Fertility by Age by Marriage Status in Delft Colony
| Age Bracket | Married | Unmarried |
| 15 to 19 years | 0 (0.0%) | 0 (0.0%) |
| 20 to 34 years | 0 (0.0%) | 0 (0.0%) |
| 35 to 50 years | 0 (0.0%) | 0 (0.0%) |
| Total | 0 (0.0%) | 0 (0.0%) |
Fertility by Education in Delft Colony
| Educational Attainment | Women with Births | Births / 1,000 Women |
| Less than High School | 0 (0.0%) | 0.0 |
| High School Diploma | 0 (0.0%) | 0.0 |
| College or Associate's Degree | 0 (0.0%) | 0.0 |
| Bachelor's Degree | 0 (0.0%) | 0.0 |
| Graduate Degree | 0 (0.0%) | 0.0 |
| Total | 0 (0.0%) | 0.0 |
Fertility by Education by Marriage Status in Delft Colony
| Educational Attainment | Married | Unmarried |
| Less than High School | 0 (0.0%) | 0 (0.0%) |
| High School Diploma | 0 (0.0%) | 0 (0.0%) |
| College or Associate's Degree | 0 (0.0%) | 0 (0.0%) |
| Bachelor's Degree | 0 (0.0%) | 0 (0.0%) |
| Graduate Degree | 0 (0.0%) | 0 (0.0%) |
| Total | 0 (0.0%) | 0 (0.0%) |
Employment Characteristics in Delft Colony
Employment by Class of Employer in Delft Colony
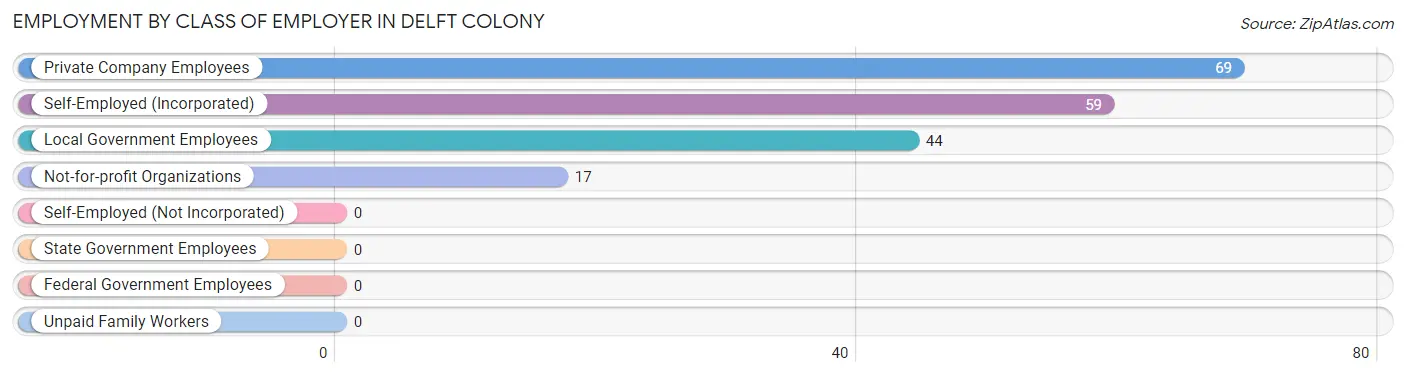
Among the 189 employed individuals in Delft Colony, private company employees (69 | 36.5%), self-employed (incorporated) (59 | 31.2%), and local government employees (44 | 23.3%) make up the most common classes of employment.
| Employer Class | # Employees | % Employees |
| Private Company Employees | 69 | 36.5% |
| Self-Employed (Incorporated) | 59 | 31.2% |
| Self-Employed (Not Incorporated) | 0 | 0.0% |
| Not-for-profit Organizations | 17 | 9.0% |
| Local Government Employees | 44 | 23.3% |
| State Government Employees | 0 | 0.0% |
| Federal Government Employees | 0 | 0.0% |
| Unpaid Family Workers | 0 | 0.0% |
| Total | 189 | 100.0% |
Employment Status by Age in Delft Colony
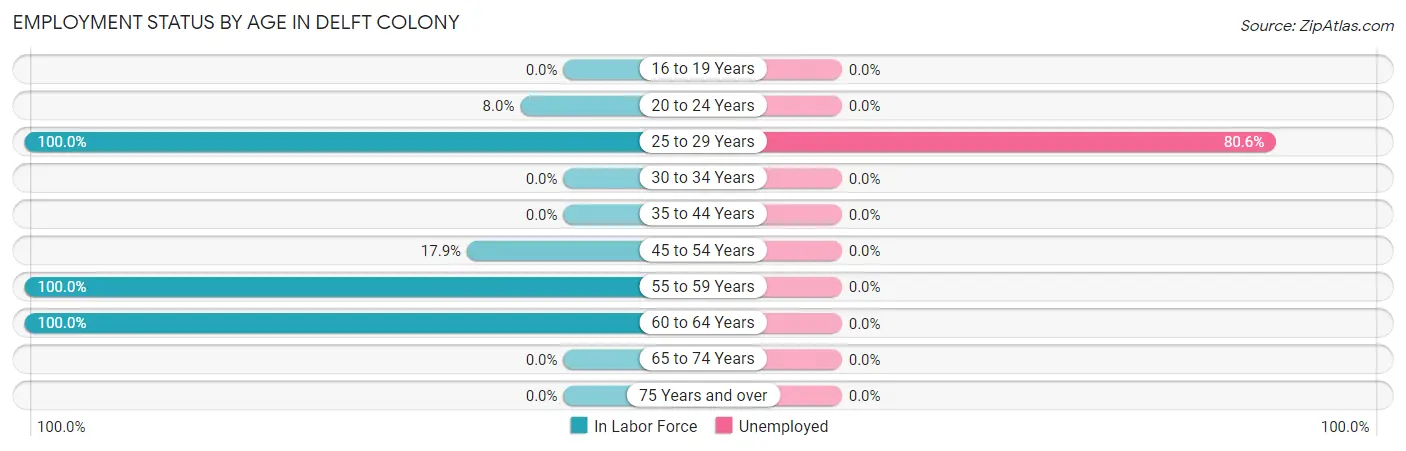
According to the labor force statistics for Delft Colony, out of the total population over 16 years of age (761), 49.9% or 380 individuals are in the labor force, with 50.3% or 191 of them unemployed. The age group with the highest labor force participation rate is 25 to 29 years, with 100.0% or 237 individuals in the labor force. Within the labor force, the 25 to 29 years age range has the highest percentage of unemployed individuals, with 80.6% or 191 of them being unemployed.
| Age Bracket | In Labor Force | Unemployed |
| 16 to 19 Years | 0 (0.0%) | 0 (0.0%) |
| 20 to 24 Years | 23 (8.0%) | 0 (0.0%) |
| 25 to 29 Years | 237 (100.0%) | 191 (80.6%) |
| 30 to 34 Years | 0 (0.0%) | 0 (0.0%) |
| 35 to 44 Years | 0 (0.0%) | 0 (0.0%) |
| 45 to 54 Years | 14 (17.9%) | 0 (0.0%) |
| 55 to 59 Years | 17 (100.0%) | 0 (0.0%) |
| 60 to 64 Years | 89 (100.0%) | 0 (0.0%) |
| 65 to 74 Years | 0 (0.0%) | 0 (0.0%) |
| 75 Years and over | 0 (0.0%) | 0 (0.0%) |
| Total | 380 (49.9%) | 191 (50.3%) |
Employment Status by Educational Attainment in Delft Colony
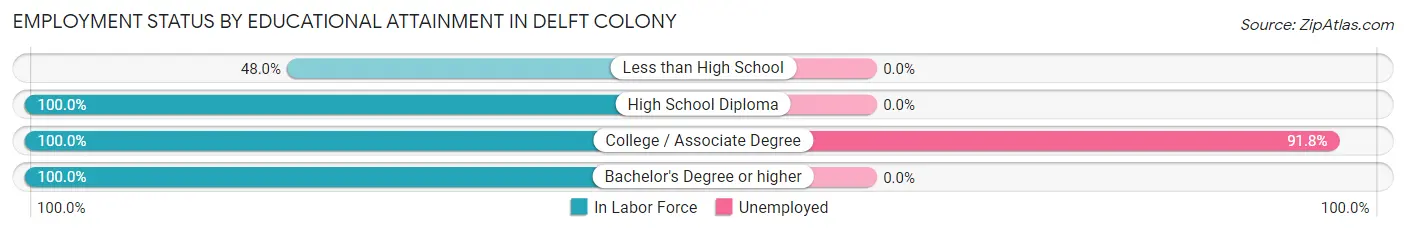
According to labor force statistics for Delft Colony, 84.8% of individuals (357) out of the total population between 25 and 64 years of age (421) are in the labor force, with 53.5% or 191 of them being unemployed. The group with the highest labor force participation rate are those with the educational attainment of high school diploma, with 100.0% or 60 individuals in the labor force. Within the labor force, individuals with college / associate degree education have the highest percentage of unemployment, with 91.8% or 191 of them being unemployed.
| Educational Attainment | In Labor Force | Unemployed |
| Less than High School | 59 (48.0%) | 0 (0.0%) |
| High School Diploma | 60 (100.0%) | 0 (0.0%) |
| College / Associate Degree | 208 (100.0%) | 191 (91.8%) |
| Bachelor's Degree or higher | 30 (100.0%) | 0 (0.0%) |
| Total | 357 (84.8%) | 225 (53.5%) |
Employment Occupations by Sex in Delft Colony
Management, Business, Science and Arts Occupations
The most common Management, Business, Science and Arts occupations in Delft Colony are Management (37 | 19.6%), Community & Social Service (30 | 15.9%), and Education Instruction & Library (30 | 15.9%).
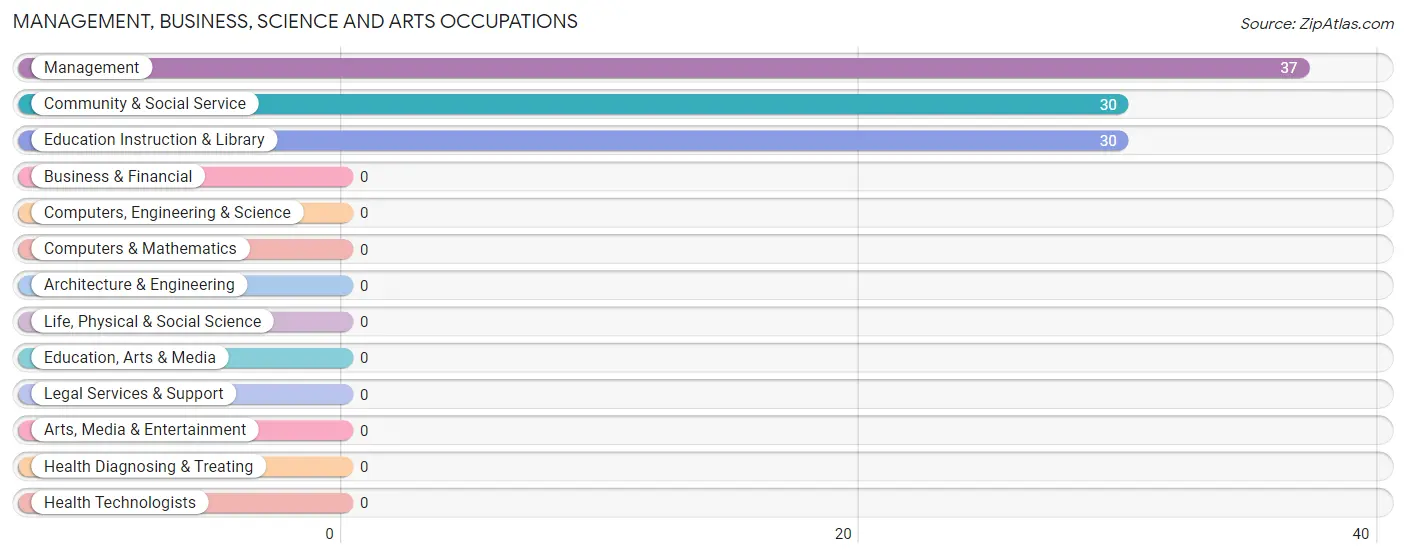
Management, Business, Science and Arts Occupations by Sex
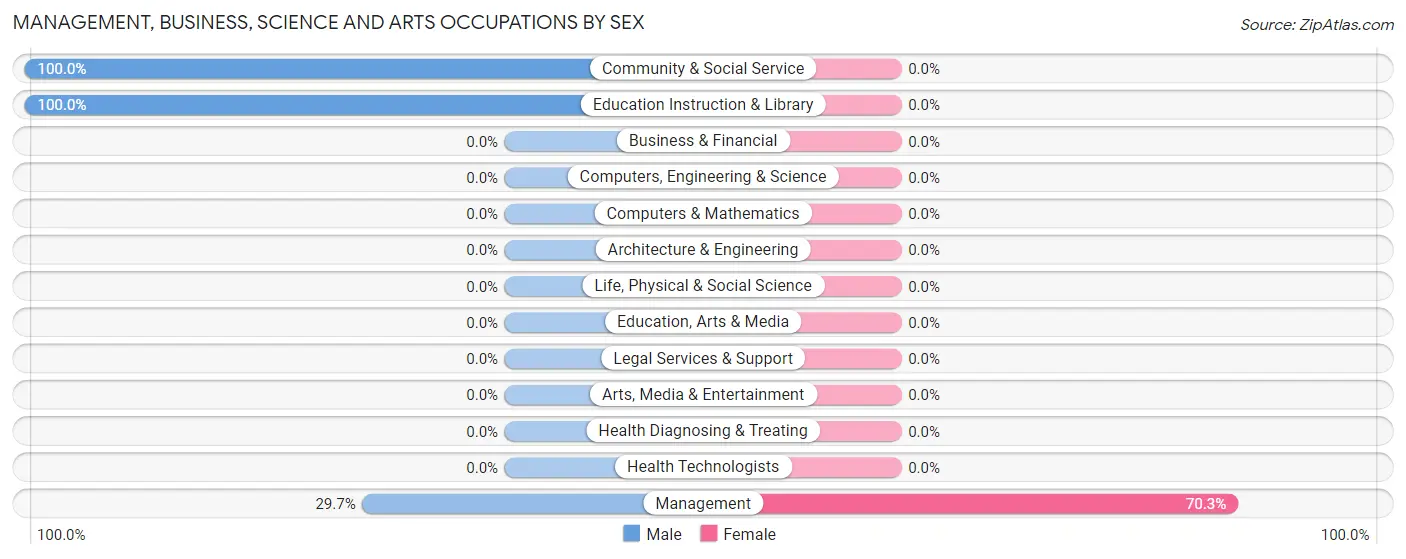
| Occupation | Male | Female |
| Management | 11 (29.7%) | 26 (70.3%) |
| Business & Financial | 0 (0.0%) | 0 (0.0%) |
| Computers, Engineering & Science | 0 (0.0%) | 0 (0.0%) |
| Computers & Mathematics | 0 (0.0%) | 0 (0.0%) |
| Architecture & Engineering | 0 (0.0%) | 0 (0.0%) |
| Life, Physical & Social Science | 0 (0.0%) | 0 (0.0%) |
| Community & Social Service | 30 (100.0%) | 0 (0.0%) |
| Education, Arts & Media | 0 (0.0%) | 0 (0.0%) |
| Legal Services & Support | 0 (0.0%) | 0 (0.0%) |
| Education Instruction & Library | 30 (100.0%) | 0 (0.0%) |
| Arts, Media & Entertainment | 0 (0.0%) | 0 (0.0%) |
| Health Diagnosing & Treating | 0 (0.0%) | 0 (0.0%) |
| Health Technologists | 0 (0.0%) | 0 (0.0%) |
| Total (Category) | 41 (61.2%) | 26 (38.8%) |
| Total (Overall) | 146 (77.2%) | 43 (22.8%) |
Services Occupations
Services Occupations by Sex
| Occupation | Male | Female |
| Healthcare Support | 0 (0.0%) | 0 (0.0%) |
| Security & Protection | 0 (0.0%) | 0 (0.0%) |
| Firefighting & Prevention | 0 (0.0%) | 0 (0.0%) |
| Law Enforcement | 0 (0.0%) | 0 (0.0%) |
| Food Preparation & Serving | 0 (0.0%) | 0 (0.0%) |
| Cleaning & Maintenance | 0 (0.0%) | 0 (0.0%) |
| Personal Care & Service | 0 (0.0%) | 0 (0.0%) |
| Total (Category) | 0 (0.0%) | 0 (0.0%) |
| Total (Overall) | 146 (77.2%) | 43 (22.8%) |
Sales and Office Occupations
The most common Sales and Office occupations in Delft Colony are , and Office & Administration (17 | 9.0%).

Sales and Office Occupations by Sex

| Occupation | Male | Female |
| Sales & Related | 0 (0.0%) | 0 (0.0%) |
| Office & Administration | 0 (0.0%) | 17 (100.0%) |
| Total (Category) | 0 (0.0%) | 17 (100.0%) |
| Total (Overall) | 146 (77.2%) | 43 (22.8%) |
Natural Resources, Construction and Maintenance Occupations
The most common Natural Resources, Construction and Maintenance occupations in Delft Colony are , and Farming, Fishing & Forestry (59 | 31.2%).
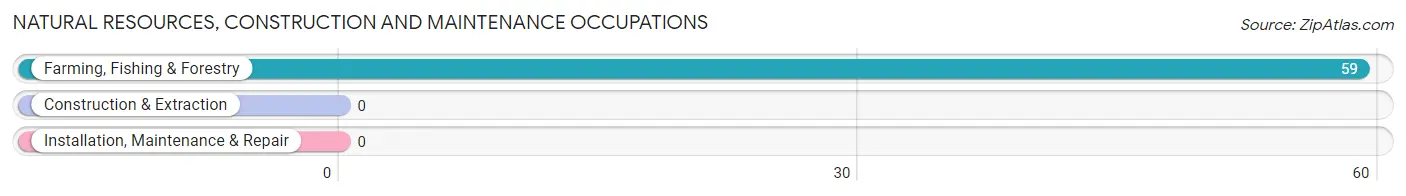
Natural Resources, Construction and Maintenance Occupations by Sex

| Occupation | Male | Female |
| Farming, Fishing & Forestry | 59 (100.0%) | 0 (0.0%) |
| Construction & Extraction | 0 (0.0%) | 0 (0.0%) |
| Installation, Maintenance & Repair | 0 (0.0%) | 0 (0.0%) |
| Total (Category) | 59 (100.0%) | 0 (0.0%) |
| Total (Overall) | 146 (77.2%) | 43 (22.8%) |
Production, Transportation and Moving Occupations
The most common Production, Transportation and Moving occupations in Delft Colony are , and Material Moving (46 | 24.3%).
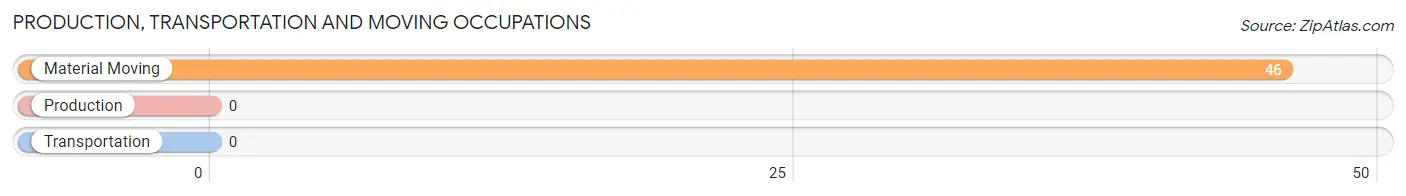
Production, Transportation and Moving Occupations by Sex
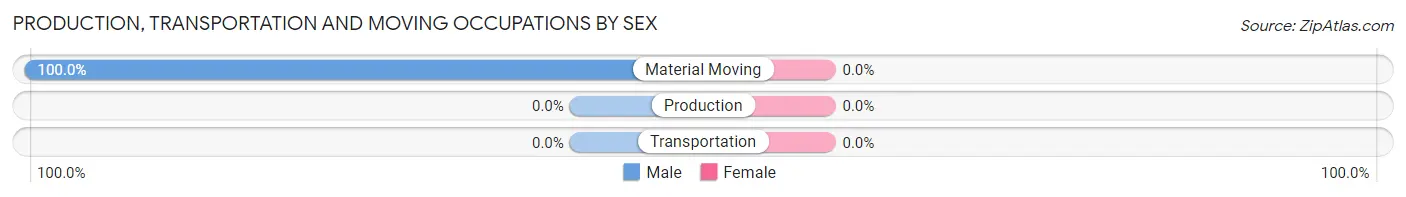
| Occupation | Male | Female |
| Production | 0 (0.0%) | 0 (0.0%) |
| Transportation | 0 (0.0%) | 0 (0.0%) |
| Material Moving | 46 (100.0%) | 0 (0.0%) |
| Total (Category) | 46 (100.0%) | 0 (0.0%) |
| Total (Overall) | 146 (77.2%) | 43 (22.8%) |
Employment Industries by Sex in Delft Colony
Employment Industries in Delft Colony
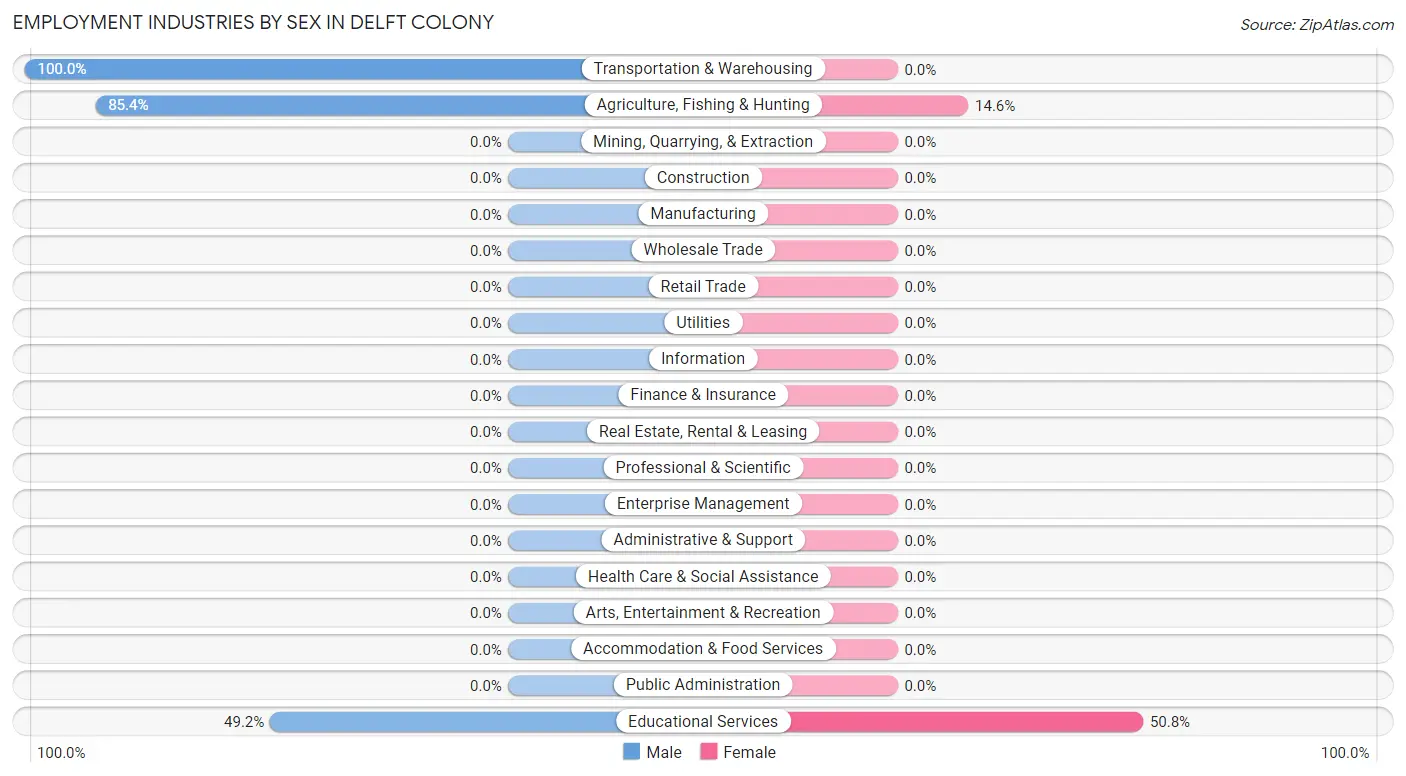
The major employment industries in Delft Colony include Agriculture, Fishing & Hunting (82 | 43.4%), Educational Services (61 | 32.3%), and Transportation & Warehousing (46 | 24.3%).
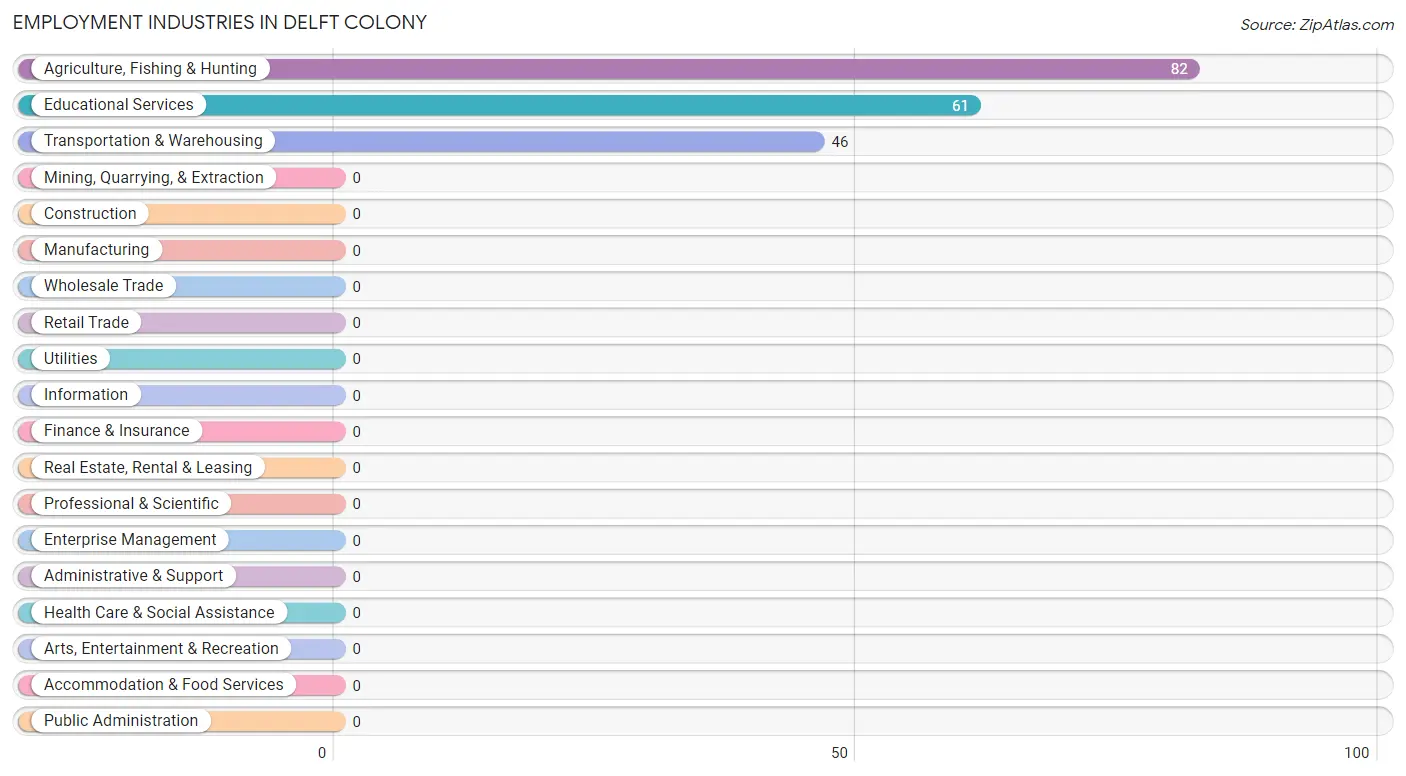
Employment Industries by Sex in Delft Colony
The Delft Colony industries that see more men than women are Transportation & Warehousing (100.0%), Agriculture, Fishing & Hunting (85.4%), and Educational Services (49.2%), whereas the industries that tend to have a higher number of women are Educational Services (50.8%), and Agriculture, Fishing & Hunting (14.6%).
| Industry | Male | Female |
| Agriculture, Fishing & Hunting | 70 (85.4%) | 12 (14.6%) |
| Mining, Quarrying, & Extraction | 0 (0.0%) | 0 (0.0%) |
| Construction | 0 (0.0%) | 0 (0.0%) |
| Manufacturing | 0 (0.0%) | 0 (0.0%) |
| Wholesale Trade | 0 (0.0%) | 0 (0.0%) |
| Retail Trade | 0 (0.0%) | 0 (0.0%) |
| Transportation & Warehousing | 46 (100.0%) | 0 (0.0%) |
| Utilities | 0 (0.0%) | 0 (0.0%) |
| Information | 0 (0.0%) | 0 (0.0%) |
| Finance & Insurance | 0 (0.0%) | 0 (0.0%) |
| Real Estate, Rental & Leasing | 0 (0.0%) | 0 (0.0%) |
| Professional & Scientific | 0 (0.0%) | 0 (0.0%) |
| Enterprise Management | 0 (0.0%) | 0 (0.0%) |
| Administrative & Support | 0 (0.0%) | 0 (0.0%) |
| Educational Services | 30 (49.2%) | 31 (50.8%) |
| Health Care & Social Assistance | 0 (0.0%) | 0 (0.0%) |
| Arts, Entertainment & Recreation | 0 (0.0%) | 0 (0.0%) |
| Accommodation & Food Services | 0 (0.0%) | 0 (0.0%) |
| Public Administration | 0 (0.0%) | 0 (0.0%) |
| Total | 146 (77.2%) | 43 (22.8%) |
Education in Delft Colony
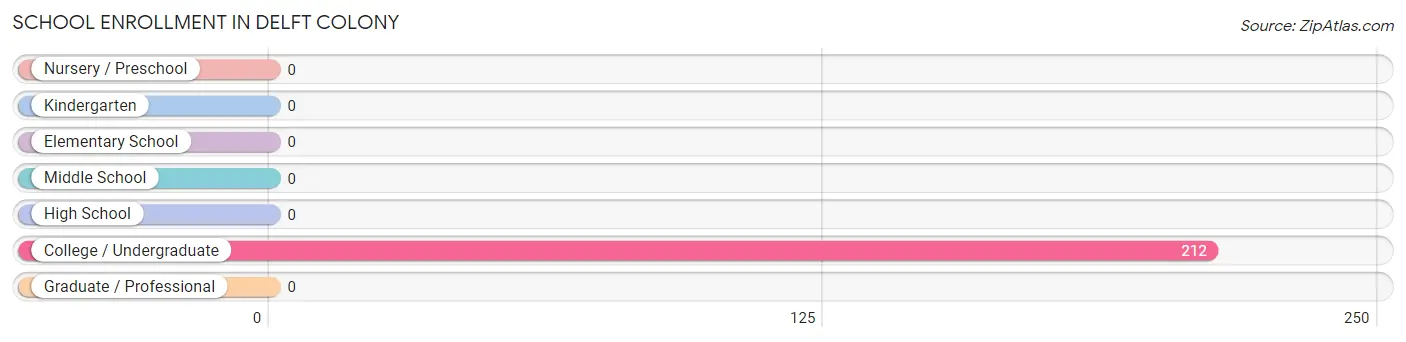
School Enrollment in Delft Colony
| School Level | # Students | % Students |
| Nursery / Preschool | 0 | 0.0% |
| Kindergarten | 0 | 0.0% |
| Elementary School | 0 | 0.0% |
| Middle School | 0 | 0.0% |
| High School | 0 | 0.0% |
| College / Undergraduate | 212 | 100.0% |
| Graduate / Professional | 0 | 0.0% |
| Total | 212 | 100.0% |
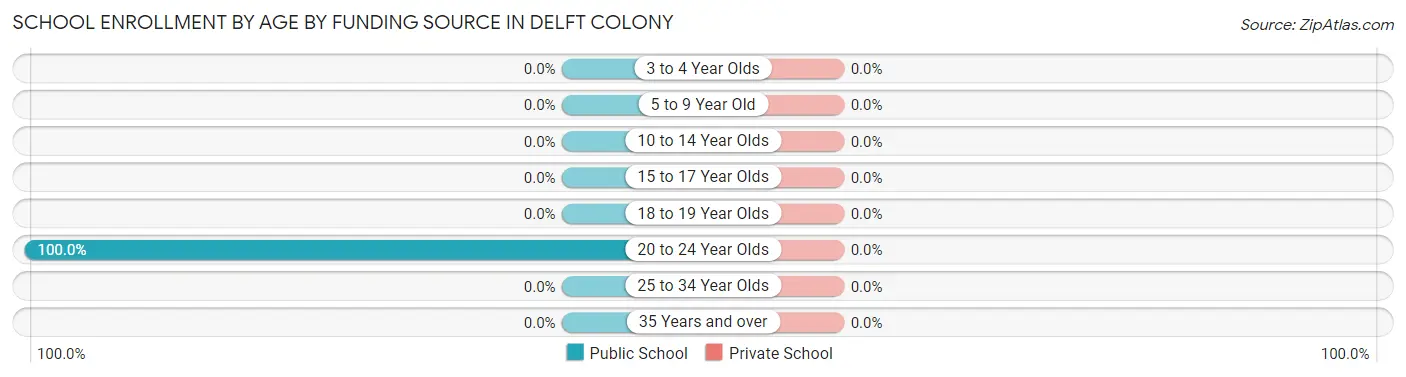
School Enrollment by Age by Funding Source in Delft Colony
| Age Bracket | Public School | Private School |
| 3 to 4 Year Olds | 0 (0.0%) | 0 (0.0%) |
| 5 to 9 Year Old | 0 (0.0%) | 0 (0.0%) |
| 10 to 14 Year Olds | 0 (0.0%) | 0 (0.0%) |
| 15 to 17 Year Olds | 0 (0.0%) | 0 (0.0%) |
| 18 to 19 Year Olds | 0 (0.0%) | 0 (0.0%) |
| 20 to 24 Year Olds | 212 (100.0%) | 0 (0.0%) |
| 25 to 34 Year Olds | 0 (0.0%) | 0 (0.0%) |
| 35 Years and over | 0 (0.0%) | 0 (0.0%) |
| Total | 212 (100.0%) | 0 (0.0%) |
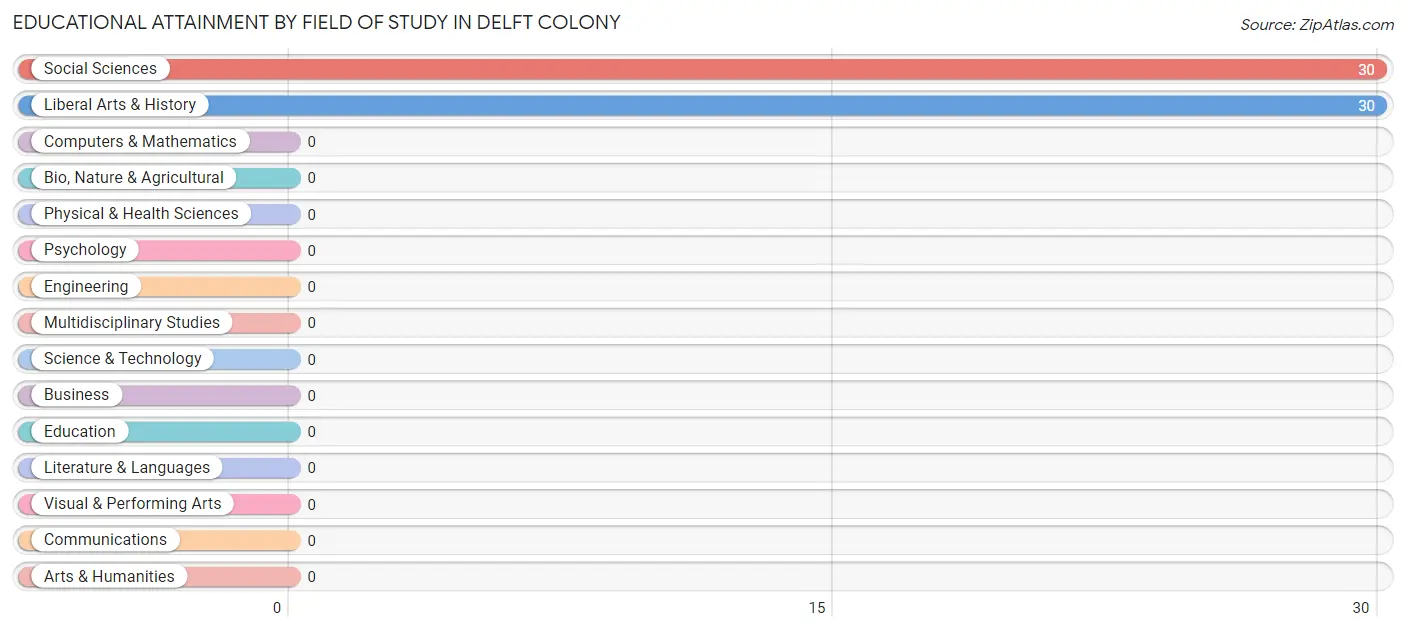
Educational Attainment by Field of Study in Delft Colony
Social sciences (30 | 50.0%), and liberal arts & history (30 | 50.0%) are the most common fields of study among 60 individuals in Delft Colony who have obtained a bachelor's degree or higher.
| Field of Study | # Graduates | % Graduates |
| Computers & Mathematics | 0 | 0.0% |
| Bio, Nature & Agricultural | 0 | 0.0% |
| Physical & Health Sciences | 0 | 0.0% |
| Psychology | 0 | 0.0% |
| Social Sciences | 30 | 50.0% |
| Engineering | 0 | 0.0% |
| Multidisciplinary Studies | 0 | 0.0% |
| Science & Technology | 0 | 0.0% |
| Business | 0 | 0.0% |
| Education | 0 | 0.0% |
| Literature & Languages | 0 | 0.0% |
| Liberal Arts & History | 30 | 50.0% |
| Visual & Performing Arts | 0 | 0.0% |
| Communications | 0 | 0.0% |
| Arts & Humanities | 0 | 0.0% |
| Total | 60 | 100.0% |
Transportation & Commute in Delft Colony
Vehicle Availability by Sex in Delft Colony
The most prevalent vehicle ownership categories in Delft Colony are males with 3 vehicles (59, accounting for 40.4%) and females with 3 vehicles (0, making up 137.2%).
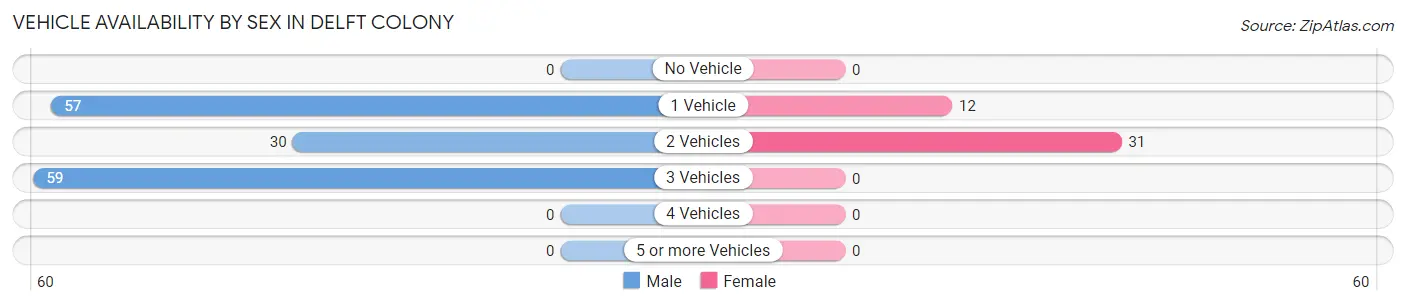
| Vehicles Available | Male | Female |
| No Vehicle | 0 (0.0%) | 0 (0.0%) |
| 1 Vehicle | 57 (39.0%) | 12 (27.9%) |
| 2 Vehicles | 30 (20.5%) | 31 (72.1%) |
| 3 Vehicles | 59 (40.4%) | 0 (0.0%) |
| 4 Vehicles | 0 (0.0%) | 0 (0.0%) |
| 5 or more Vehicles | 0 (0.0%) | 0 (0.0%) |
| Total | 146 (100.0%) | 43 (100.0%) |
Commute Time in Delft Colony
The most frequently occuring commute durations in Delft Colony are 15 to 19 minutes (117 commuters, 61.9%), 30 to 34 minutes (30 commuters, 15.9%), and 20 to 24 minutes (25 commuters, 13.2%).
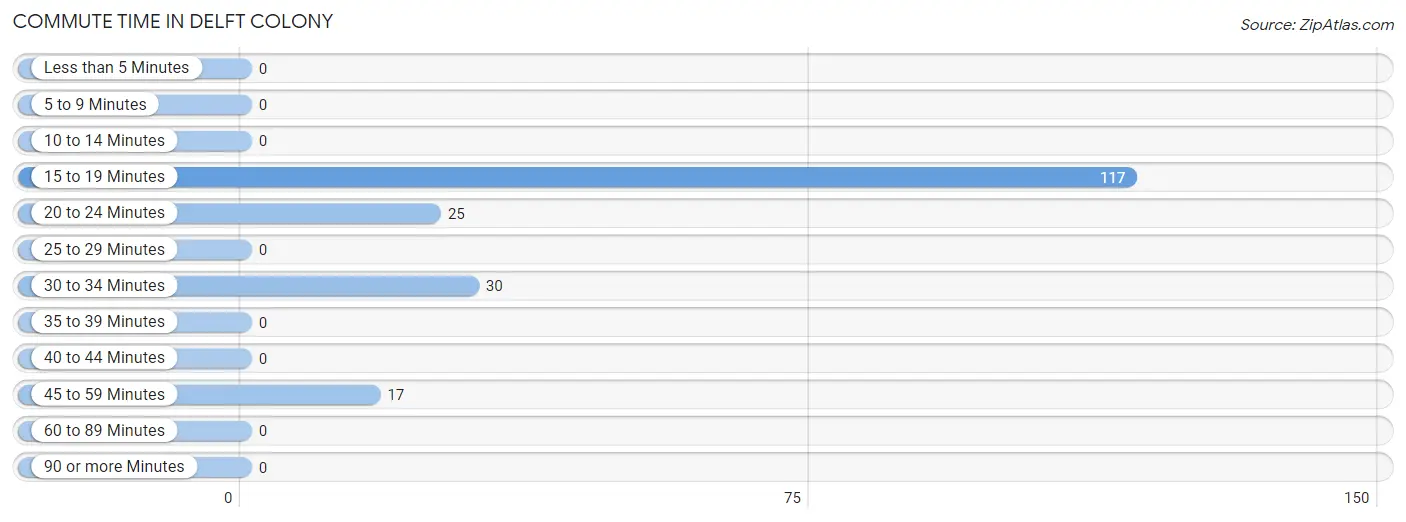
| Commute Time | # Commuters | % Commuters |
| Less than 5 Minutes | 0 | 0.0% |
| 5 to 9 Minutes | 0 | 0.0% |
| 10 to 14 Minutes | 0 | 0.0% |
| 15 to 19 Minutes | 117 | 61.9% |
| 20 to 24 Minutes | 25 | 13.2% |
| 25 to 29 Minutes | 0 | 0.0% |
| 30 to 34 Minutes | 30 | 15.9% |
| 35 to 39 Minutes | 0 | 0.0% |
| 40 to 44 Minutes | 0 | 0.0% |
| 45 to 59 Minutes | 17 | 9.0% |
| 60 to 89 Minutes | 0 | 0.0% |
| 90 or more Minutes | 0 | 0.0% |
Commute Time by Sex in Delft Colony
The most common commute times in Delft Colony are 15 to 19 minutes (105 commuters, 71.9%) for males and 45 to 59 minutes (17 commuters, 39.5%) for females.
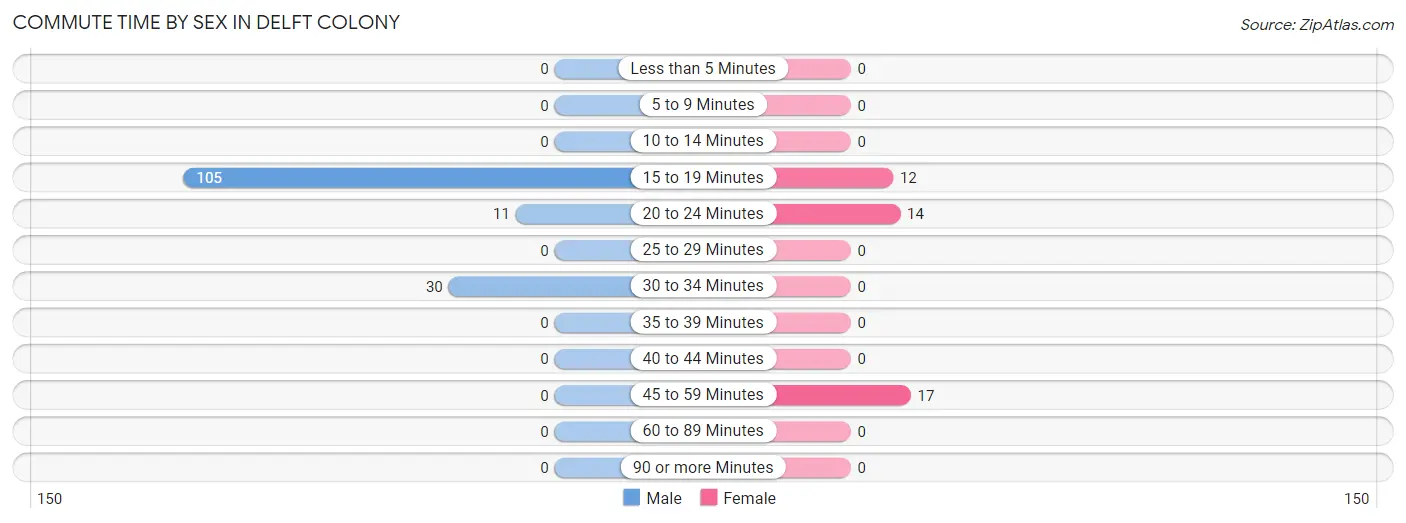
| Commute Time | Male | Female |
| Less than 5 Minutes | 0 (0.0%) | 0 (0.0%) |
| 5 to 9 Minutes | 0 (0.0%) | 0 (0.0%) |
| 10 to 14 Minutes | 0 (0.0%) | 0 (0.0%) |
| 15 to 19 Minutes | 105 (71.9%) | 12 (27.9%) |
| 20 to 24 Minutes | 11 (7.5%) | 14 (32.6%) |
| 25 to 29 Minutes | 0 (0.0%) | 0 (0.0%) |
| 30 to 34 Minutes | 30 (20.5%) | 0 (0.0%) |
| 35 to 39 Minutes | 0 (0.0%) | 0 (0.0%) |
| 40 to 44 Minutes | 0 (0.0%) | 0 (0.0%) |
| 45 to 59 Minutes | 0 (0.0%) | 17 (39.5%) |
| 60 to 89 Minutes | 0 (0.0%) | 0 (0.0%) |
| 90 or more Minutes | 0 (0.0%) | 0 (0.0%) |
Time of Departure to Work by Sex in Delft Colony
The most frequent times of departure to work in Delft Colony are 6:00 AM to 6:29 AM (105, 71.9%) for males and 11:00 AM to 11:59 AM (17, 39.5%) for females.
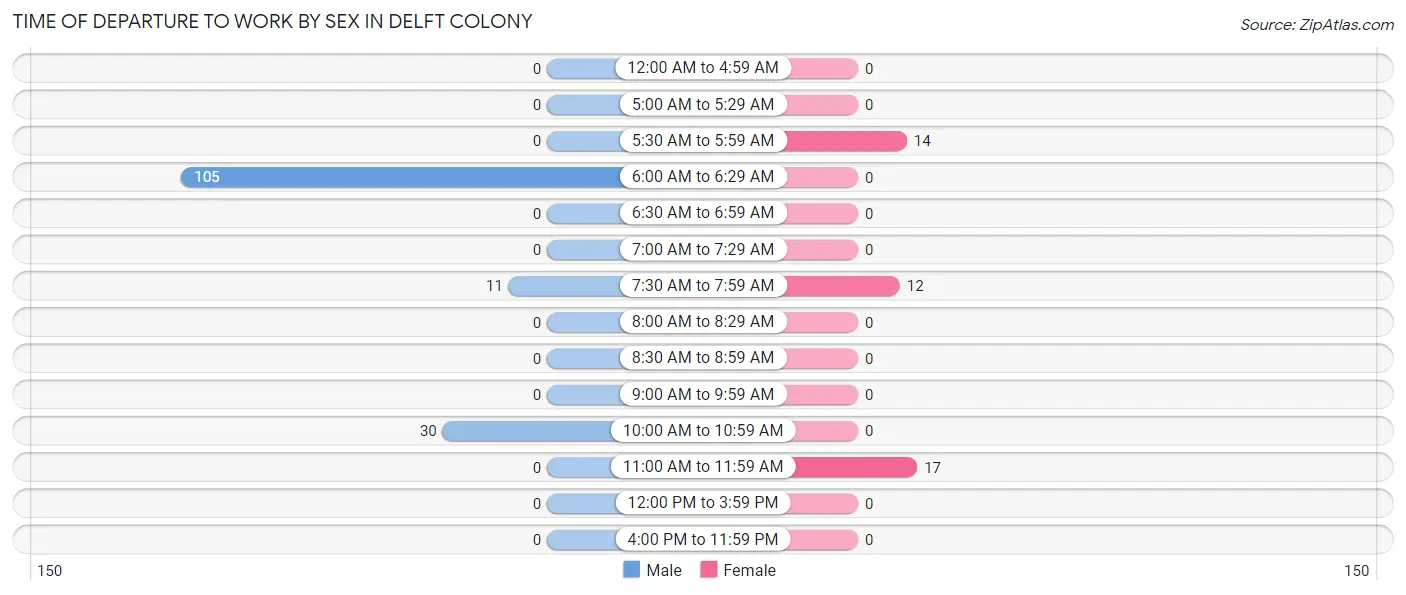
| Time of Departure | Male | Female |
| 12:00 AM to 4:59 AM | 0 (0.0%) | 0 (0.0%) |
| 5:00 AM to 5:29 AM | 0 (0.0%) | 0 (0.0%) |
| 5:30 AM to 5:59 AM | 0 (0.0%) | 14 (32.6%) |
| 6:00 AM to 6:29 AM | 105 (71.9%) | 0 (0.0%) |
| 6:30 AM to 6:59 AM | 0 (0.0%) | 0 (0.0%) |
| 7:00 AM to 7:29 AM | 0 (0.0%) | 0 (0.0%) |
| 7:30 AM to 7:59 AM | 11 (7.5%) | 12 (27.9%) |
| 8:00 AM to 8:29 AM | 0 (0.0%) | 0 (0.0%) |
| 8:30 AM to 8:59 AM | 0 (0.0%) | 0 (0.0%) |
| 9:00 AM to 9:59 AM | 0 (0.0%) | 0 (0.0%) |
| 10:00 AM to 10:59 AM | 30 (20.5%) | 0 (0.0%) |
| 11:00 AM to 11:59 AM | 0 (0.0%) | 17 (39.5%) |
| 12:00 PM to 3:59 PM | 0 (0.0%) | 0 (0.0%) |
| 4:00 PM to 11:59 PM | 0 (0.0%) | 0 (0.0%) |
| Total | 146 (100.0%) | 43 (100.0%) |
Housing Occupancy in Delft Colony
Occupancy by Ownership in Delft Colony
Of the total 182 dwellings in Delft Colony, owner-occupied units account for 78 (42.9%), while renter-occupied units make up 104 (57.1%).
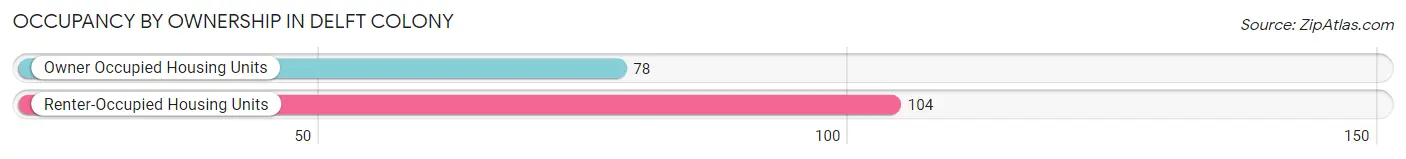
| Occupancy | # Housing Units | % Housing Units |
| Owner Occupied Housing Units | 78 | 42.9% |
| Renter-Occupied Housing Units | 104 | 57.1% |
| Total Occupied Housing Units | 182 | 100.0% |
Occupancy by Household Size in Delft Colony
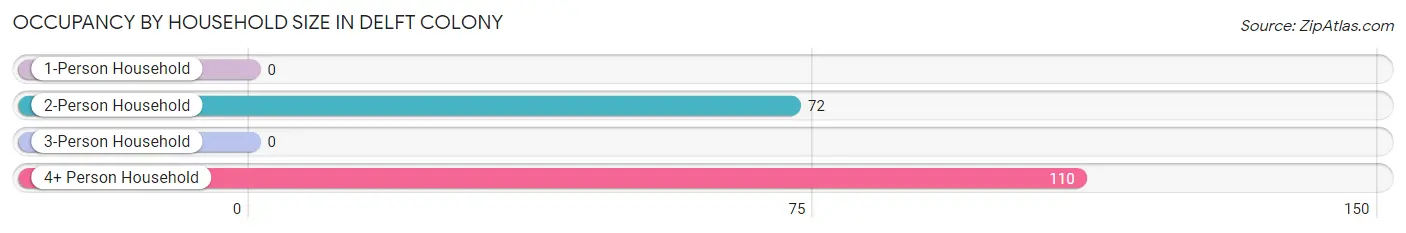
| Household Size | # Housing Units | % Housing Units |
| 1-Person Household | 0 | 0.0% |
| 2-Person Household | 72 | 39.6% |
| 3-Person Household | 0 | 0.0% |
| 4+ Person Household | 110 | 60.4% |
| Total Housing Units | 182 | 100.0% |
Occupancy by Ownership by Household Size in Delft Colony
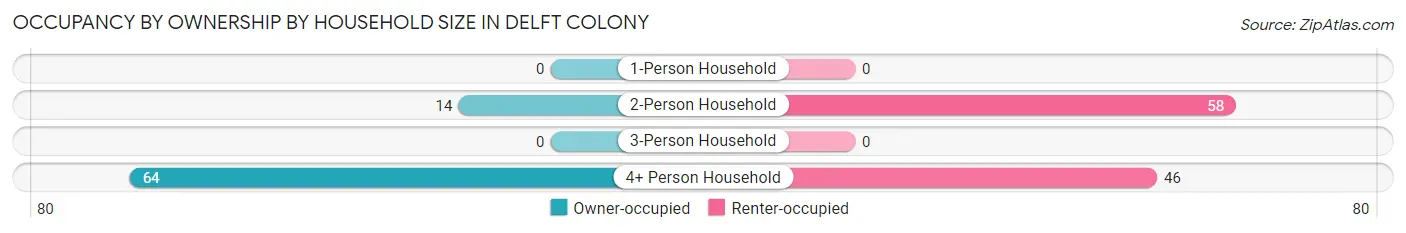
| Household Size | Owner-occupied | Renter-occupied |
| 1-Person Household | 0 (0.0%) | 0 (0.0%) |
| 2-Person Household | 14 (19.4%) | 58 (80.6%) |
| 3-Person Household | 0 (0.0%) | 0 (0.0%) |
| 4+ Person Household | 64 (58.2%) | 46 (41.8%) |
| Total Housing Units | 78 (42.9%) | 104 (57.1%) |
Occupancy by Educational Attainment in Delft Colony
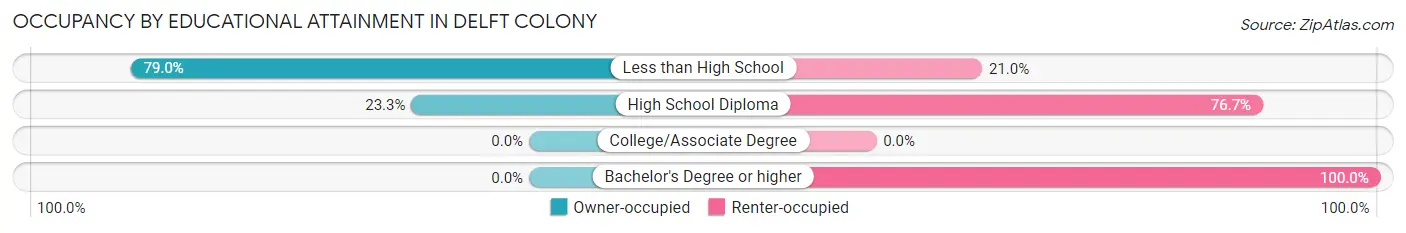
| Household Size | Owner-occupied | Renter-occupied |
| Less than High School | 64 (79.0%) | 17 (21.0%) |
| High School Diploma | 14 (23.3%) | 46 (76.7%) |
| College/Associate Degree | 0 (0.0%) | 0 (0.0%) |
| Bachelor's Degree or higher | 0 (0.0%) | 41 (100.0%) |
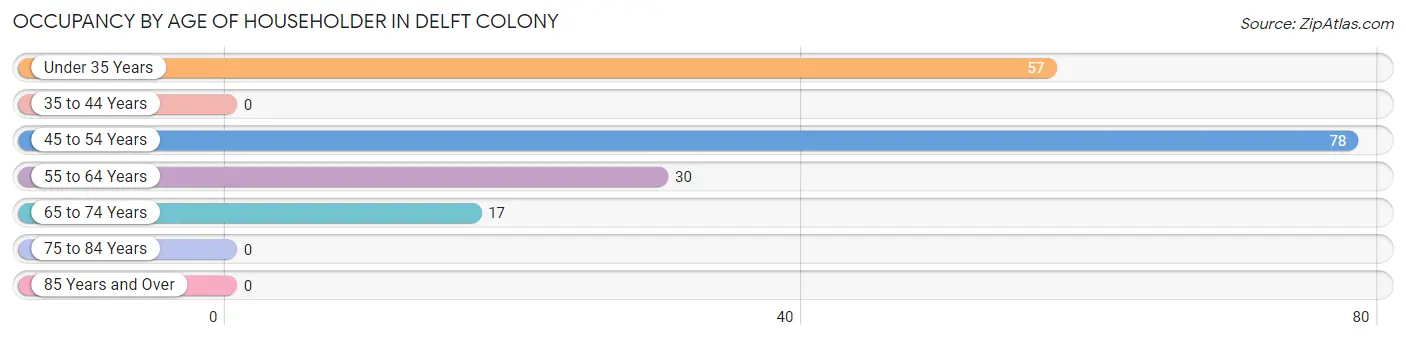
Occupancy by Age of Householder in Delft Colony
| Age Bracket | # Households | % Households |
| Under 35 Years | 57 | 31.3% |
| 35 to 44 Years | 0 | 0.0% |
| 45 to 54 Years | 78 | 42.9% |
| 55 to 64 Years | 30 | 16.5% |
| 65 to 74 Years | 17 | 9.3% |
| 75 to 84 Years | 0 | 0.0% |
| 85 Years and Over | 0 | 0.0% |
| Total | 182 | 100.0% |
Housing Finances in Delft Colony
Median Income by Occupancy in Delft Colony
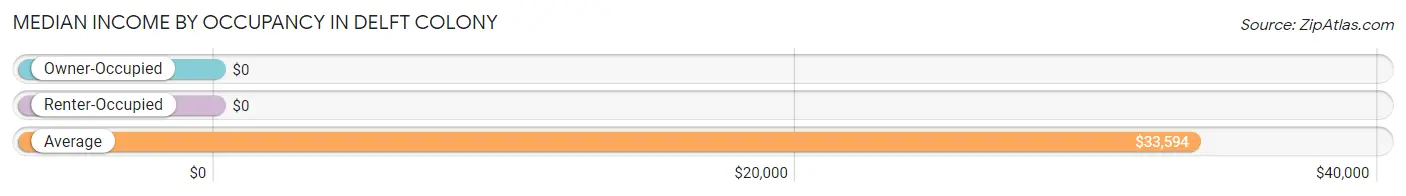
| Occupancy Type | # Households | Median Income |
| Owner-Occupied | 78 (42.9%) | $0 |
| Renter-Occupied | 104 (57.1%) | $0 |
| Average | 182 (100.0%) | $33,594 |
Occupancy by Householder Income Bracket in Delft Colony
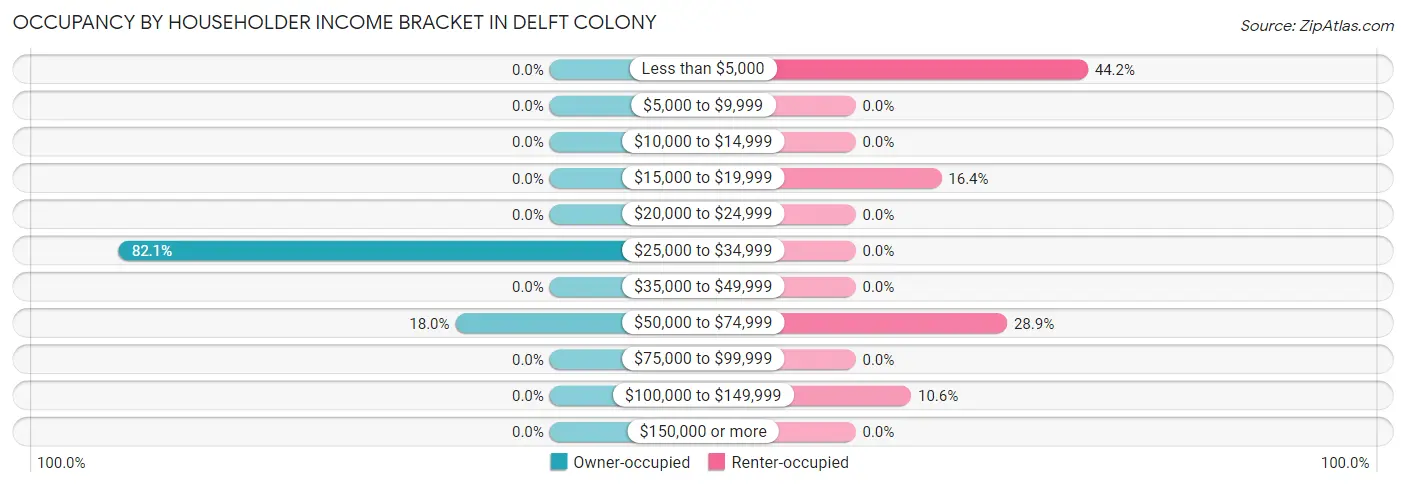
| Income Bracket | Owner-occupied | Renter-occupied |
| Less than $5,000 | 0 (0.0%) | 46 (44.2%) |
| $5,000 to $9,999 | 0 (0.0%) | 0 (0.0%) |
| $10,000 to $14,999 | 0 (0.0%) | 0 (0.0%) |
| $15,000 to $19,999 | 0 (0.0%) | 17 (16.4%) |
| $20,000 to $24,999 | 0 (0.0%) | 0 (0.0%) |
| $25,000 to $34,999 | 64 (82.1%) | 0 (0.0%) |
| $35,000 to $49,999 | 0 (0.0%) | 0 (0.0%) |
| $50,000 to $74,999 | 14 (17.9%) | 30 (28.8%) |
| $75,000 to $99,999 | 0 (0.0%) | 0 (0.0%) |
| $100,000 to $149,999 | 0 (0.0%) | 11 (10.6%) |
| $150,000 or more | 0 (0.0%) | 0 (0.0%) |
| Total | 78 (100.0%) | 104 (100.0%) |
Monthly Housing Cost Tiers in Delft Colony
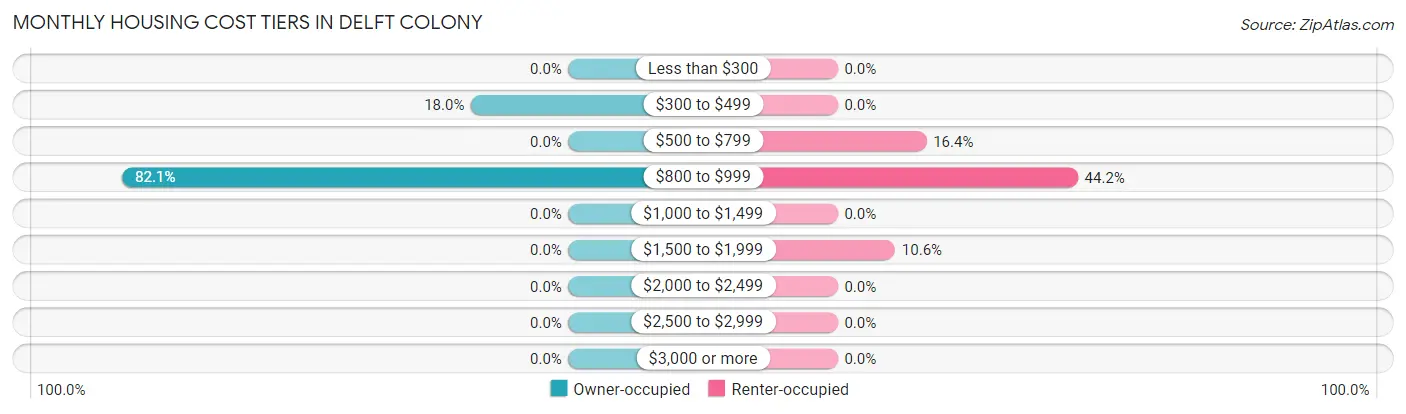
| Monthly Cost | Owner-occupied | Renter-occupied |
| Less than $300 | 0 (0.0%) | 0 (0.0%) |
| $300 to $499 | 14 (17.9%) | 0 (0.0%) |
| $500 to $799 | 0 (0.0%) | 17 (16.4%) |
| $800 to $999 | 64 (82.1%) | 46 (44.2%) |
| $1,000 to $1,499 | 0 (0.0%) | 0 (0.0%) |
| $1,500 to $1,999 | 0 (0.0%) | 11 (10.6%) |
| $2,000 to $2,499 | 0 (0.0%) | 0 (0.0%) |
| $2,500 to $2,999 | 0 (0.0%) | 0 (0.0%) |
| $3,000 or more | 0 (0.0%) | 0 (0.0%) |
| Total | 78 (100.0%) | 104 (100.0%) |
Physical Housing Characteristics in Delft Colony
Housing Structures in Delft Colony
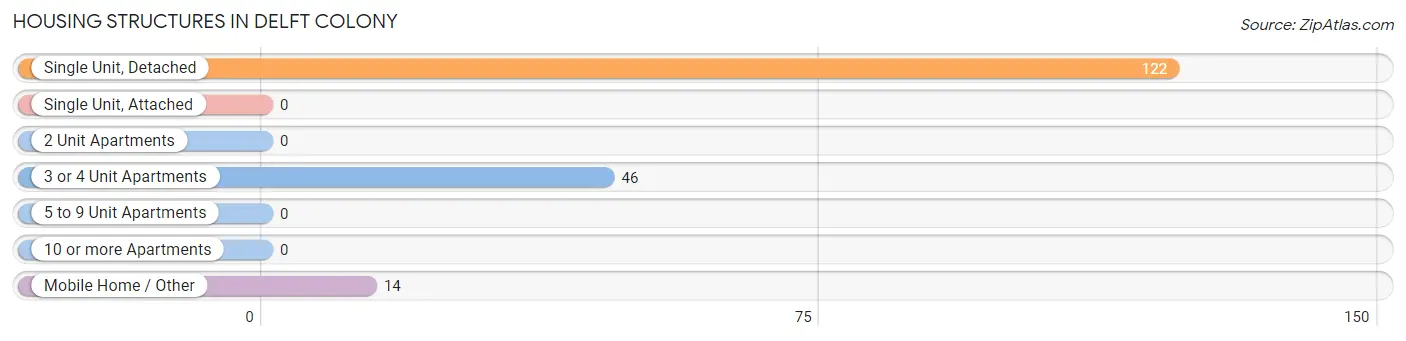
| Structure Type | # Housing Units | % Housing Units |
| Single Unit, Detached | 122 | 67.0% |
| Single Unit, Attached | 0 | 0.0% |
| 2 Unit Apartments | 0 | 0.0% |
| 3 or 4 Unit Apartments | 46 | 25.3% |
| 5 to 9 Unit Apartments | 0 | 0.0% |
| 10 or more Apartments | 0 | 0.0% |
| Mobile Home / Other | 14 | 7.7% |
| Total | 182 | 100.0% |
Housing Structures by Occupancy in Delft Colony
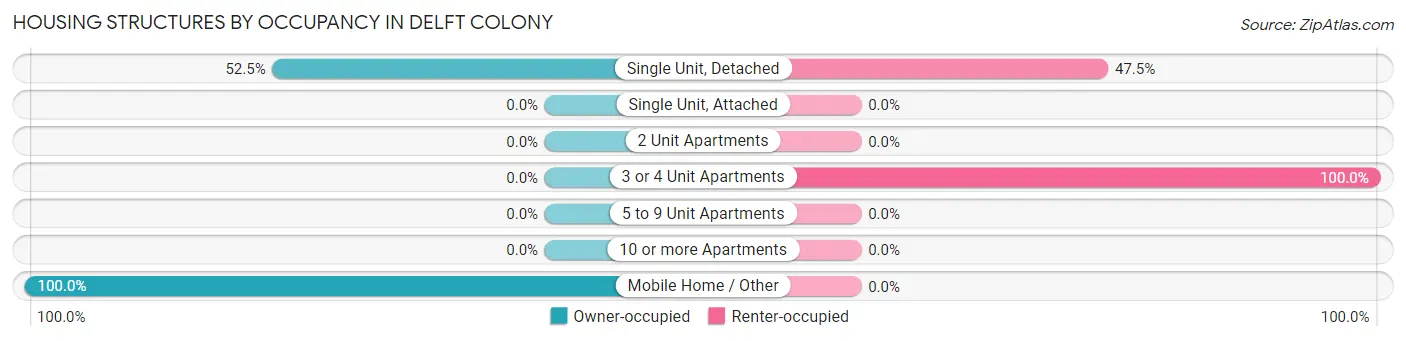
| Structure Type | Owner-occupied | Renter-occupied |
| Single Unit, Detached | 64 (52.5%) | 58 (47.5%) |
| Single Unit, Attached | 0 (0.0%) | 0 (0.0%) |
| 2 Unit Apartments | 0 (0.0%) | 0 (0.0%) |
| 3 or 4 Unit Apartments | 0 (0.0%) | 46 (100.0%) |
| 5 to 9 Unit Apartments | 0 (0.0%) | 0 (0.0%) |
| 10 or more Apartments | 0 (0.0%) | 0 (0.0%) |
| Mobile Home / Other | 14 (100.0%) | 0 (0.0%) |
| Total | 78 (42.9%) | 104 (57.1%) |
Housing Structures by Number of Rooms in Delft Colony
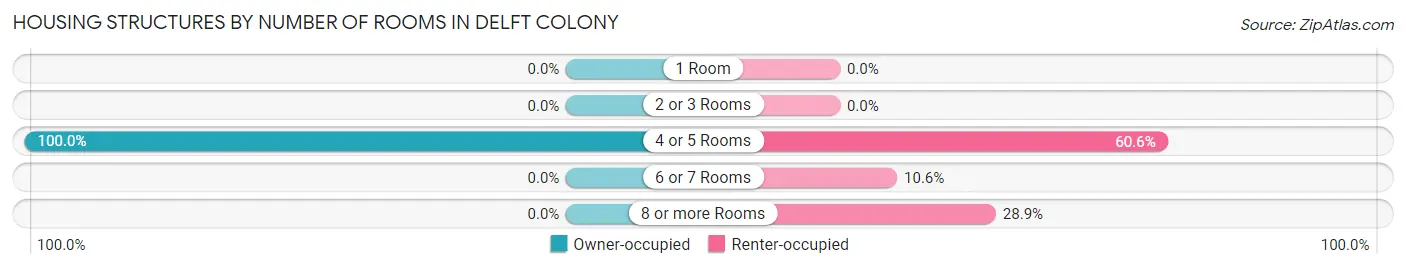
| Number of Rooms | Owner-occupied | Renter-occupied |
| 1 Room | 0 (0.0%) | 0 (0.0%) |
| 2 or 3 Rooms | 0 (0.0%) | 0 (0.0%) |
| 4 or 5 Rooms | 78 (100.0%) | 63 (60.6%) |
| 6 or 7 Rooms | 0 (0.0%) | 11 (10.6%) |
| 8 or more Rooms | 0 (0.0%) | 30 (28.8%) |
| Total | 78 (100.0%) | 104 (100.0%) |
Housing Structure by Heating Type in Delft Colony
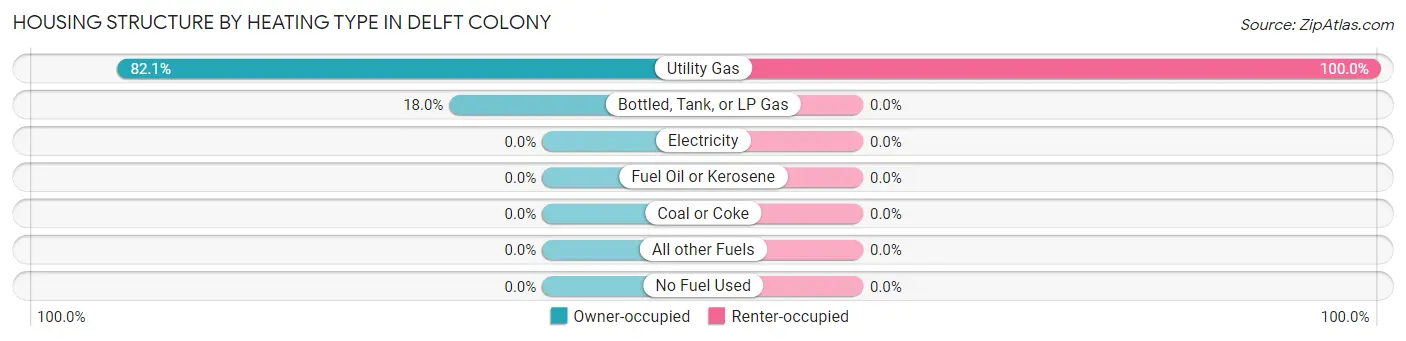
| Heating Type | Owner-occupied | Renter-occupied |
| Utility Gas | 64 (82.1%) | 104 (100.0%) |
| Bottled, Tank, or LP Gas | 14 (17.9%) | 0 (0.0%) |
| Electricity | 0 (0.0%) | 0 (0.0%) |
| Fuel Oil or Kerosene | 0 (0.0%) | 0 (0.0%) |
| Coal or Coke | 0 (0.0%) | 0 (0.0%) |
| All other Fuels | 0 (0.0%) | 0 (0.0%) |
| No Fuel Used | 0 (0.0%) | 0 (0.0%) |
| Total | 78 (100.0%) | 104 (100.0%) |
Household Vehicle Usage in Delft Colony
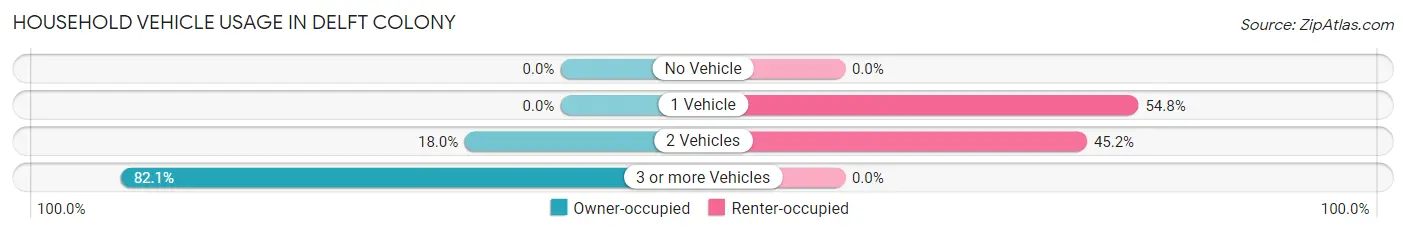
| Vehicles per Household | Owner-occupied | Renter-occupied |
| No Vehicle | 0 (0.0%) | 0 (0.0%) |
| 1 Vehicle | 0 (0.0%) | 57 (54.8%) |
| 2 Vehicles | 14 (17.9%) | 47 (45.2%) |
| 3 or more Vehicles | 64 (82.1%) | 0 (0.0%) |
| Total | 78 (100.0%) | 104 (100.0%) |
Real Estate & Mortgages in Delft Colony
Real Estate and Mortgage Overview in Delft Colony
| Characteristic | Without Mortgage | With Mortgage |
| Housing Units | 14 | 64 |
| Median Property Value | - | - |
| Median Household Income | - | - |
| Monthly Housing Costs | - | - |
| Real Estate Taxes | - | - |
Property Value by Mortgage Status in Delft Colony
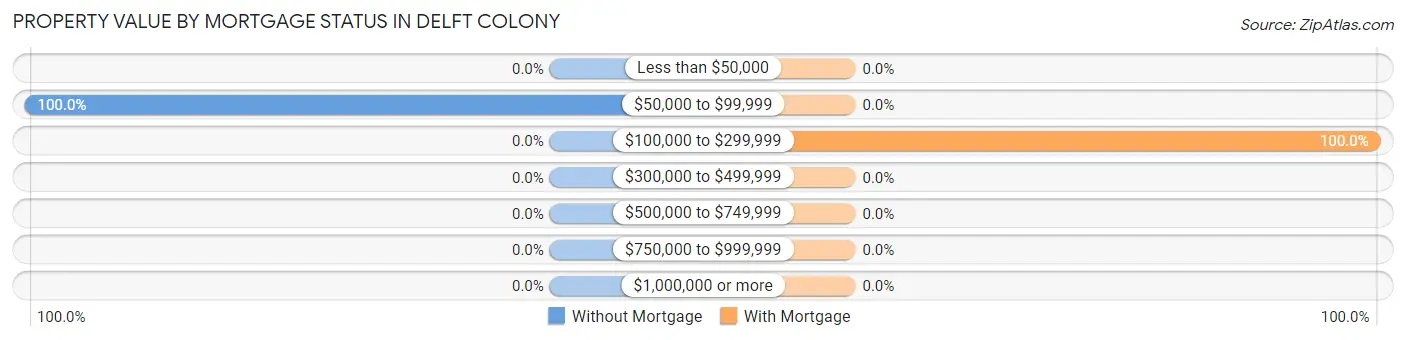
| Property Value | Without Mortgage | With Mortgage |
| Less than $50,000 | 0 (0.0%) | 0 (0.0%) |
| $50,000 to $99,999 | 14 (100.0%) | 0 (0.0%) |
| $100,000 to $299,999 | 0 (0.0%) | 64 (100.0%) |
| $300,000 to $499,999 | 0 (0.0%) | 0 (0.0%) |
| $500,000 to $749,999 | 0 (0.0%) | 0 (0.0%) |
| $750,000 to $999,999 | 0 (0.0%) | 0 (0.0%) |
| $1,000,000 or more | 0 (0.0%) | 0 (0.0%) |
| Total | 14 (100.0%) | 64 (100.0%) |
Household Income by Mortgage Status in Delft Colony
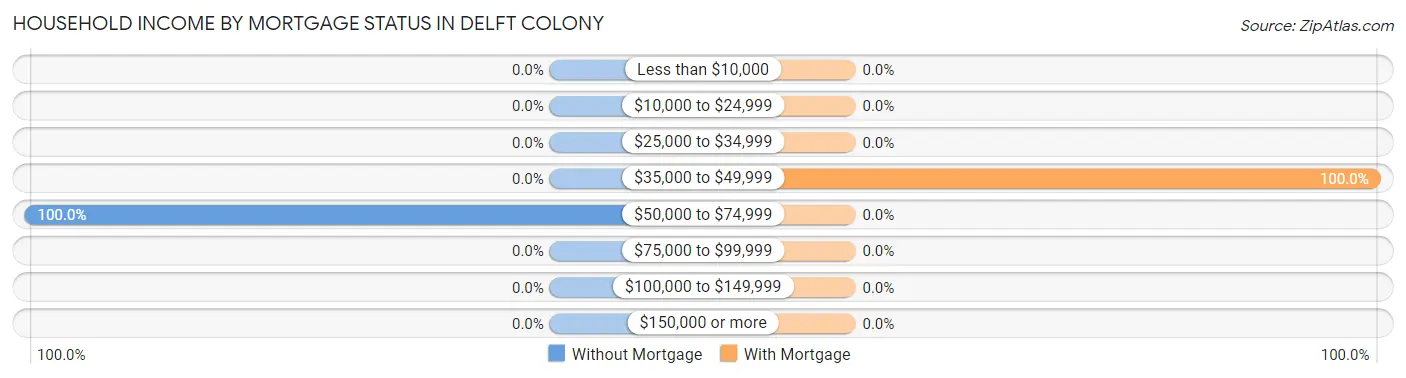
| Household Income | Without Mortgage | With Mortgage |
| Less than $10,000 | 0 (0.0%) | 0 (0.0%) |
| $10,000 to $24,999 | 0 (0.0%) | 0 (0.0%) |
| $25,000 to $34,999 | 0 (0.0%) | 0 (0.0%) |
| $35,000 to $49,999 | 0 (0.0%) | 64 (100.0%) |
| $50,000 to $74,999 | 14 (100.0%) | 0 (0.0%) |
| $75,000 to $99,999 | 0 (0.0%) | 0 (0.0%) |
| $100,000 to $149,999 | 0 (0.0%) | 0 (0.0%) |
| $150,000 or more | 0 (0.0%) | 0 (0.0%) |
| Total | 14 (100.0%) | 64 (100.0%) |
Property Value to Household Income Ratio in Delft Colony
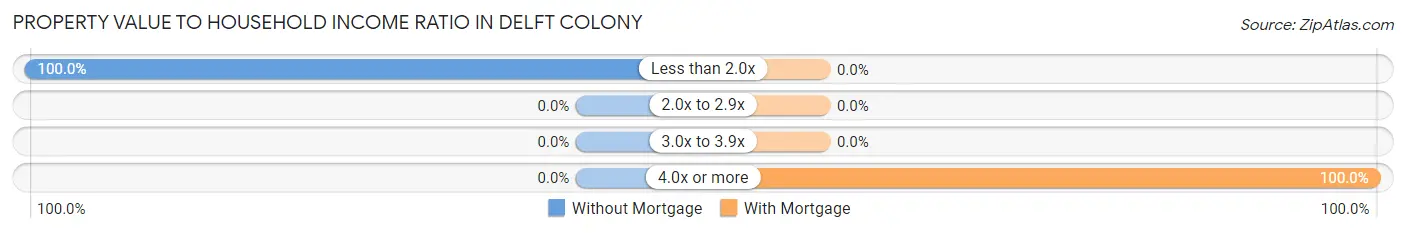
| Value-to-Income Ratio | Without Mortgage | With Mortgage |
| Less than 2.0x | 14 (100.0%) | 0 (0.0%) |
| 2.0x to 2.9x | 0 (0.0%) | 0 (0.0%) |
| 3.0x to 3.9x | 0 (0.0%) | 0 (0.0%) |
| 4.0x or more | 0 (0.0%) | 64 (100.0%) |
| Total | 14 (100.0%) | 64 (100.0%) |
Real Estate Taxes by Mortgage Status in Delft Colony

| Property Taxes | Without Mortgage | With Mortgage |
| Less than $800 | 0 (0.0%) | 0 (0.0%) |
| $800 to $1,499 | 14 (100.0%) | 64 (100.0%) |
| $800 to $1,499 | 0 (0.0%) | 0 (0.0%) |
| Total | 14 (100.0%) | 64 (100.0%) |
Health & Disability in Delft Colony
Health Insurance Coverage by Age in Delft Colony
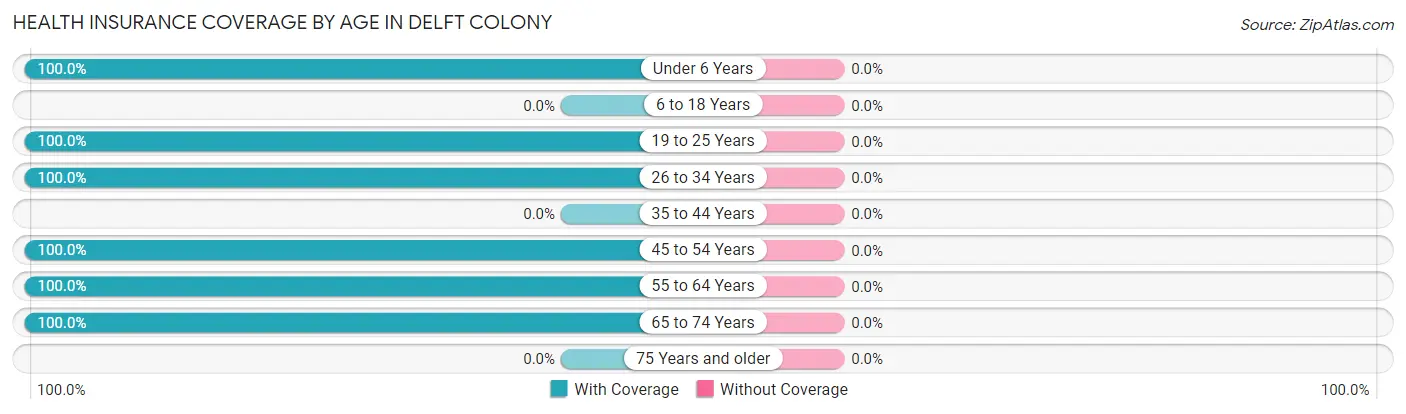
| Age Bracket | With Coverage | Without Coverage |
| Under 6 Years | 277 (100.0%) | 0 (0.0%) |
| 6 to 18 Years | 0 (0.0%) | 0 (0.0%) |
| 19 to 25 Years | 334 (100.0%) | 0 (0.0%) |
| 26 to 34 Years | 191 (100.0%) | 0 (0.0%) |
| 35 to 44 Years | 0 (0.0%) | 0 (0.0%) |
| 45 to 54 Years | 78 (100.0%) | 0 (0.0%) |
| 55 to 64 Years | 106 (100.0%) | 0 (0.0%) |
| 65 to 74 Years | 52 (100.0%) | 0 (0.0%) |
| 75 Years and older | 0 (0.0%) | 0 (0.0%) |
| Total | 1,038 (100.0%) | 0 (0.0%) |
Health Insurance Coverage by Citizenship Status in Delft Colony

| Citizenship Status | With Coverage | Without Coverage |
| Native Born | 277 (100.0%) | 0 (0.0%) |
| Foreign Born, Citizen | 0 (0.0%) | 0 (0.0%) |
| Foreign Born, not a Citizen | 334 (100.0%) | 0 (0.0%) |
Health Insurance Coverage by Household Income in Delft Colony
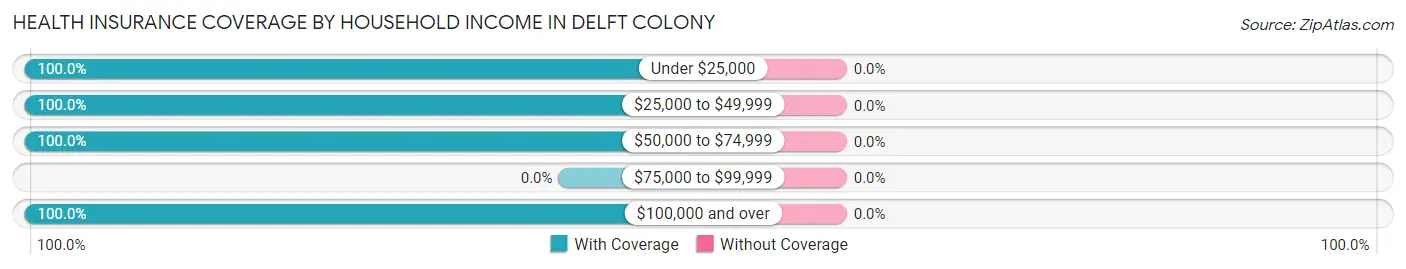
| Household Income | With Coverage | Without Coverage |
| Under $25,000 | 225 (100.0%) | 0 (0.0%) |
| $25,000 to $49,999 | 713 (100.0%) | 0 (0.0%) |
| $50,000 to $74,999 | 77 (100.0%) | 0 (0.0%) |
| $75,000 to $99,999 | 0 (0.0%) | 0 (0.0%) |
| $100,000 and over | 23 (100.0%) | 0 (0.0%) |
Public vs Private Health Insurance Coverage by Age in Delft Colony
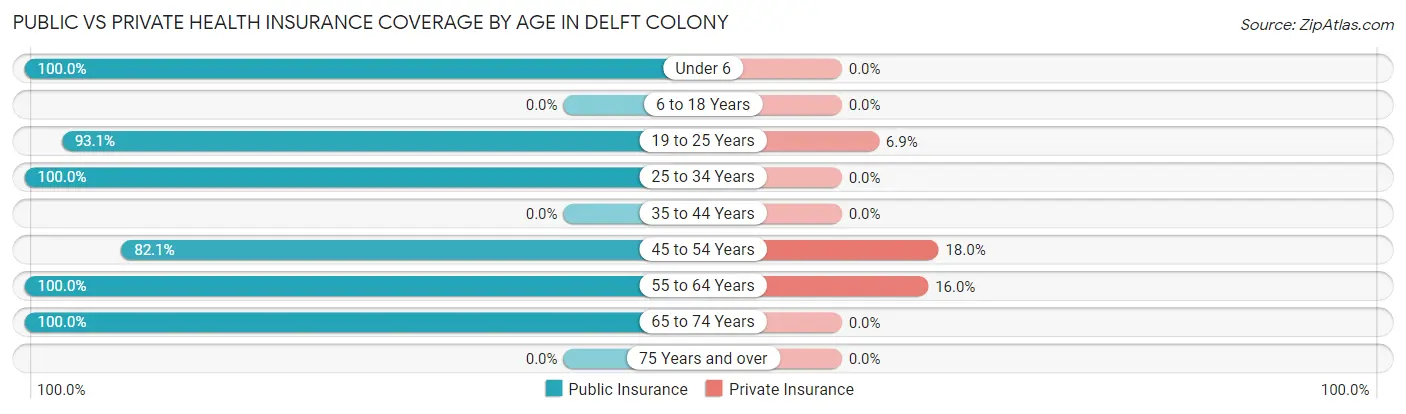
| Age Bracket | Public Insurance | Private Insurance |
| Under 6 | 277 (100.0%) | 0 (0.0%) |
| 6 to 18 Years | 0 (0.0%) | 0 (0.0%) |
| 19 to 25 Years | 311 (93.1%) | 23 (6.9%) |
| 25 to 34 Years | 191 (100.0%) | 0 (0.0%) |
| 35 to 44 Years | 0 (0.0%) | 0 (0.0%) |
| 45 to 54 Years | 64 (82.1%) | 14 (17.9%) |
| 55 to 64 Years | 106 (100.0%) | 17 (16.0%) |
| 65 to 74 Years | 52 (100.0%) | 0 (0.0%) |
| 75 Years and over | 0 (0.0%) | 0 (0.0%) |
| Total | 1,001 (96.4%) | 54 (5.2%) |
Disability Status by Sex by Age in Delft Colony
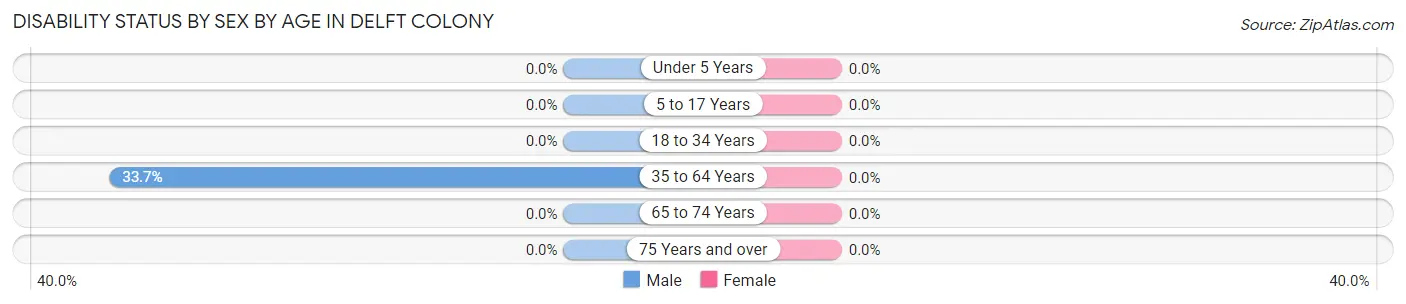
| Age Bracket | Male | Female |
| Under 5 Years | 0 (0.0%) | 0 (0.0%) |
| 5 to 17 Years | 0 (0.0%) | 0 (0.0%) |
| 18 to 34 Years | 0 (0.0%) | 0 (0.0%) |
| 35 to 64 Years | 30 (33.7%) | 0 (0.0%) |
| 65 to 74 Years | 0 (0.0%) | 0 (0.0%) |
| 75 Years and over | 0 (0.0%) | 0 (0.0%) |
Disability Class by Sex by Age in Delft Colony
Disability Class: Hearing Difficulty
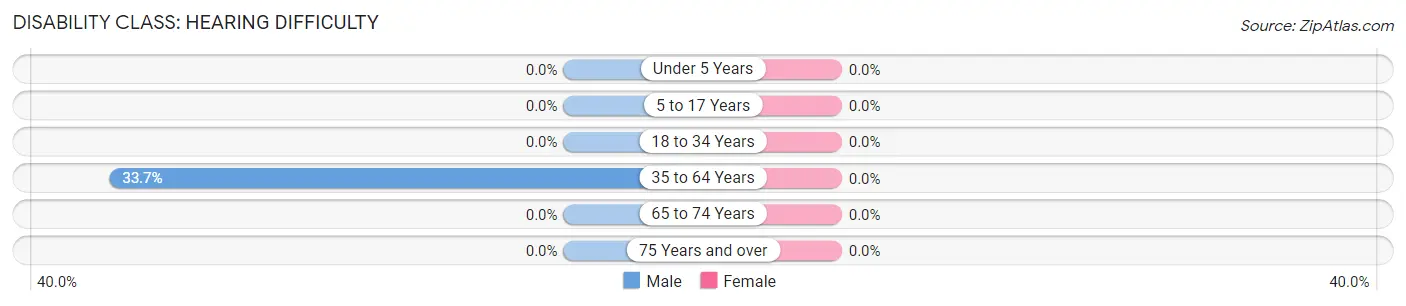
| Age Bracket | Male | Female |
| Under 5 Years | 0 (0.0%) | 0 (0.0%) |
| 5 to 17 Years | 0 (0.0%) | 0 (0.0%) |
| 18 to 34 Years | 0 (0.0%) | 0 (0.0%) |
| 35 to 64 Years | 30 (33.7%) | 0 (0.0%) |
| 65 to 74 Years | 0 (0.0%) | 0 (0.0%) |
| 75 Years and over | 0 (0.0%) | 0 (0.0%) |
Disability Class: Vision Difficulty
| Age Bracket | Male | Female |
| Under 5 Years | 0 (0.0%) | 0 (0.0%) |
| 5 to 17 Years | 0 (0.0%) | 0 (0.0%) |
| 18 to 34 Years | 0 (0.0%) | 0 (0.0%) |
| 35 to 64 Years | 0 (0.0%) | 0 (0.0%) |
| 65 to 74 Years | 0 (0.0%) | 0 (0.0%) |
| 75 Years and over | 0 (0.0%) | 0 (0.0%) |
Disability Class: Cognitive Difficulty
| Age Bracket | Male | Female |
| 5 to 17 Years | 0 (0.0%) | 0 (0.0%) |
| 18 to 34 Years | 0 (0.0%) | 0 (0.0%) |
| 35 to 64 Years | 0 (0.0%) | 0 (0.0%) |
| 65 to 74 Years | 0 (0.0%) | 0 (0.0%) |
| 75 Years and over | 0 (0.0%) | 0 (0.0%) |
Disability Class: Ambulatory Difficulty
| Age Bracket | Male | Female |
| 5 to 17 Years | 0 (0.0%) | 0 (0.0%) |
| 18 to 34 Years | 0 (0.0%) | 0 (0.0%) |
| 35 to 64 Years | 0 (0.0%) | 0 (0.0%) |
| 65 to 74 Years | 0 (0.0%) | 0 (0.0%) |
| 75 Years and over | 0 (0.0%) | 0 (0.0%) |
Disability Class: Self-Care Difficulty
| Age Bracket | Male | Female |
| 5 to 17 Years | 0 (0.0%) | 0 (0.0%) |
| 18 to 34 Years | 0 (0.0%) | 0 (0.0%) |
| 35 to 64 Years | 0 (0.0%) | 0 (0.0%) |
| 65 to 74 Years | 0 (0.0%) | 0 (0.0%) |
| 75 Years and over | 0 (0.0%) | 0 (0.0%) |
Technology Access in Delft Colony
Computing Device Access in Delft Colony
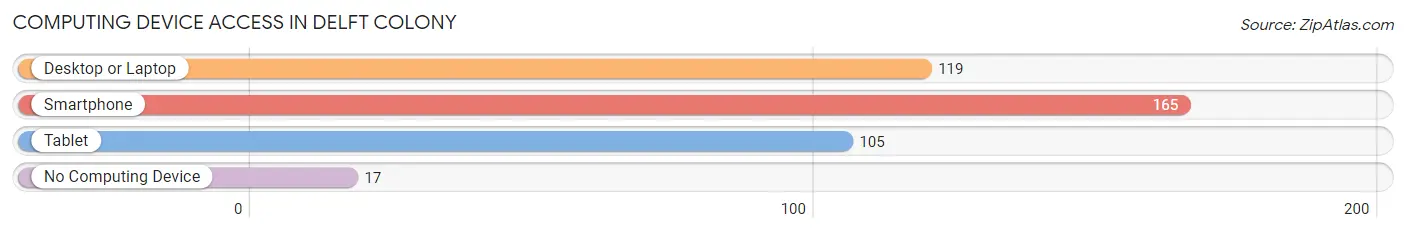
| Device Type | # Households | % Households |
| Desktop or Laptop | 119 | 65.4% |
| Smartphone | 165 | 90.7% |
| Tablet | 105 | 57.7% |
| No Computing Device | 17 | 9.3% |
| Total | 182 | 100.0% |
Internet Access in Delft Colony
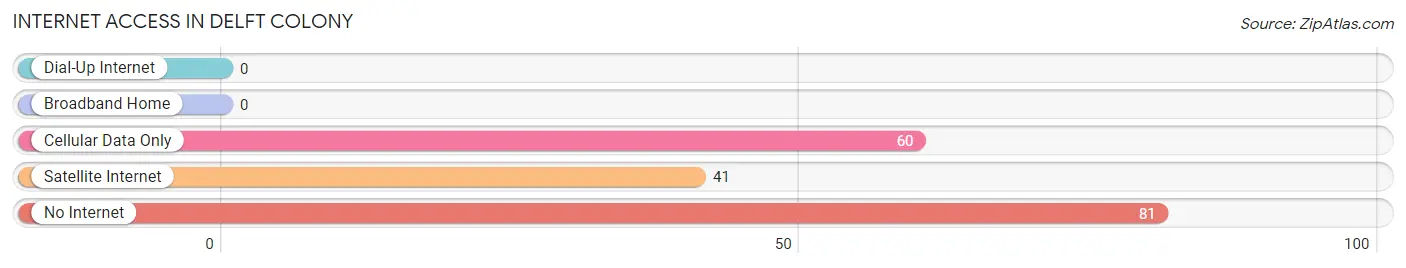
| Internet Type | # Households | % Households |
| Dial-Up Internet | 0 | 0.0% |
| Broadband Home | 0 | 0.0% |
| Cellular Data Only | 60 | 33.0% |
| Satellite Internet | 41 | 22.5% |
| No Internet | 81 | 44.5% |
| Total | 182 | 100.0% |
Delft Colony Summary
Delft Colony is a small unincorporated community located in the Central Valley of California, in the county of Fresno. It is situated in the foothills of the Sierra Nevada Mountains, approximately 25 miles east of Fresno. The community is home to a diverse population of approximately 1,000 people, and is known for its unique Dutch-style architecture and culture.
History
Delft Colony was founded in 1891 by Dutch immigrants who had come to California in search of a better life. The original settlers were from the Dutch province of Zeeland, and they named the community after their hometown of Delft. The settlers were attracted to the area by its fertile soil and mild climate, and they quickly established a thriving agricultural community. The settlers built homes in the traditional Dutch style, with steeply pitched roofs and white-washed walls. They also built a church, a school, and a general store.
The community flourished for several decades, and by the mid-20th century, Delft Colony had become a popular tourist destination. Visitors were drawn to the area by its unique architecture and culture, and the community was featured in several books and magazines.
Geography
Delft Colony is located in the Central Valley of California, in the county of Fresno. It is situated in the foothills of the Sierra Nevada Mountains, approximately 25 miles east of Fresno. The community is surrounded by rolling hills and farmland, and is bordered by the Kings River to the north and the San Joaquin River to the south.
The climate in Delft Colony is mild and temperate, with hot summers and cool winters. The average annual temperature is around 65°F, and the average annual precipitation is around 10 inches.
Economy
The economy of Delft Colony is largely based on agriculture. The area is known for its production of citrus fruits, nuts, and vegetables, and the community is home to several large farms and orchards. In addition, the community is home to several small businesses, including a general store, a restaurant, and a bed and breakfast.
Demographics
As of the 2010 census, the population of Delft Colony was 1,000. The racial makeup of the community was 95.2% White, 0.7% African American, 0.7% Native American, 0.7% Asian, 0.3% Pacific Islander, and 2.1% from other races. The median household income was $45,000, and the median age was 40.
Delft Colony is a close-knit community, and the residents are proud of their Dutch heritage. The community is home to several Dutch-style festivals and events, and the local school teaches classes in Dutch language and culture.
Common Questions
What is Per Capita Income in Delft Colony?
Per Capita income in Delft Colony is $6,714.
What is the Median Family Income in Delft Colony?
Median Family Income in Delft Colony is $33,320.
What is the Median Household income in Delft Colony?
Median Household Income in Delft Colony is $33,594.
What is Inequality or Gini Index in Delft Colony?
Inequality or Gini Index in Delft Colony is 0.44.
What is the Total Population of Delft Colony?
Total Population of Delft Colony is 1,038.
What is the Total Male Population of Delft Colony?
Total Male Population of Delft Colony is 458.
What is the Total Female Population of Delft Colony?
Total Female Population of Delft Colony is 580.
What is the Ratio of Males per 100 Females in Delft Colony?
There are 78.97 Males per 100 Females in Delft Colony.
What is the Ratio of Females per 100 Males in Delft Colony?
There are 126.64 Females per 100 Males in Delft Colony.
What is the Median Population Age in Delft Colony?
Median Population Age in Delft Colony is 24.3 Years.
What is the Average Family Size in Delft Colony
Average Family Size in Delft Colony is 5.7 People.
What is the Average Household Size in Delft Colony
Average Household Size in Delft Colony is 5.7 People.
How Large is the Labor Force in Delft Colony?
There are 380 People in the Labor Forcein in Delft Colony.
What is the Percentage of People in the Labor Force in Delft Colony?
49.9% of People are in the Labor Force in Delft Colony.
What is the Unemployment Rate in Delft Colony?
Unemployment Rate in Delft Colony is 50.3%.