Cities with the Highest Percentage of Population with a Degree in Liberal Arts and History in Kentucky
RELATED REPORTS & OPTIONS
Liberal Arts and History
Kentucky
Compare Cities
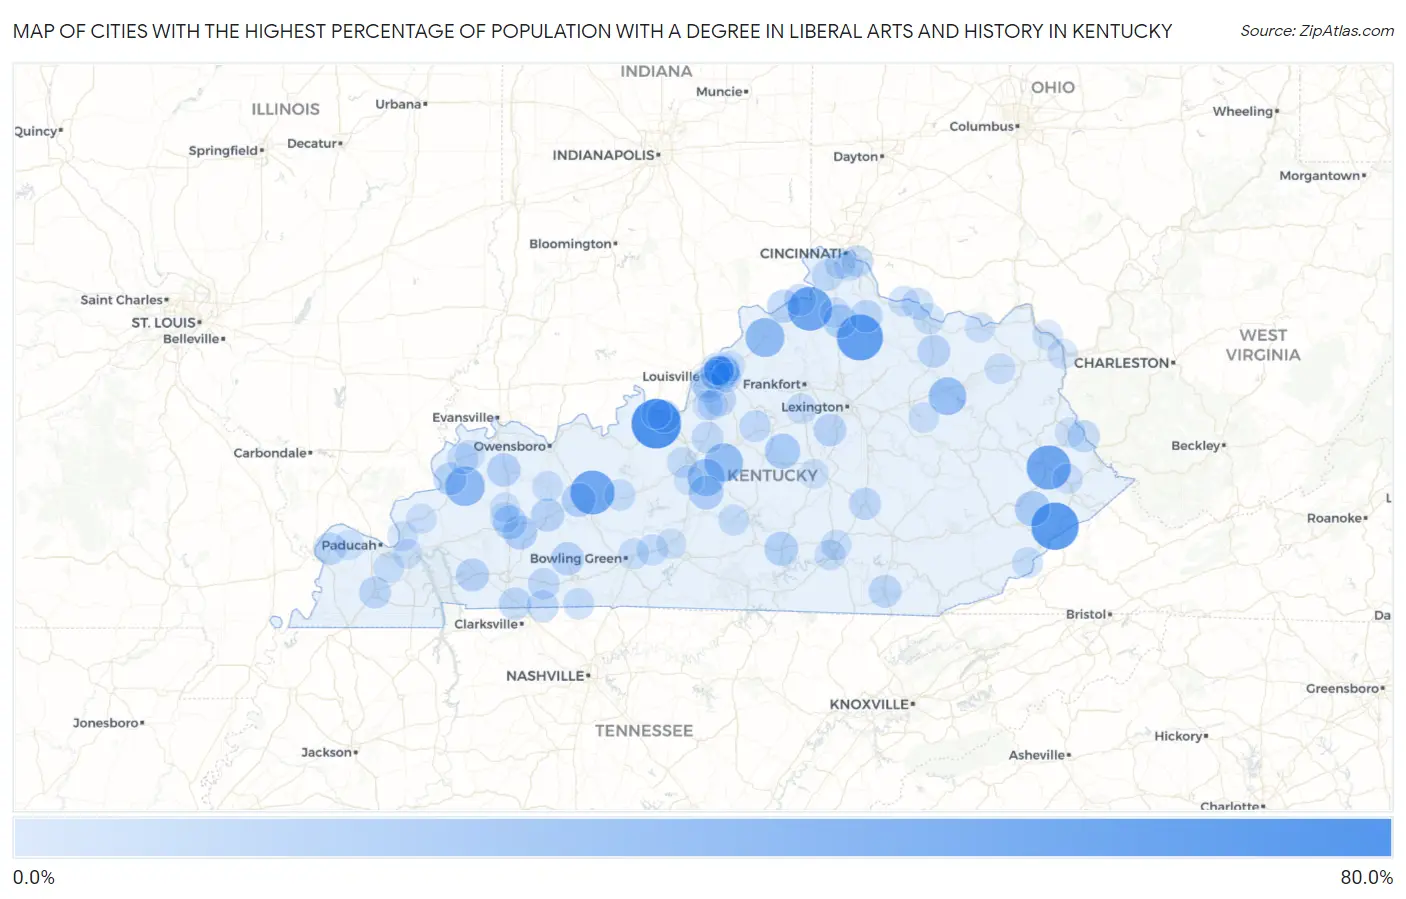
Map of Cities with the Highest Percentage of Population with a Degree in Liberal Arts and History in Kentucky
0.0%
80.0%
Cities with the Highest Percentage of Population with a Degree in Liberal Arts and History in Kentucky
| City | % Graduates | vs State | vs National | |
| 1. | Ekron | 66.7% | 5.3%(+61.3)#1 | 4.9%(+61.8)#142 |
| 2. | Mcroberts | 60.0% | 5.3%(+54.7)#2 | 4.9%(+55.1)#173 |
| 3. | Berry | 55.6% | 5.3%(+50.2)#3 | 4.9%(+50.7)#199 |
| 4. | Glencoe | 50.0% | 5.3%(+44.7)#4 | 4.9%(+45.1)#237 |
| 5. | Dwale | 50.0% | 5.3%(+44.7)#5 | 4.9%(+45.1)#253 |
| 6. | Rosine | 50.0% | 5.3%(+44.7)#6 | 4.9%(+45.1)#258 |
| 7. | Wheatcroft | 36.0% | 5.3%(+30.7)#7 | 4.9%(+31.1)#460 |
| 8. | Campbellsburg | 34.4% | 5.3%(+29.0)#8 | 4.9%(+29.5)#501 |
| 9. | New Haven | 32.9% | 5.3%(+27.5)#9 | 4.9%(+28.0)#570 |
| 10. | Salt Lick | 30.6% | 5.3%(+25.3)#10 | 4.9%(+25.7)#639 |
| 11. | Hodgenville | 29.2% | 5.3%(+23.9)#11 | 4.9%(+24.4)#686 |
| 12. | Pippa Passes | 23.2% | 5.3%(+17.8)#12 | 4.9%(+18.3)#1,022 |
| 13. | Mackville | 23.0% | 5.3%(+17.7)#13 | 4.9%(+18.1)#1,034 |
| 14. | White Plains | 20.0% | 5.3%(+14.7)#14 | 4.9%(+15.1)#1,262 |
| 15. | Magnolia | 19.8% | 5.3%(+14.5)#15 | 4.9%(+14.9)#1,318 |
| 16. | Beaver Dam | 19.7% | 5.3%(+14.4)#16 | 4.9%(+14.9)#1,321 |
| 17. | Russell Springs | 19.6% | 5.3%(+14.3)#17 | 4.9%(+14.7)#1,329 |
| 18. | Mortons Gap | 19.5% | 5.3%(+14.2)#18 | 4.9%(+14.6)#1,338 |
| 19. | Williamstown | 18.8% | 5.3%(+13.5)#19 | 4.9%(+14.0)#1,418 |
| 20. | Sebree | 18.2% | 5.3%(+12.9)#20 | 4.9%(+13.3)#1,475 |
| 21. | Ghent | 17.6% | 5.3%(+12.3)#21 | 4.9%(+12.8)#1,558 |
| 22. | Lewisburg | 17.4% | 5.3%(+12.1)#22 | 4.9%(+12.5)#1,589 |
| 23. | Central City | 17.3% | 5.3%(+11.9)#23 | 4.9%(+12.4)#1,618 |
| 24. | Doe Valley | 17.0% | 5.3%(+11.7)#24 | 4.9%(+12.1)#1,656 |
| 25. | Sturgis | 16.8% | 5.3%(+11.5)#25 | 4.9%(+12.0)#1,678 |
| 26. | Cadiz | 16.8% | 5.3%(+11.5)#26 | 4.9%(+11.9)#1,686 |
| 27. | Flemingsburg | 16.3% | 5.3%(+11.0)#27 | 4.9%(+11.5)#1,792 |
| 28. | Wilmore | 15.8% | 5.3%(+10.5)#28 | 4.9%(+10.9)#1,900 |
| 29. | Williamsburg | 15.8% | 5.3%(+10.4)#29 | 4.9%(+10.9)#1,901 |
| 30. | Oak Grove | 15.4% | 5.3%(+10.1)#30 | 4.9%(+10.5)#1,960 |
| 31. | Barlow | 15.2% | 5.3%(+9.82)#31 | 4.9%(+10.3)#2,023 |
| 32. | Falmouth | 15.1% | 5.3%(+9.78)#32 | 4.9%(+10.2)#2,027 |
| 33. | Manor Creek | 14.9% | 5.3%(+9.61)#33 | 4.9%(+10.1)#2,058 |
| 34. | Briarwood | 14.7% | 5.3%(+9.34)#34 | 4.9%(+9.80)#2,112 |
| 35. | Mount Vernon | 14.5% | 5.3%(+9.16)#35 | 4.9%(+9.61)#2,153 |
| 36. | Heritage Creek | 14.4% | 5.3%(+9.10)#36 | 4.9%(+9.56)#2,167 |
| 37. | Warfield | 14.3% | 5.3%(+8.96)#37 | 4.9%(+9.41)#2,223 |
| 38. | Warsaw | 13.9% | 5.3%(+8.60)#38 | 4.9%(+9.06)#2,322 |
| 39. | Mayfield | 13.9% | 5.3%(+8.53)#39 | 4.9%(+8.99)#2,340 |
| 40. | Norwood | 13.6% | 5.3%(+8.31)#40 | 4.9%(+8.76)#2,413 |
| 41. | Crossgate | 13.6% | 5.3%(+8.31)#41 | 4.9%(+8.76)#2,420 |
| 42. | Guthrie | 13.4% | 5.3%(+8.10)#42 | 4.9%(+8.56)#2,470 |
| 43. | Silver Grove | 13.3% | 5.3%(+8.00)#43 | 4.9%(+8.46)#2,501 |
| 44. | Windy Hills | 13.3% | 5.3%(+8.00)#44 | 4.9%(+8.46)#2,533 |
| 45. | Lebanon Junction | 13.2% | 5.3%(+7.91)#45 | 4.9%(+8.36)#2,545 |
| 46. | Union | 13.0% | 5.3%(+7.71)#46 | 4.9%(+8.17)#2,602 |
| 47. | Elkton | 13.0% | 5.3%(+7.67)#47 | 4.9%(+8.13)#2,609 |
| 48. | Bloomfield | 12.9% | 5.3%(+7.56)#48 | 4.9%(+8.01)#2,649 |
| 49. | Glenview | 12.6% | 5.3%(+7.26)#49 | 4.9%(+7.72)#2,731 |
| 50. | Dover | 12.5% | 5.3%(+7.17)#50 | 4.9%(+7.63)#2,776 |
| 51. | Caneyville | 12.4% | 5.3%(+7.03)#51 | 4.9%(+7.49)#2,832 |
| 52. | Meadowbrook Farm | 12.2% | 5.3%(+6.87)#52 | 4.9%(+7.32)#2,894 |
| 53. | Parkway Village | 12.0% | 5.3%(+6.67)#53 | 4.9%(+7.13)#2,970 |
| 54. | Adairville | 11.9% | 5.3%(+6.61)#54 | 4.9%(+7.07)#2,998 |
| 55. | Maysville | 11.9% | 5.3%(+6.52)#55 | 4.9%(+6.98)#3,037 |
| 56. | Smiths Grove | 11.7% | 5.3%(+6.36)#56 | 4.9%(+6.82)#3,114 |
| 57. | Morganfield | 11.6% | 5.3%(+6.27)#57 | 4.9%(+6.73)#3,148 |
| 58. | Cecilia | 11.1% | 5.3%(+5.78)#58 | 4.9%(+6.24)#3,358 |
| 59. | Greensburg | 11.0% | 5.3%(+5.67)#59 | 4.9%(+6.13)#3,426 |
| 60. | Lynch | 11.0% | 5.3%(+5.67)#60 | 4.9%(+6.13)#3,429 |
| 61. | Langdon Place | 11.0% | 5.3%(+5.66)#61 | 4.9%(+6.11)#3,435 |
| 62. | Crestview Hills | 11.0% | 5.3%(+5.63)#62 | 4.9%(+6.09)#3,451 |
| 63. | Lynnview | 10.9% | 5.3%(+5.59)#63 | 4.9%(+6.05)#3,468 |
| 64. | Plum Springs | 10.9% | 5.3%(+5.58)#64 | 4.9%(+6.04)#3,478 |
| 65. | Symsonia | 10.9% | 5.3%(+5.55)#65 | 4.9%(+6.01)#3,489 |
| 66. | Old Brownsboro Place | 10.6% | 5.3%(+5.26)#66 | 4.9%(+5.72)#3,643 |
| 67. | Lawrenceburg | 10.6% | 5.3%(+5.22)#67 | 4.9%(+5.68)#3,664 |
| 68. | Livermore | 10.3% | 5.3%(+4.98)#68 | 4.9%(+5.44)#3,809 |
| 69. | Augusta | 10.3% | 5.3%(+4.96)#69 | 4.9%(+5.42)#3,813 |
| 70. | Burnside | 10.3% | 5.3%(+4.93)#70 | 4.9%(+5.38)#3,829 |
| 71. | Somerset | 10.2% | 5.3%(+4.90)#71 | 4.9%(+5.36)#3,848 |
| 72. | Olive Hill | 10.1% | 5.3%(+4.77)#72 | 4.9%(+5.22)#3,921 |
| 73. | Jeffersonville | 10.1% | 5.3%(+4.73)#73 | 4.9%(+5.19)#3,948 |
| 74. | Brooks | 9.9% | 5.3%(+4.53)#74 | 4.9%(+4.99)#4,073 |
| 75. | Raceland | 9.5% | 5.3%(+4.22)#75 | 4.9%(+4.67)#4,290 |
| 76. | Smithland | 9.5% | 5.3%(+4.19)#76 | 4.9%(+4.65)#4,318 |
| 77. | Dry Ridge | 9.5% | 5.3%(+4.14)#77 | 4.9%(+4.60)#4,349 |
| 78. | Vanceburg | 9.4% | 5.3%(+4.10)#78 | 4.9%(+4.56)#4,376 |
| 79. | Catlettsburg | 9.4% | 5.3%(+4.08)#79 | 4.9%(+4.54)#4,392 |
| 80. | Coal Run Village | 9.4% | 5.3%(+4.07)#80 | 4.9%(+4.53)#4,396 |
| 81. | Orchard Grass Hills | 9.4% | 5.3%(+4.04)#81 | 4.9%(+4.50)#4,425 |
| 82. | Hillview | 9.4% | 5.3%(+4.04)#82 | 4.9%(+4.49)#4,427 |
| 83. | Thruston | 9.3% | 5.3%(+4.00)#83 | 4.9%(+4.46)#4,451 |
| 84. | Brandenburg | 9.3% | 5.3%(+3.97)#84 | 4.9%(+4.43)#4,469 |
| 85. | Salem | 9.3% | 5.3%(+3.97)#85 | 4.9%(+4.43)#4,475 |
| 86. | Earlington | 9.1% | 5.3%(+3.76)#86 | 4.9%(+4.22)#4,626 |
| 87. | Park City | 9.1% | 5.3%(+3.76)#87 | 4.9%(+4.22)#4,634 |
| 88. | Waverly | 9.1% | 5.3%(+3.76)#88 | 4.9%(+4.22)#4,653 |
| 89. | Thornhill | 9.1% | 5.3%(+3.76)#89 | 4.9%(+4.22)#4,673 |
| 90. | Brownsboro Village | 9.0% | 5.3%(+3.68)#90 | 4.9%(+4.14)#4,726 |
| 91. | Blue Ridge Manor | 8.9% | 5.3%(+3.59)#91 | 4.9%(+4.05)#4,801 |
| 92. | Madisonville | 8.9% | 5.3%(+3.54)#92 | 4.9%(+4.00)#4,835 |
| 93. | Inez | 8.8% | 5.3%(+3.47)#93 | 4.9%(+3.93)#4,879 |
| 94. | Sonora | 8.7% | 5.3%(+3.37)#94 | 4.9%(+3.82)#4,972 |
| 95. | Calvert City | 8.6% | 5.3%(+3.29)#95 | 4.9%(+3.75)#5,038 |
| 96. | Junction City | 8.6% | 5.3%(+3.29)#96 | 4.9%(+3.75)#5,039 |
| 97. | Kevil | 8.6% | 5.3%(+3.24)#97 | 4.9%(+3.70)#5,077 |
| 98. | Hills And Dales | 8.5% | 5.3%(+3.21)#98 | 4.9%(+3.66)#5,107 |
| 99. | Taylor Mill | 8.5% | 5.3%(+3.19)#99 | 4.9%(+3.65)#5,125 |
| 100. | Knottsville | 8.5% | 5.3%(+3.18)#100 | 4.9%(+3.64)#5,139 |
Common Questions
What are the Top 10 Cities with the Highest Percentage of Population with a Degree in Liberal Arts and History in Kentucky?
Top 10 Cities with the Highest Percentage of Population with a Degree in Liberal Arts and History in Kentucky are:
#1
66.7%
#2
60.0%
#3
55.6%
#4
50.0%
#5
50.0%
#6
50.0%
#7
36.0%
#8
34.4%
#9
32.9%
#10
30.6%
What city has the Highest Percentage of Population with a Degree in Liberal Arts and History in Kentucky?
Ekron has the Highest Percentage of Population with a Degree in Liberal Arts and History in Kentucky with 66.7%.
What is the Percentage of Population with a Degree in Liberal Arts and History in the State of Kentucky?
Percentage of Population with a Degree in Liberal Arts and History in Kentucky is 5.3%.
What is the Percentage of Population with a Degree in Liberal Arts and History in the United States?
Percentage of Population with a Degree in Liberal Arts and History in the United States is 4.9%.