Camp Pendleton South, CA Map & Demographics
Camp Pendleton South Map
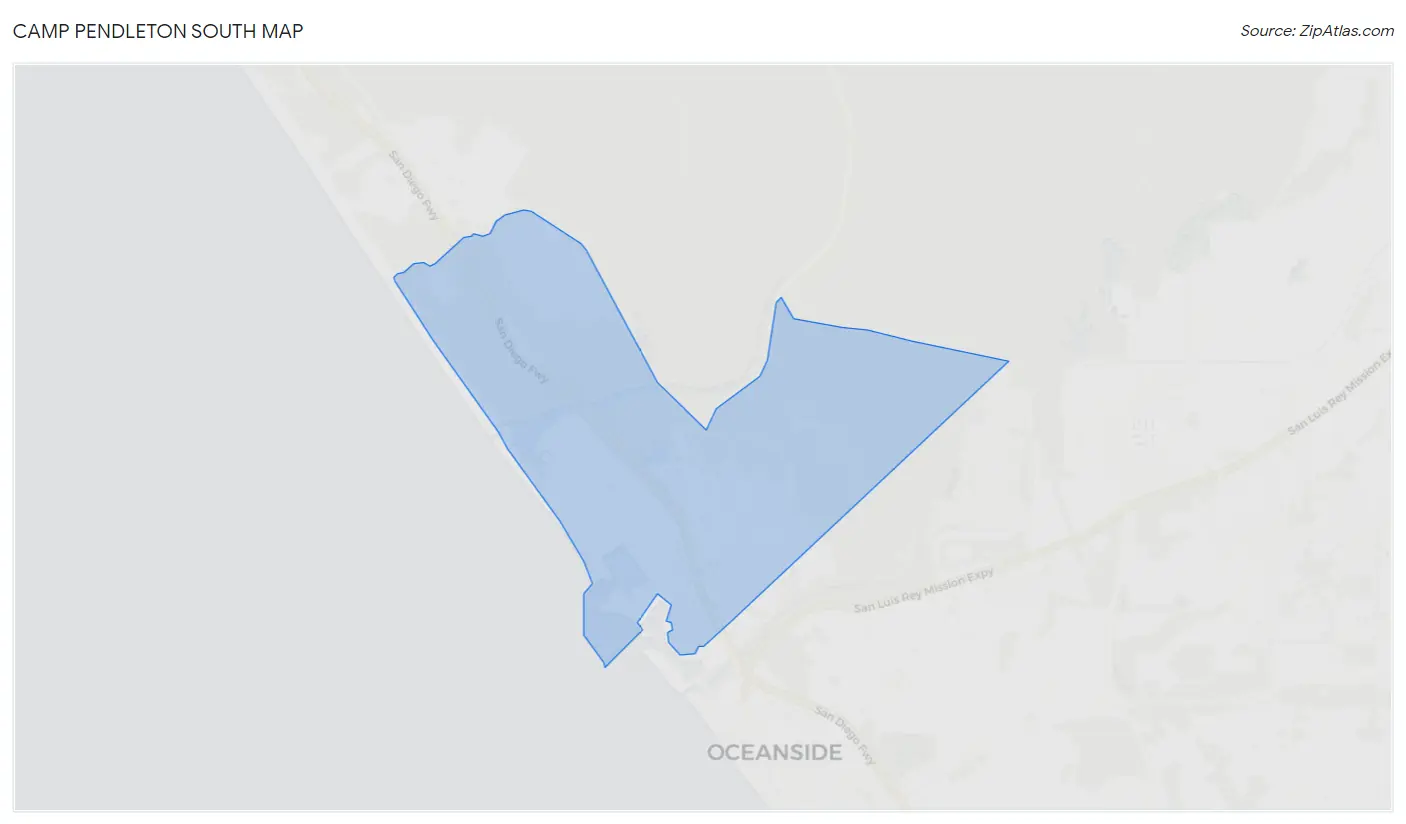
Camp Pendleton South Overview
$23,059
PER CAPITA INCOME
$63,086
AVG FAMILY INCOME
$62,020
AVG HOUSEHOLD INCOME
43.0%
WAGE / INCOME GAP [ % ]
57.0¢/ $1
WAGE / INCOME GAP [ $ ]
0.31
INEQUALITY / GINI INDEX
13,936
TOTAL POPULATION
7,434
MALE POPULATION
6,502
FEMALE POPULATION
114.33
MALES / 100 FEMALES
87.46
FEMALES / 100 MALES
23.0
MEDIAN AGE
3.2
AVG FAMILY SIZE
3.1
AVG HOUSEHOLD SIZE
7,340
LABOR FORCE [ PEOPLE ]
79.7%
PERCENT IN LABOR FORCE
19.6%
UNEMPLOYMENT RATE
Income in Camp Pendleton South
Income Overview in Camp Pendleton South
Per Capita Income in Camp Pendleton South is $23,059, while median incomes of families and households are $63,086 and $62,020 respectively.
| Characteristic | Number | Measure |
| Per Capita Income | 13,936 | $23,059 |
| Median Family Income | 3,980 | $63,086 |
| Mean Family Income | 3,980 | $71,579 |
| Median Household Income | 4,250 | $62,020 |
| Mean Household Income | 4,250 | $69,697 |
| Income Deficit | 3,980 | $0 |
| Wage / Income Gap (%) | 13,936 | 43.01% |
| Wage / Income Gap ($) | 13,936 | 56.99¢ per $1 |
| Gini / Inequality Index | 13,936 | 0.31 |
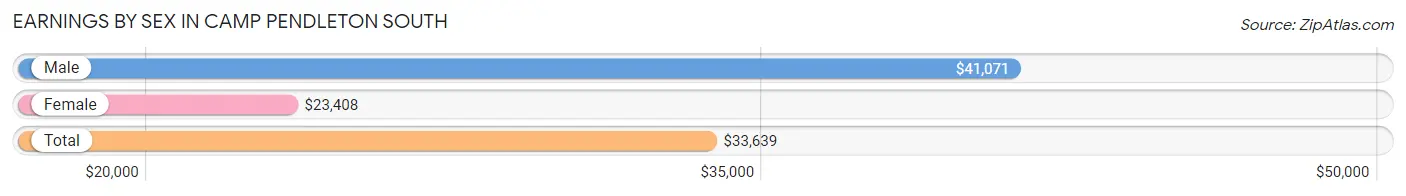
Earnings by Sex in Camp Pendleton South
Average Earnings in Camp Pendleton South are $33,639, $41,071 for men and $23,408 for women, a difference of 43.0%.
| Sex | Number | Average Earnings |
| Male | 4,800 (66.1%) | $41,071 |
| Female | 2,464 (33.9%) | $23,408 |
| Total | 7,264 (100.0%) | $33,639 |
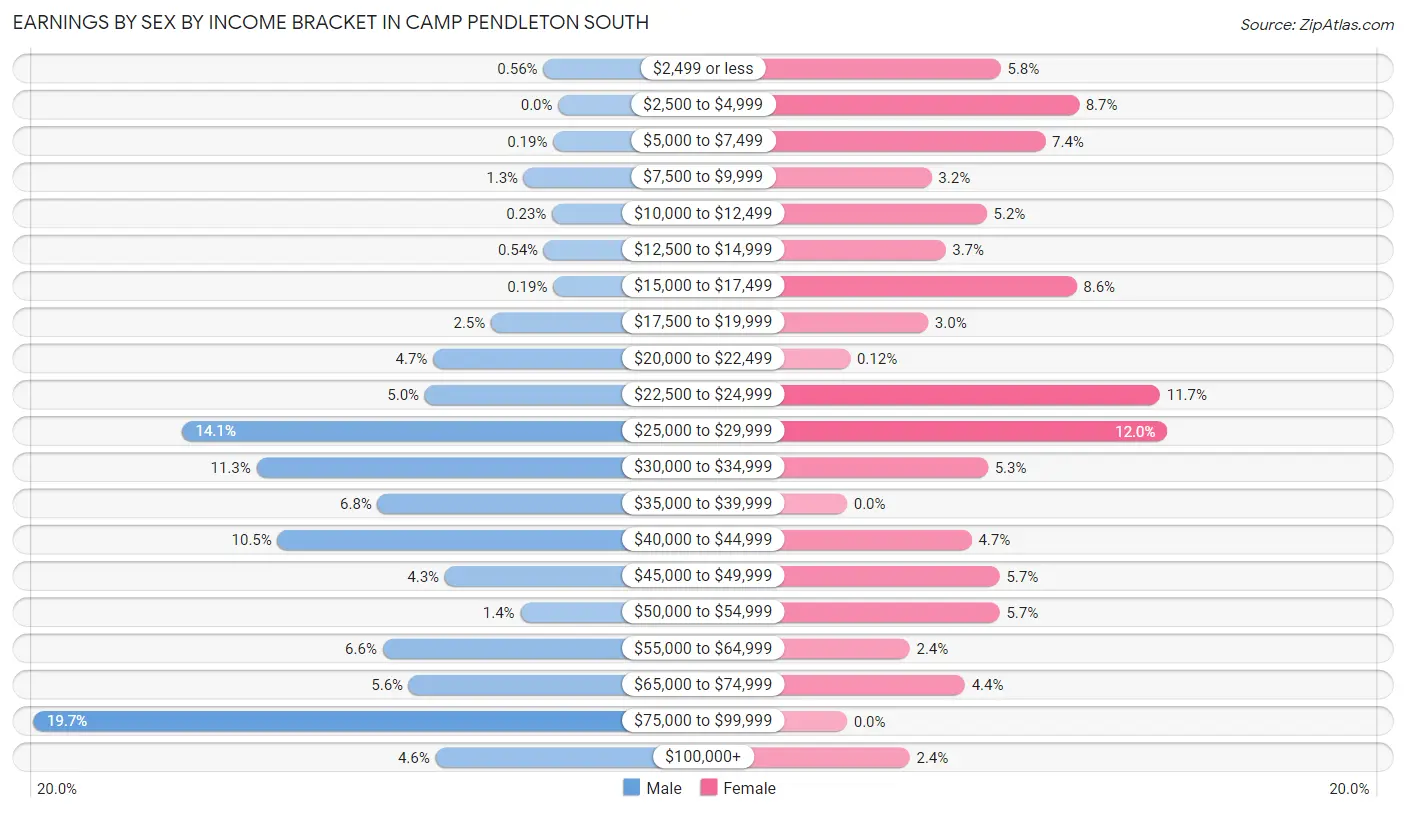
Earnings by Sex by Income Bracket in Camp Pendleton South
The most common earnings brackets in Camp Pendleton South are $75,000 to $99,999 for men (943 | 19.7%) and $25,000 to $29,999 for women (296 | 12.0%).
| Income | Male | Female |
| $2,499 or less | 27 (0.6%) | 142 (5.8%) |
| $2,500 to $4,999 | 0 (0.0%) | 214 (8.7%) |
| $5,000 to $7,499 | 9 (0.2%) | 183 (7.4%) |
| $7,500 to $9,999 | 62 (1.3%) | 78 (3.2%) |
| $10,000 to $12,499 | 11 (0.2%) | 129 (5.2%) |
| $12,500 to $14,999 | 26 (0.5%) | 91 (3.7%) |
| $15,000 to $17,499 | 9 (0.2%) | 212 (8.6%) |
| $17,500 to $19,999 | 121 (2.5%) | 75 (3.0%) |
| $20,000 to $22,499 | 225 (4.7%) | 3 (0.1%) |
| $22,500 to $24,999 | 240 (5.0%) | 289 (11.7%) |
| $25,000 to $29,999 | 676 (14.1%) | 296 (12.0%) |
| $30,000 to $34,999 | 543 (11.3%) | 130 (5.3%) |
| $35,000 to $39,999 | 325 (6.8%) | 0 (0.0%) |
| $40,000 to $44,999 | 505 (10.5%) | 115 (4.7%) |
| $45,000 to $49,999 | 204 (4.3%) | 141 (5.7%) |
| $50,000 to $54,999 | 68 (1.4%) | 141 (5.7%) |
| $55,000 to $64,999 | 316 (6.6%) | 58 (2.4%) |
| $65,000 to $74,999 | 269 (5.6%) | 109 (4.4%) |
| $75,000 to $99,999 | 943 (19.7%) | 0 (0.0%) |
| $100,000+ | 221 (4.6%) | 58 (2.4%) |
| Total | 4,800 (100.0%) | 2,464 (100.0%) |
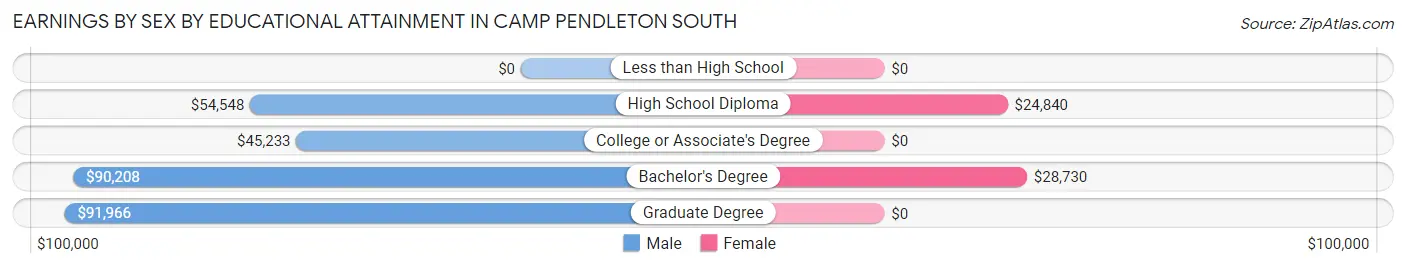
Earnings by Sex by Educational Attainment in Camp Pendleton South
Average earnings in Camp Pendleton South are $63,164 for men and $24,089 for women, a difference of 61.9%. Men with an educational attainment of graduate degree enjoy the highest average annual earnings of $91,966, while those with college or associate's degree education earn the least with $45,233. Women with an educational attainment of bachelor's degree earn the most with the average annual earnings of $28,730, while those with high school diploma education have the smallest earnings of $24,840.
| Educational Attainment | Male Income | Female Income |
| Less than High School | - | - |
| High School Diploma | $54,548 | $24,840 |
| College or Associate's Degree | $45,233 | $0 |
| Bachelor's Degree | $90,208 | $28,730 |
| Graduate Degree | $91,966 | $0 |
| Total | $63,164 | $24,089 |
Family Income in Camp Pendleton South
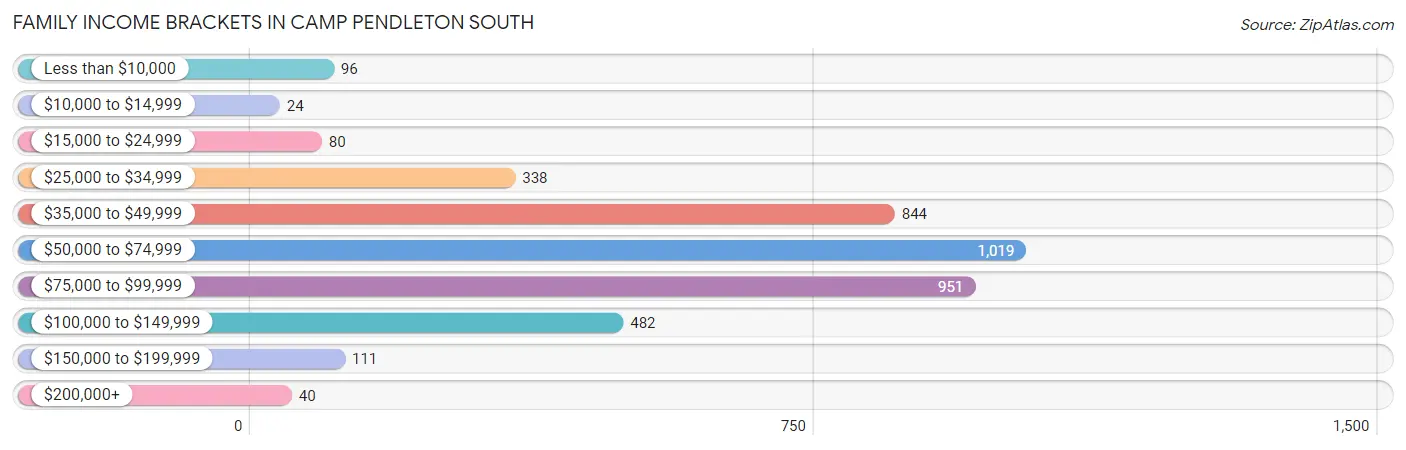
Family Income Brackets in Camp Pendleton South
According to the Camp Pendleton South family income data, there are 1,019 families falling into the $50,000 to $74,999 income range, which is the most common income bracket and makes up 25.6% of all families. Conversely, the $10,000 to $14,999 income bracket is the least frequent group with only 24 families (0.6%) belonging to this category.
| Income Bracket | # Families | % Families |
| Less than $10,000 | 96 | 2.4% |
| $10,000 to $14,999 | 24 | 0.6% |
| $15,000 to $24,999 | 80 | 2.0% |
| $25,000 to $34,999 | 338 | 8.5% |
| $35,000 to $49,999 | 844 | 21.2% |
| $50,000 to $74,999 | 1,019 | 25.6% |
| $75,000 to $99,999 | 951 | 23.9% |
| $100,000 to $149,999 | 482 | 12.1% |
| $150,000 to $199,999 | 111 | 2.8% |
| $200,000+ | 40 | 1.0% |
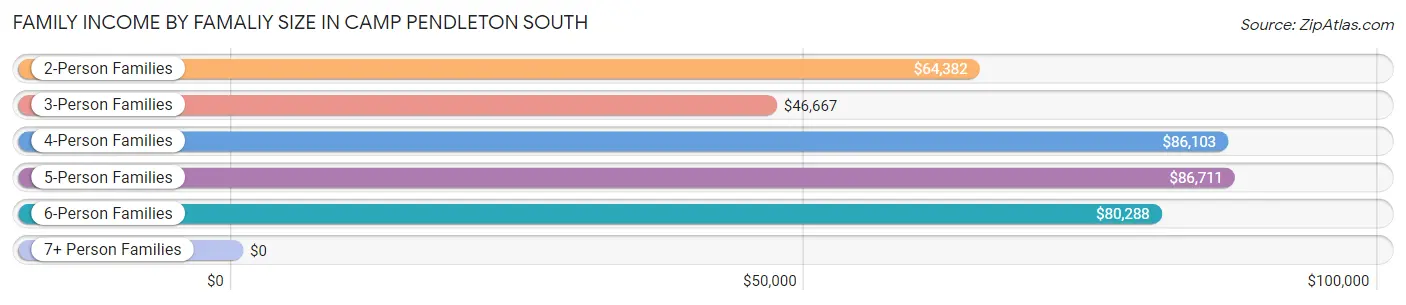
Family Income by Famaliy Size in Camp Pendleton South
5-person families (430 | 10.8%) account for the highest median family income in Camp Pendleton South with $86,711 per family, while 2-person families (1,473 | 37.0%) have the highest median income of $32,191 per family member.
| Income Bracket | # Families | Median Income |
| 2-Person Families | 1,473 (37.0%) | $64,382 |
| 3-Person Families | 1,126 (28.3%) | $46,667 |
| 4-Person Families | 617 (15.5%) | $86,103 |
| 5-Person Families | 430 (10.8%) | $86,711 |
| 6-Person Families | 334 (8.4%) | $80,288 |
| 7+ Person Families | 0 (0.0%) | $0 |
| Total | 3,980 (100.0%) | $63,086 |
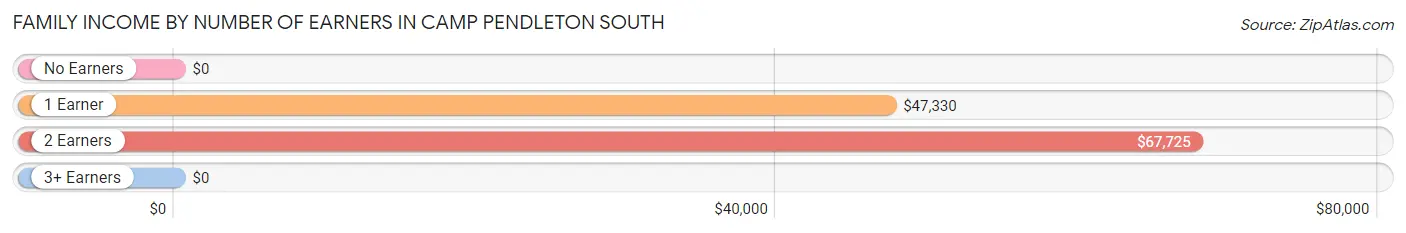
Family Income by Number of Earners in Camp Pendleton South
| Number of Earners | # Families | Median Income |
| No Earners | 96 (2.4%) | $0 |
| 1 Earner | 1,628 (40.9%) | $47,330 |
| 2 Earners | 2,256 (56.7%) | $67,725 |
| 3+ Earners | 0 (0.0%) | $0 |
| Total | 3,980 (100.0%) | $63,086 |
Household Income in Camp Pendleton South
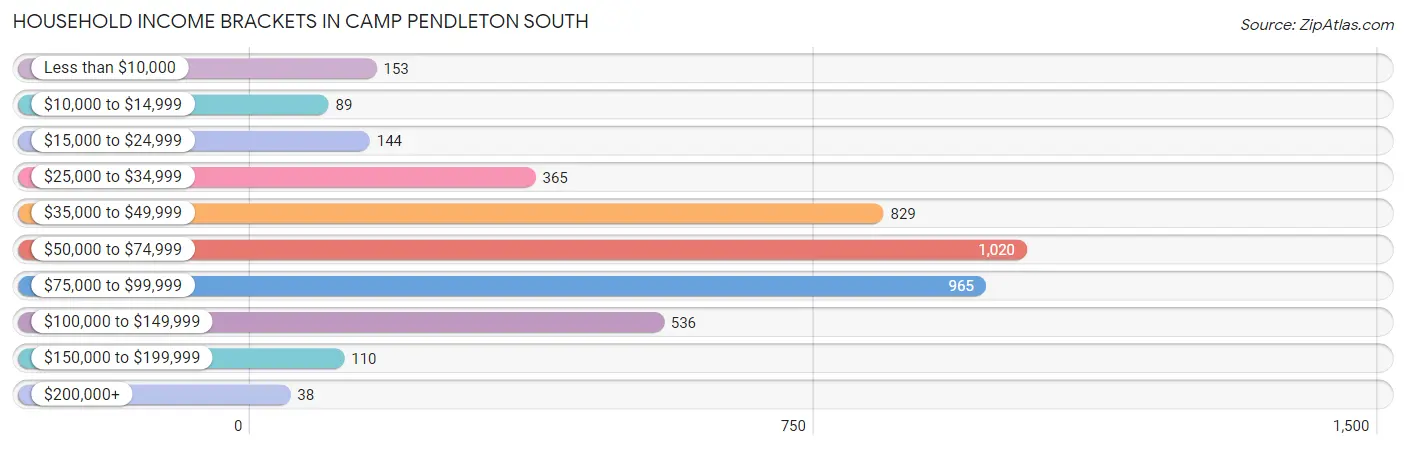
Household Income Brackets in Camp Pendleton South
With 1,020 households falling in the category, the $50,000 to $74,999 income range is the most frequent in Camp Pendleton South, accounting for 24.0% of all households. In contrast, only 38 households (0.9%) fall into the $200,000+ income bracket, making it the least populous group.
| Income Bracket | # Households | % Households |
| Less than $10,000 | 153 | 3.6% |
| $10,000 to $14,999 | 89 | 2.1% |
| $15,000 to $24,999 | 144 | 3.4% |
| $25,000 to $34,999 | 365 | 8.6% |
| $35,000 to $49,999 | 829 | 19.5% |
| $50,000 to $74,999 | 1,020 | 24.0% |
| $75,000 to $99,999 | 965 | 22.7% |
| $100,000 to $149,999 | 536 | 12.6% |
| $150,000 to $199,999 | 110 | 2.6% |
| $200,000+ | 38 | 0.9% |
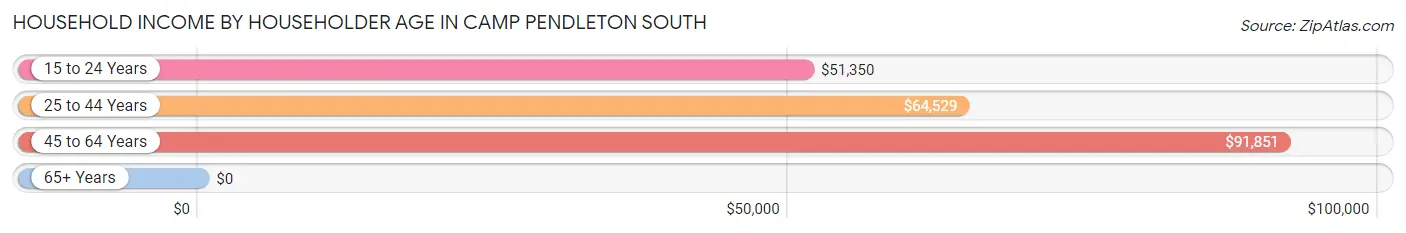
Household Income by Householder Age in Camp Pendleton South
The median household income in Camp Pendleton South is $62,020, with the highest median household income of $91,851 found in the 45 to 64 years age bracket for the primary householder. A total of 135 households (3.2%) fall into this category.
| Income Bracket | # Households | Median Income |
| 15 to 24 Years | 1,359 (32.0%) | $51,350 |
| 25 to 44 Years | 2,756 (64.8%) | $64,529 |
| 45 to 64 Years | 135 (3.2%) | $91,851 |
| 65+ Years | 0 (0.0%) | $0 |
| Total | 4,250 (100.0%) | $62,020 |
Poverty in Camp Pendleton South
Income Below Poverty by Sex and Age in Camp Pendleton South
With 7.9% poverty level for males and 8.9% for females among the residents of Camp Pendleton South, 15 year old males and 45 to 54 year old females are the most vulnerable to poverty, with 60 males (100.0%) and 52 females (45.2%) in their respective age groups living below the poverty level.
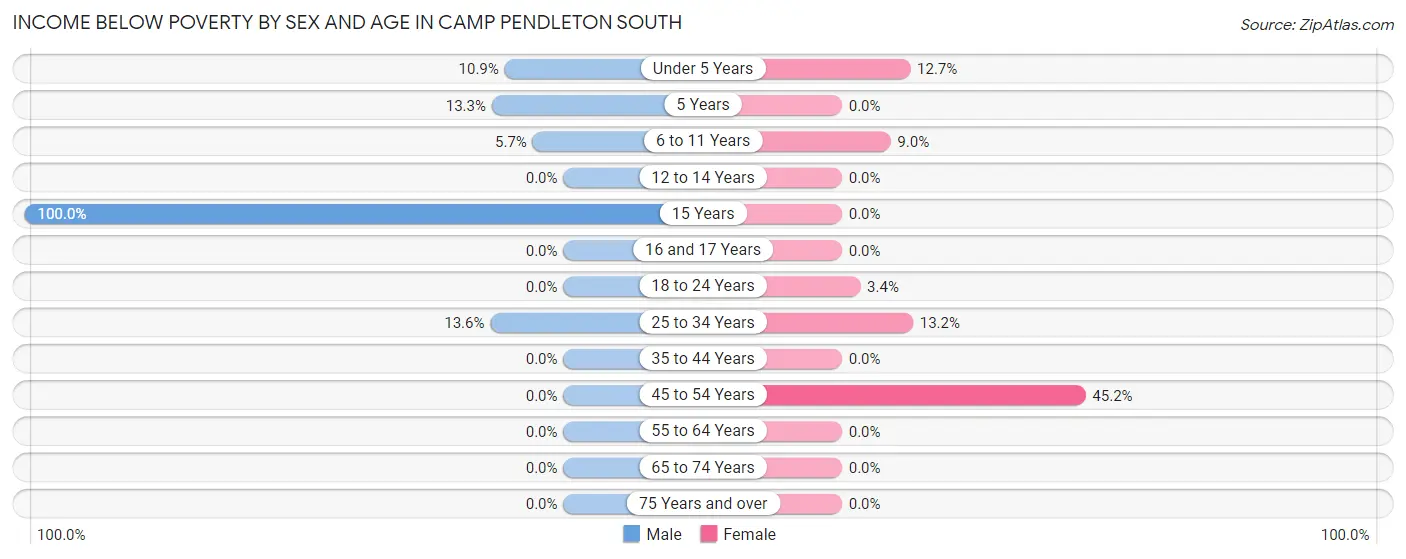
| Age Bracket | Male | Female |
| Under 5 Years | 119 (10.9%) | 166 (12.7%) |
| 5 Years | 49 (13.3%) | 0 (0.0%) |
| 6 to 11 Years | 41 (5.7%) | 60 (9.0%) |
| 12 to 14 Years | 0 (0.0%) | 0 (0.0%) |
| 15 Years | 60 (100.0%) | 0 (0.0%) |
| 16 and 17 Years | 0 (0.0%) | 0 (0.0%) |
| 18 to 24 Years | 0 (0.0%) | 45 (3.4%) |
| 25 to 34 Years | 250 (13.6%) | 253 (13.2%) |
| 35 to 44 Years | 0 (0.0%) | 0 (0.0%) |
| 45 to 54 Years | 0 (0.0%) | 52 (45.2%) |
| 55 to 64 Years | 0 (0.0%) | 0 (0.0%) |
| 65 to 74 Years | 0 (0.0%) | 0 (0.0%) |
| 75 Years and over | 0 (0.0%) | 0 (0.0%) |
| Total | 519 (7.9%) | 576 (8.9%) |
Income Above Poverty by Sex and Age in Camp Pendleton South
According to the poverty statistics in Camp Pendleton South, males aged 12 to 14 years and females aged 5 years are the age groups that are most secure financially, with 100.0% of males and 100.0% of females in these age groups living above the poverty line.
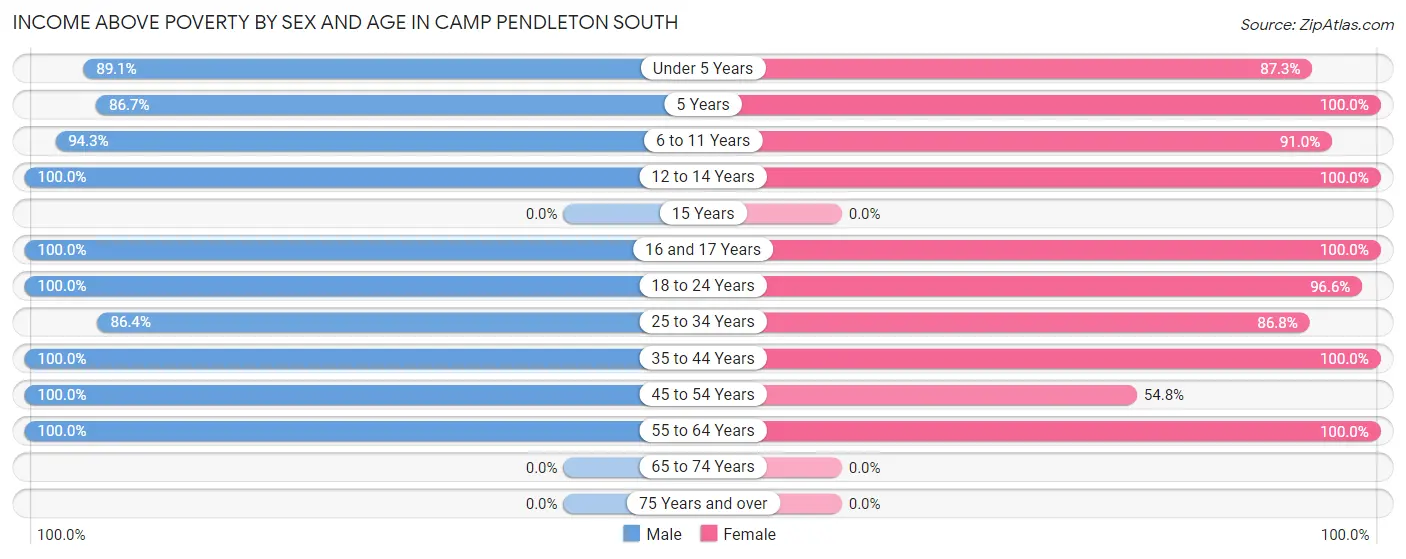
| Age Bracket | Male | Female |
| Under 5 Years | 973 (89.1%) | 1,143 (87.3%) |
| 5 Years | 320 (86.7%) | 149 (100.0%) |
| 6 to 11 Years | 680 (94.3%) | 605 (91.0%) |
| 12 to 14 Years | 100 (100.0%) | 262 (100.0%) |
| 15 Years | 0 (0.0%) | 0 (0.0%) |
| 16 and 17 Years | 102 (100.0%) | 60 (100.0%) |
| 18 to 24 Years | 1,398 (100.0%) | 1,274 (96.6%) |
| 25 to 34 Years | 1,594 (86.4%) | 1,666 (86.8%) |
| 35 to 44 Years | 850 (100.0%) | 595 (100.0%) |
| 45 to 54 Years | 52 (100.0%) | 63 (54.8%) |
| 55 to 64 Years | 20 (100.0%) | 76 (100.0%) |
| 65 to 74 Years | 0 (0.0%) | 0 (0.0%) |
| 75 Years and over | 0 (0.0%) | 0 (0.0%) |
| Total | 6,089 (92.1%) | 5,893 (91.1%) |
Income Below Poverty Among Married-Couple Families in Camp Pendleton South
The poverty statistics for married-couple families in Camp Pendleton South show that 5.0% or 193 of the total 3,874 families live below the poverty line. Families with 1 or 2 children have the highest poverty rate of 8.6%, comprising of 142 families. On the other hand, families with no children have the lowest poverty rate of 0.0%, which includes 0 families.
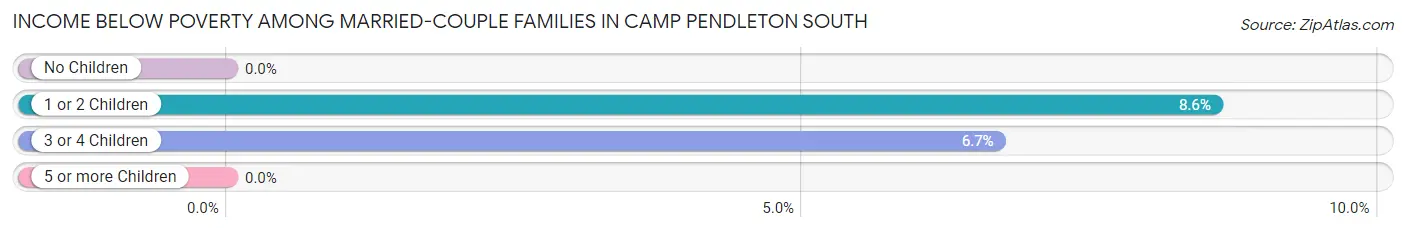
| Children | Above Poverty | Below Poverty |
| No Children | 1,453 (100.0%) | 0 (0.0%) |
| 1 or 2 Children | 1,515 (91.4%) | 142 (8.6%) |
| 3 or 4 Children | 713 (93.3%) | 51 (6.7%) |
| 5 or more Children | 0 (0.0%) | 0 (0.0%) |
| Total | 3,681 (95.0%) | 193 (5.0%) |
Income Below Poverty Among Single-Parent Households in Camp Pendleton South
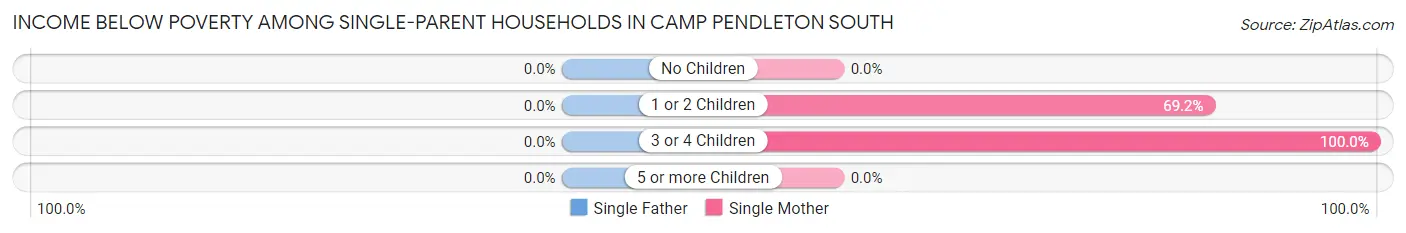
| Children | Single Father | Single Mother |
| No Children | 0 (0.0%) | 0 (0.0%) |
| 1 or 2 Children | 0 (0.0%) | 45 (69.2%) |
| 3 or 4 Children | 0 (0.0%) | 23 (100.0%) |
| 5 or more Children | 0 (0.0%) | 0 (0.0%) |
| Total | 0 (0.0%) | 68 (77.3%) |
Income Below Poverty Among Married-Couple vs Single-Parent Households in Camp Pendleton South
The poverty data for Camp Pendleton South shows that 193 of the married-couple family households (5.0%) and 68 of the single-parent households (64.1%) are living below the poverty level. Within the married-couple family households, those with 1 or 2 children have the highest poverty rate, with 142 households (8.6%) falling below the poverty line. Among the single-parent households, those with 3 or 4 children have the highest poverty rate, with 23 household (100.0%) living below poverty.
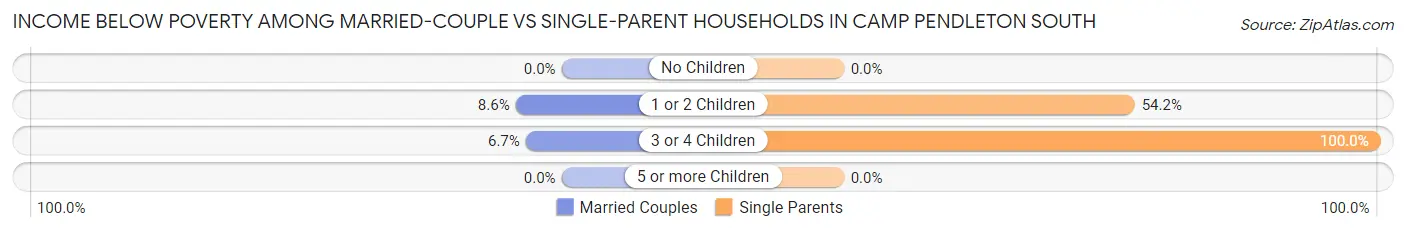
| Children | Married-Couple Families | Single-Parent Households |
| No Children | 0 (0.0%) | 0 (0.0%) |
| 1 or 2 Children | 142 (8.6%) | 45 (54.2%) |
| 3 or 4 Children | 51 (6.7%) | 23 (100.0%) |
| 5 or more Children | 0 (0.0%) | 0 (0.0%) |
| Total | 193 (5.0%) | 68 (64.1%) |
Race in Camp Pendleton South
The most populous races in Camp Pendleton South are White / Caucasian (7,700 | 55.2%), Hispanic or Latino (4,378 | 31.4%), and Two or more Races (3,331 | 23.9%).
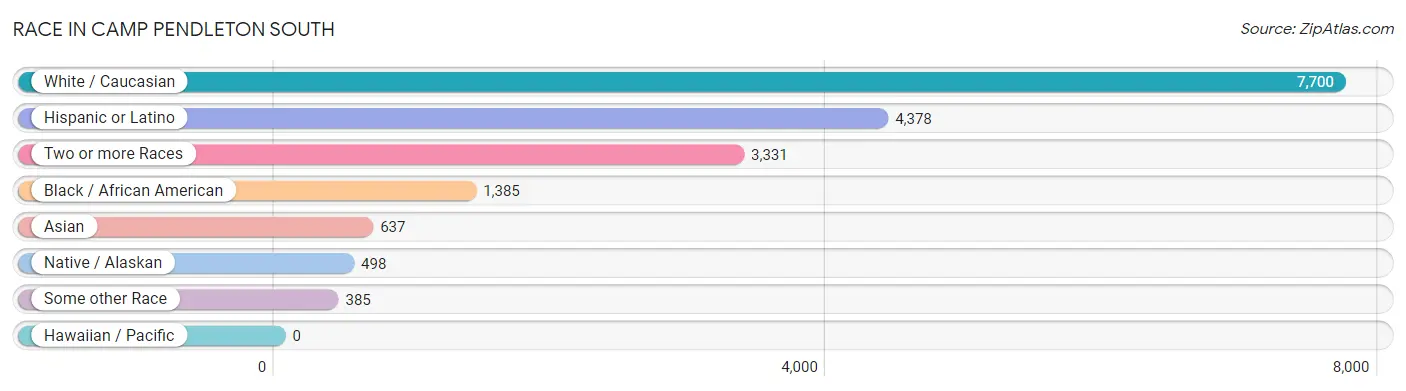
| Race | # Population | % Population |
| Asian | 637 | 4.6% |
| Black / African American | 1,385 | 9.9% |
| Hawaiian / Pacific | 0 | 0.0% |
| Hispanic or Latino | 4,378 | 31.4% |
| Native / Alaskan | 498 | 3.6% |
| White / Caucasian | 7,700 | 55.2% |
| Two or more Races | 3,331 | 23.9% |
| Some other Race | 385 | 2.8% |
| Total | 13,936 | 100.0% |
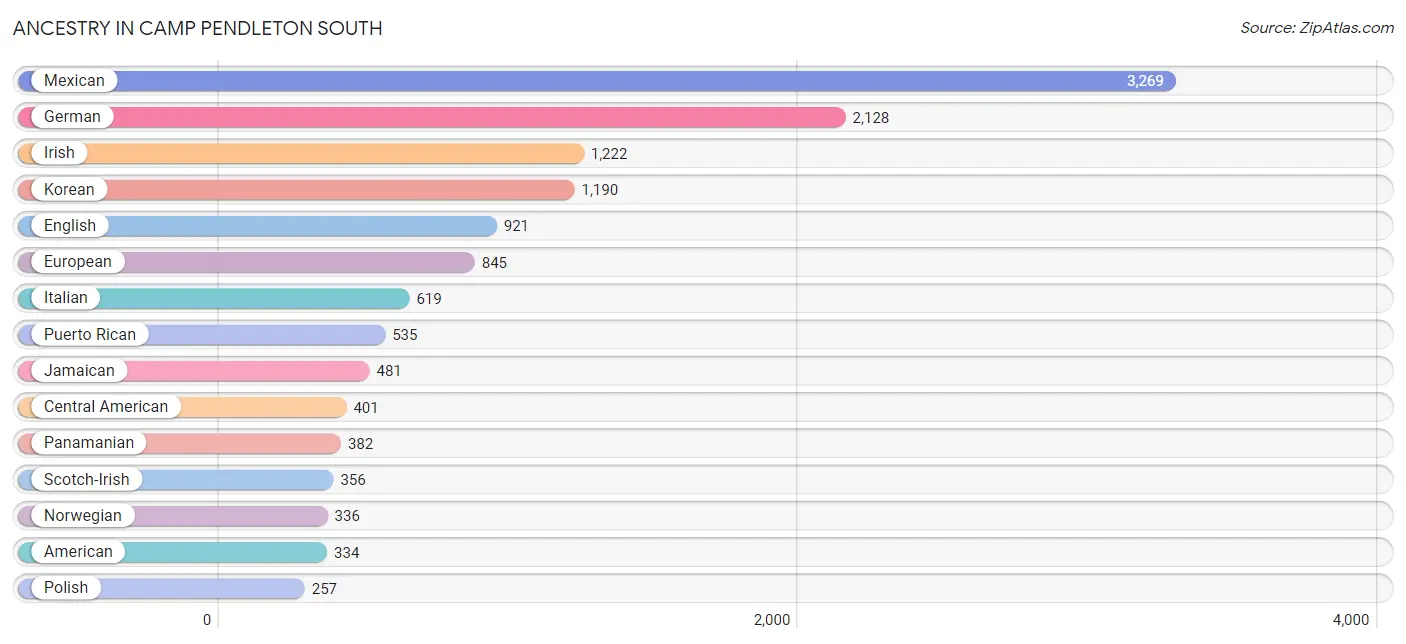
Ancestry in Camp Pendleton South
The most populous ancestries reported in Camp Pendleton South are Mexican (3,269 | 23.5%), German (2,128 | 15.3%), Irish (1,222 | 8.8%), Korean (1,190 | 8.5%), and English (921 | 6.6%), together accounting for 62.7% of all Camp Pendleton South residents.
| Ancestry | # Population | % Population |
| African | 224 | 1.6% |
| American | 334 | 2.4% |
| Apache | 8 | 0.1% |
| Arab | 7 | 0.1% |
| Bangladeshi | 54 | 0.4% |
| Bhutanese | 76 | 0.5% |
| Blackfeet | 4 | 0.0% |
| Brazilian | 5 | 0.0% |
| British | 22 | 0.2% |
| Central American | 401 | 2.9% |
| Central American Indian | 60 | 0.4% |
| Cherokee | 54 | 0.4% |
| Chickasaw | 4 | 0.0% |
| Cuban | 66 | 0.5% |
| Czech | 26 | 0.2% |
| Czechoslovakian | 47 | 0.3% |
| Dutch | 51 | 0.4% |
| English | 921 | 6.6% |
| European | 845 | 6.1% |
| French | 231 | 1.7% |
| French Canadian | 52 | 0.4% |
| German | 2,128 | 15.3% |
| Greek | 56 | 0.4% |
| Guamanian / Chamorro | 43 | 0.3% |
| Guatemalan | 3 | 0.0% |
| Hungarian | 79 | 0.6% |
| Indian (Asian) | 121 | 0.9% |
| Iranian | 36 | 0.3% |
| Irish | 1,222 | 8.8% |
| Italian | 619 | 4.4% |
| Jamaican | 481 | 3.5% |
| Kenyan | 6 | 0.0% |
| Korean | 1,190 | 8.5% |
| Lebanese | 7 | 0.1% |
| Macedonian | 7 | 0.1% |
| Malaysian | 4 | 0.0% |
| Mexican | 3,269 | 23.5% |
| Mexican American Indian | 199 | 1.4% |
| Navajo | 3 | 0.0% |
| Norwegian | 336 | 2.4% |
| Panamanian | 382 | 2.7% |
| Peruvian | 22 | 0.2% |
| Polish | 257 | 1.8% |
| Portuguese | 130 | 0.9% |
| Puerto Rican | 535 | 3.8% |
| Romanian | 94 | 0.7% |
| Russian | 95 | 0.7% |
| Salvadoran | 16 | 0.1% |
| Scandinavian | 48 | 0.3% |
| Scotch-Irish | 356 | 2.5% |
| Scottish | 121 | 0.9% |
| Slovene | 6 | 0.0% |
| South American | 22 | 0.2% |
| Spaniard | 41 | 0.3% |
| Spanish | 44 | 0.3% |
| Sri Lankan | 9 | 0.1% |
| Subsaharan African | 230 | 1.7% |
| Swedish | 15 | 0.1% |
| Trinidadian and Tobagonian | 102 | 0.7% |
| Ukrainian | 54 | 0.4% |
| Welsh | 44 | 0.3% |
| Yaqui | 70 | 0.5% | View All 62 Rows |
Immigrants in Camp Pendleton South
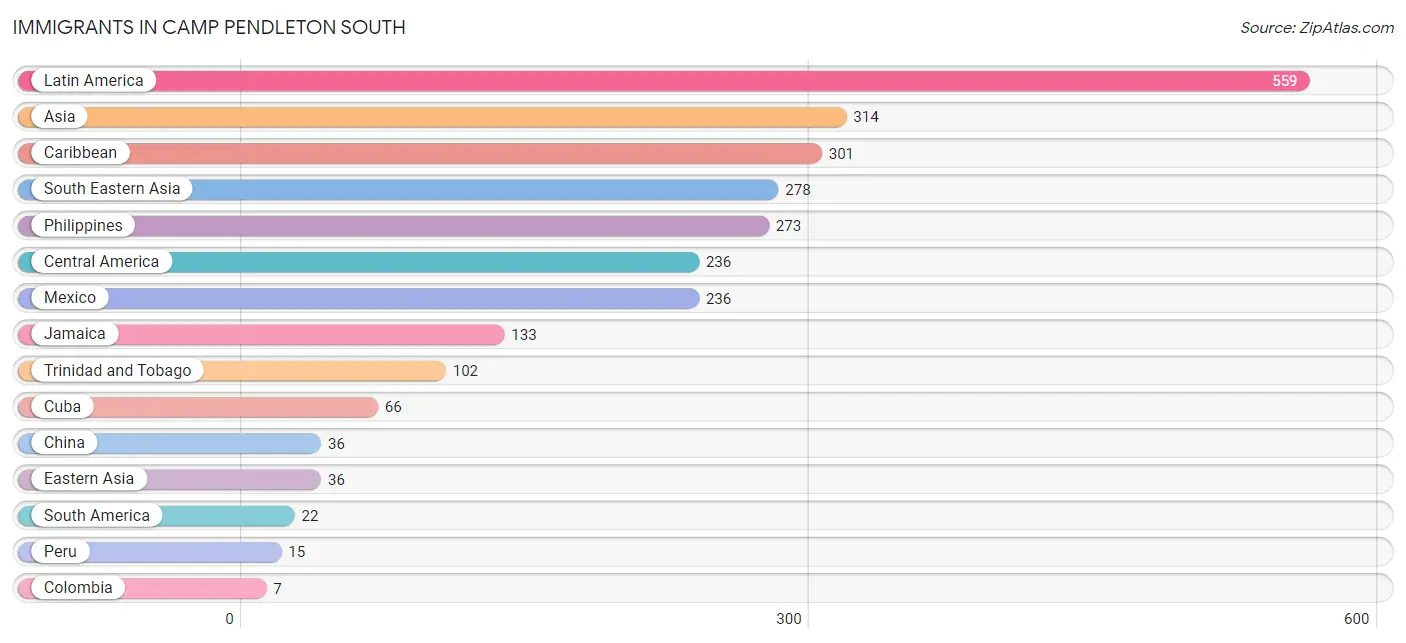
The most numerous immigrant groups reported in Camp Pendleton South came from Latin America (559 | 4.0%), Asia (314 | 2.2%), Caribbean (301 | 2.2%), South Eastern Asia (278 | 2.0%), and Philippines (273 | 2.0%), together accounting for 12.4% of all Camp Pendleton South residents.
| Immigration Origin | # Population | % Population |
| Africa | 5 | 0.0% |
| Asia | 314 | 2.2% |
| Caribbean | 301 | 2.2% |
| Central America | 236 | 1.7% |
| China | 36 | 0.3% |
| Colombia | 7 | 0.1% |
| Cuba | 66 | 0.5% |
| Eastern Asia | 36 | 0.3% |
| Eastern Europe | 3 | 0.0% |
| Europe | 3 | 0.0% |
| Jamaica | 133 | 0.9% |
| Latin America | 559 | 4.0% |
| Mexico | 236 | 1.7% |
| Nigeria | 5 | 0.0% |
| Peru | 15 | 0.1% |
| Philippines | 273 | 2.0% |
| Poland | 3 | 0.0% |
| South America | 22 | 0.2% |
| South Eastern Asia | 278 | 2.0% |
| Trinidad and Tobago | 102 | 0.7% |
| Vietnam | 5 | 0.0% |
| Western Africa | 5 | 0.0% | View All 22 Rows |
Sex and Age in Camp Pendleton South
Sex and Age in Camp Pendleton South
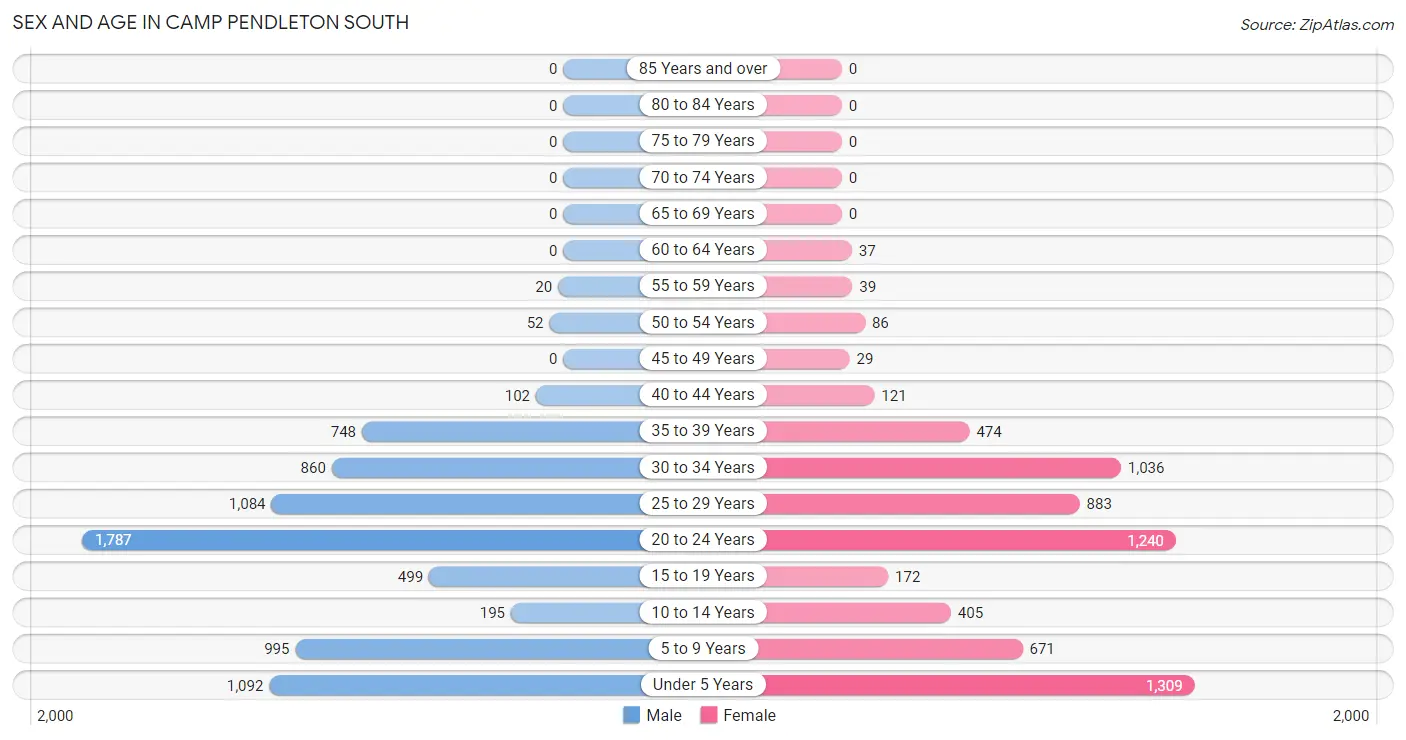
The most populous age groups in Camp Pendleton South are 20 to 24 Years (1,787 | 24.0%) for men and Under 5 Years (1,309 | 20.1%) for women.
| Age Bracket | Male | Female |
| Under 5 Years | 1,092 (14.7%) | 1,309 (20.1%) |
| 5 to 9 Years | 995 (13.4%) | 671 (10.3%) |
| 10 to 14 Years | 195 (2.6%) | 405 (6.2%) |
| 15 to 19 Years | 499 (6.7%) | 172 (2.6%) |
| 20 to 24 Years | 1,787 (24.0%) | 1,240 (19.1%) |
| 25 to 29 Years | 1,084 (14.6%) | 883 (13.6%) |
| 30 to 34 Years | 860 (11.6%) | 1,036 (15.9%) |
| 35 to 39 Years | 748 (10.1%) | 474 (7.3%) |
| 40 to 44 Years | 102 (1.4%) | 121 (1.9%) |
| 45 to 49 Years | 0 (0.0%) | 29 (0.4%) |
| 50 to 54 Years | 52 (0.7%) | 86 (1.3%) |
| 55 to 59 Years | 20 (0.3%) | 39 (0.6%) |
| 60 to 64 Years | 0 (0.0%) | 37 (0.6%) |
| 65 to 69 Years | 0 (0.0%) | 0 (0.0%) |
| 70 to 74 Years | 0 (0.0%) | 0 (0.0%) |
| 75 to 79 Years | 0 (0.0%) | 0 (0.0%) |
| 80 to 84 Years | 0 (0.0%) | 0 (0.0%) |
| 85 Years and over | 0 (0.0%) | 0 (0.0%) |
| Total | 7,434 (100.0%) | 6,502 (100.0%) |
Families and Households in Camp Pendleton South
Median Family Size in Camp Pendleton South
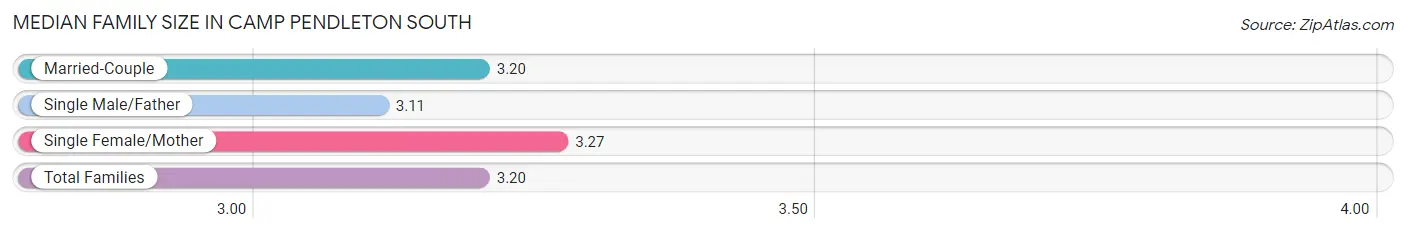
The median family size in Camp Pendleton South is 3.20 persons per family, with single female/mother families (88 | 2.2%) accounting for the largest median family size of 3.27 persons per family. On the other hand, single male/father families (18 | 0.4%) represent the smallest median family size with 3.11 persons per family.
| Family Type | # Families | Family Size |
| Married-Couple | 3,874 (97.3%) | 3.20 |
| Single Male/Father | 18 (0.4%) | 3.11 |
| Single Female/Mother | 88 (2.2%) | 3.27 |
| Total Families | 3,980 (100.0%) | 3.20 |
Median Household Size in Camp Pendleton South
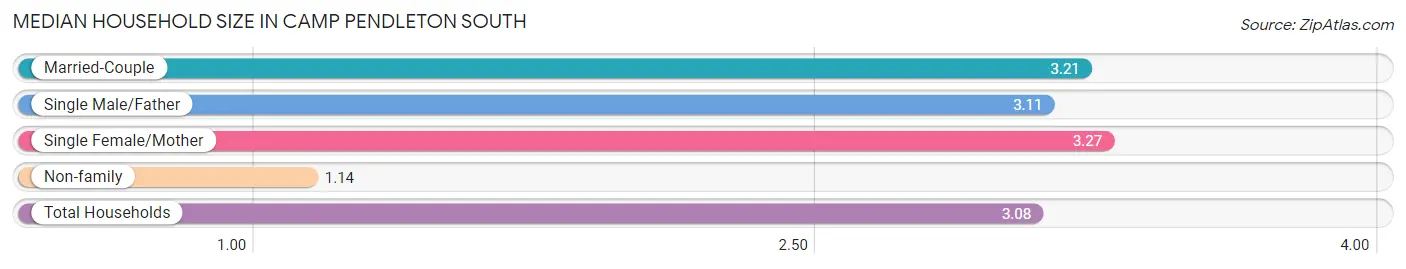
The median household size in Camp Pendleton South is 3.08 persons per household, with single female/mother households (88 | 2.1%) accounting for the largest median household size of 3.27 persons per household. non-family households (270 | 6.4%) represent the smallest median household size with 1.14 persons per household.
| Household Type | # Households | Household Size |
| Married-Couple | 3,874 (91.1%) | 3.21 |
| Single Male/Father | 18 (0.4%) | 3.11 |
| Single Female/Mother | 88 (2.1%) | 3.27 |
| Non-family | 270 (6.4%) | 1.14 |
| Total Households | 4,250 (100.0%) | 3.08 |
Household Size by Marriage Status in Camp Pendleton South
Out of a total of 4,250 households in Camp Pendleton South, 3,980 (93.6%) are family households, while 270 (6.4%) are nonfamily households. The most numerous type of family households are 2-person households, comprising 1,460, and the most common type of nonfamily households are 1-person households, comprising 236.
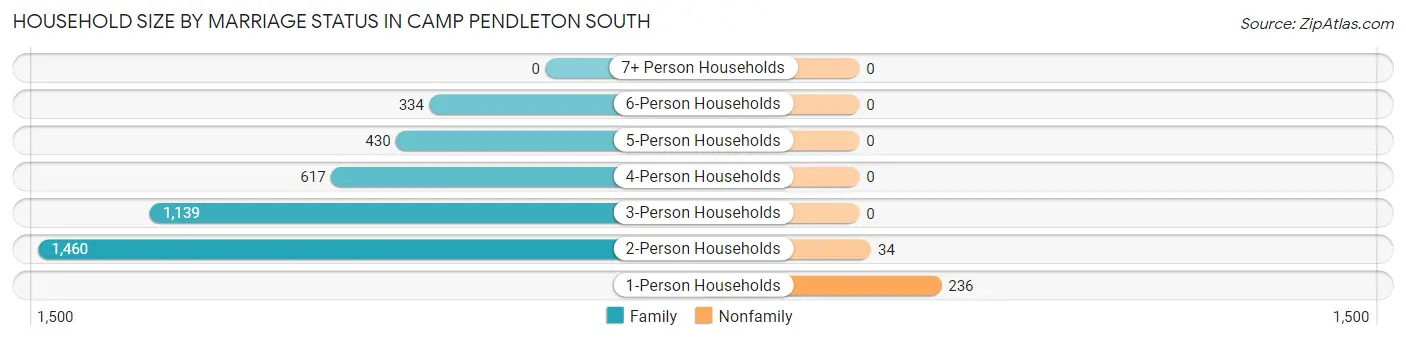
| Household Size | Family Households | Nonfamily Households |
| 1-Person Households | - | 236 (5.6%) |
| 2-Person Households | 1,460 (34.4%) | 34 (0.8%) |
| 3-Person Households | 1,139 (26.8%) | 0 (0.0%) |
| 4-Person Households | 617 (14.5%) | 0 (0.0%) |
| 5-Person Households | 430 (10.1%) | 0 (0.0%) |
| 6-Person Households | 334 (7.9%) | 0 (0.0%) |
| 7+ Person Households | 0 (0.0%) | 0 (0.0%) |
| Total | 3,980 (93.6%) | 270 (6.4%) |
Female Fertility in Camp Pendleton South
Fertility by Age in Camp Pendleton South
Average fertility rate in Camp Pendleton South is 145.0 births per 1,000 women. Women in the age bracket of 15 to 19 years have the highest fertility rate with 209.0 births per 1,000 women. Women in the age bracket of 20 to 34 years acount for 87.8% of all women with births.
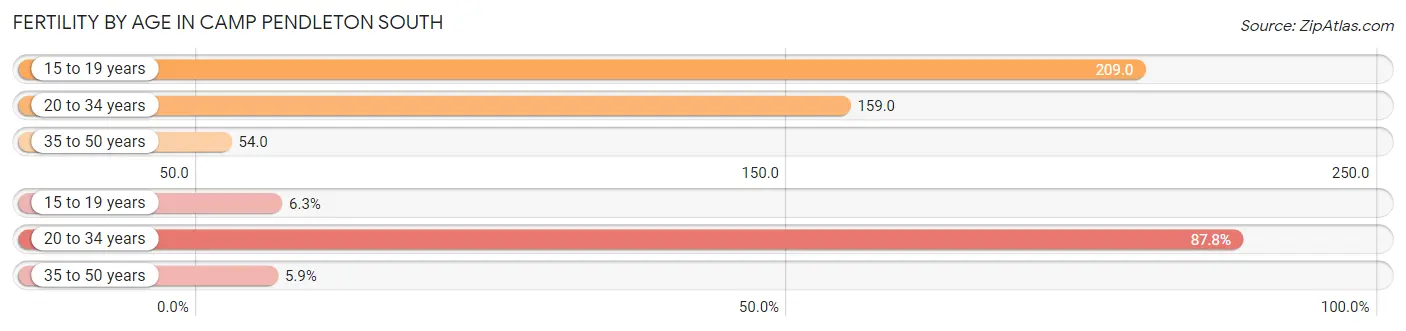
| Age Bracket | Women with Births | Births / 1,000 Women |
| 15 to 19 years | 36 (6.3%) | 209.0 |
| 20 to 34 years | 503 (87.8%) | 159.0 |
| 35 to 50 years | 34 (5.9%) | 54.0 |
| Total | 573 (100.0%) | 145.0 |
Fertility by Age by Marriage Status in Camp Pendleton South
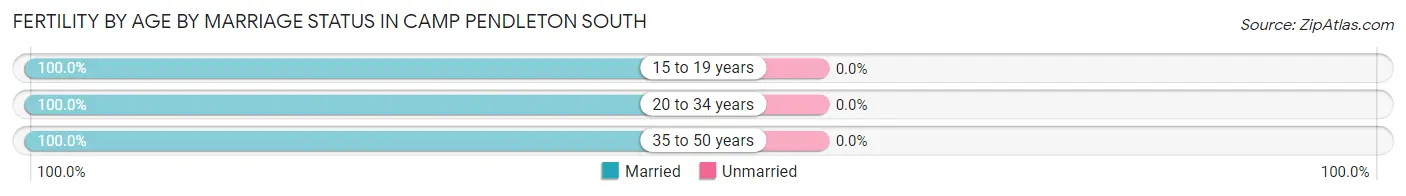
| Age Bracket | Married | Unmarried |
| 15 to 19 years | 36 (100.0%) | 0 (0.0%) |
| 20 to 34 years | 503 (100.0%) | 0 (0.0%) |
| 35 to 50 years | 34 (100.0%) | 0 (0.0%) |
| Total | 573 (100.0%) | 0 (0.0%) |
Fertility by Education in Camp Pendleton South
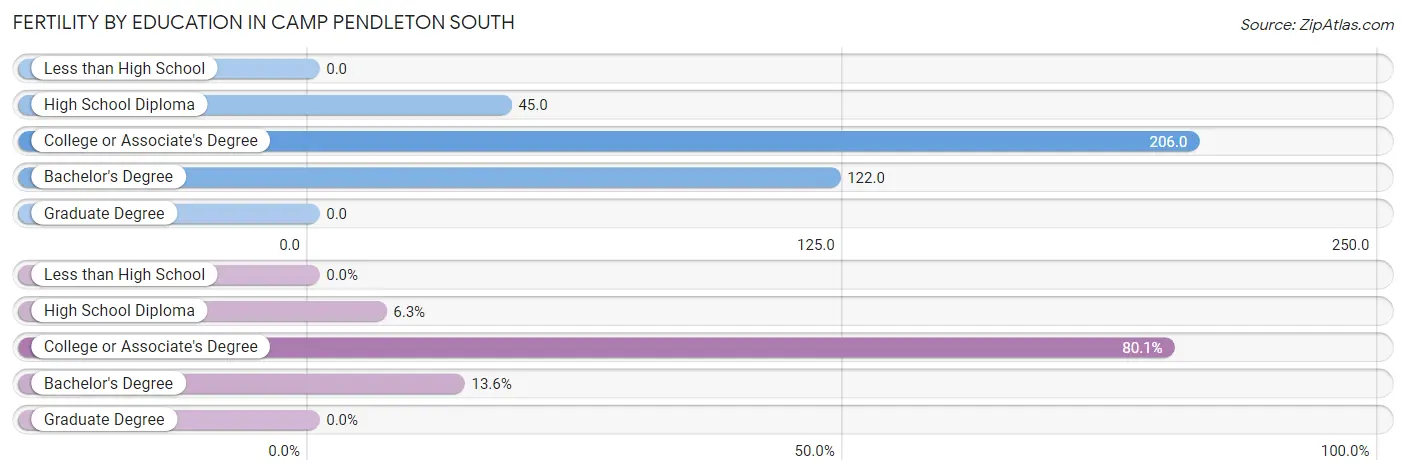
| Educational Attainment | Women with Births | Births / 1,000 Women |
| Less than High School | 0 (0.0%) | 0.0 |
| High School Diploma | 36 (6.3%) | 45.0 |
| College or Associate's Degree | 459 (80.1%) | 206.0 |
| Bachelor's Degree | 78 (13.6%) | 122.0 |
| Graduate Degree | 0 (0.0%) | 0.0 |
| Total | 573 (100.0%) | 145.0 |
Fertility by Education by Marriage Status in Camp Pendleton South
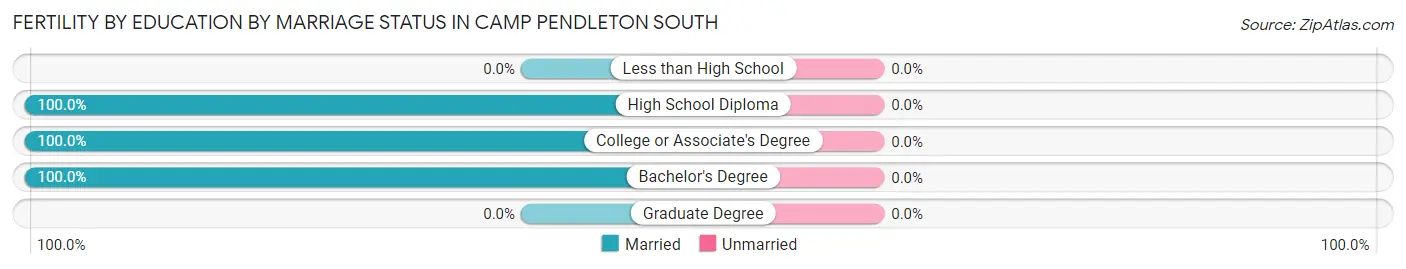
| Educational Attainment | Married | Unmarried |
| Less than High School | 0 (0.0%) | 0 (0.0%) |
| High School Diploma | 36 (100.0%) | 0 (0.0%) |
| College or Associate's Degree | 459 (100.0%) | 0 (0.0%) |
| Bachelor's Degree | 78 (100.0%) | 0 (0.0%) |
| Graduate Degree | 0 (0.0%) | 0 (0.0%) |
| Total | 573 (100.0%) | 0 (0.0%) |
Employment Characteristics in Camp Pendleton South
Employment by Class of Employer in Camp Pendleton South
Among the 6,725 employed individuals in Camp Pendleton South, federal government employees (5,021 | 74.7%), private company employees (1,107 | 16.5%), and not-for-profit organizations (290 | 4.3%) make up the most common classes of employment.
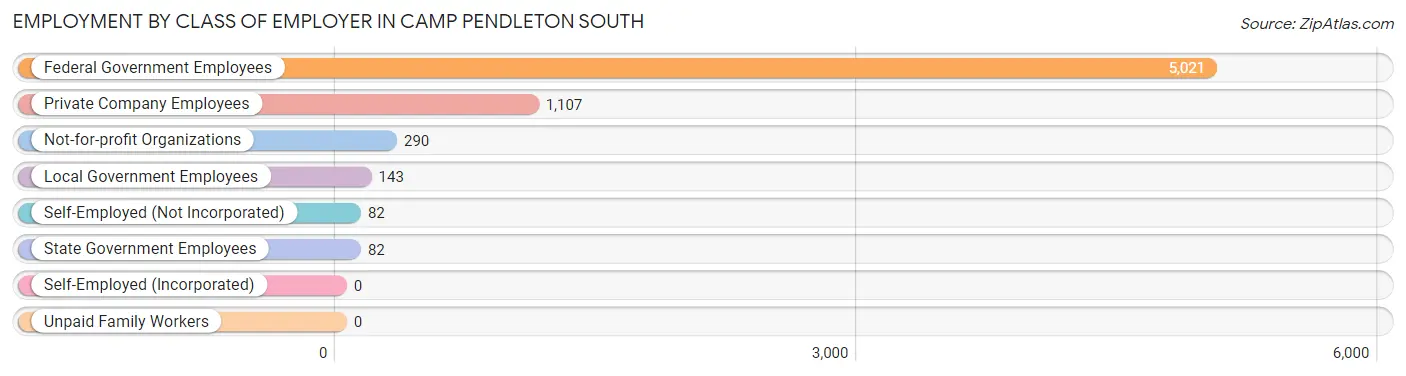
| Employer Class | # Employees | % Employees |
| Private Company Employees | 1,107 | 16.5% |
| Self-Employed (Incorporated) | 0 | 0.0% |
| Self-Employed (Not Incorporated) | 82 | 1.2% |
| Not-for-profit Organizations | 290 | 4.3% |
| Local Government Employees | 143 | 2.1% |
| State Government Employees | 82 | 1.2% |
| Federal Government Employees | 5,021 | 74.7% |
| Unpaid Family Workers | 0 | 0.0% |
| Total | 6,725 | 100.0% |
Employment Status by Age in Camp Pendleton South
According to the labor force statistics for Camp Pendleton South, out of the total population over 16 years of age (9,209), 79.7% or 7,340 individuals are in the labor force, with 19.6% or 1,439 of them unemployed. The age group with the highest labor force participation rate is 60 to 64 years, with 100.0% or 37 individuals in the labor force. Within the labor force, the 30 to 34 years age range has the highest percentage of unemployed individuals, with 37.4% or 511 of them being unemployed.
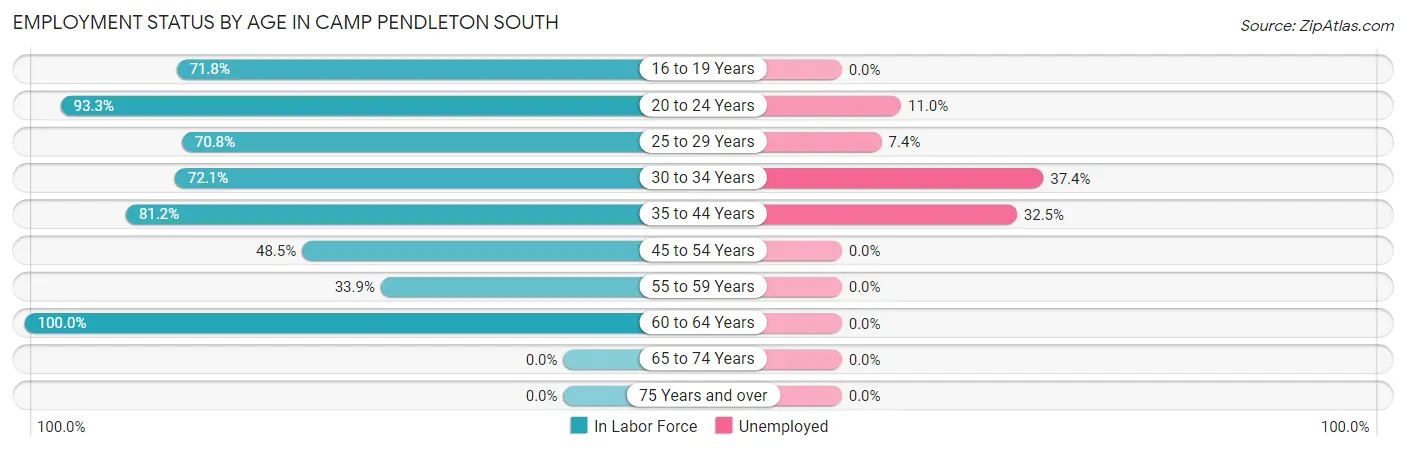
| Age Bracket | In Labor Force | Unemployed |
| 16 to 19 Years | 439 (71.8%) | 0 (0.0%) |
| 20 to 24 Years | 2,824 (93.3%) | 311 (11.0%) |
| 25 to 29 Years | 1,393 (70.8%) | 103 (7.4%) |
| 30 to 34 Years | 1,367 (72.1%) | 511 (37.4%) |
| 35 to 44 Years | 1,173 (81.2%) | 381 (32.5%) |
| 45 to 54 Years | 81 (48.5%) | 0 (0.0%) |
| 55 to 59 Years | 20 (33.9%) | 0 (0.0%) |
| 60 to 64 Years | 37 (100.0%) | 0 (0.0%) |
| 65 to 74 Years | 0 (0.0%) | 0 (0.0%) |
| 75 Years and over | 0 (0.0%) | 0 (0.0%) |
| Total | 7,340 (79.7%) | 1,439 (19.6%) |
Employment Status by Educational Attainment in Camp Pendleton South
According to labor force statistics for Camp Pendleton South, 73.1% of individuals (4,072) out of the total population between 25 and 64 years of age (5,571) are in the labor force, with 27.0% or 1,099 of them being unemployed. The group with the highest labor force participation rate are those with the educational attainment of bachelor's degree or higher, with 80.2% or 1,197 individuals in the labor force. Within the labor force, individuals with college / associate degree education have the highest percentage of unemployment, with 33.8% or 603 of them being unemployed.
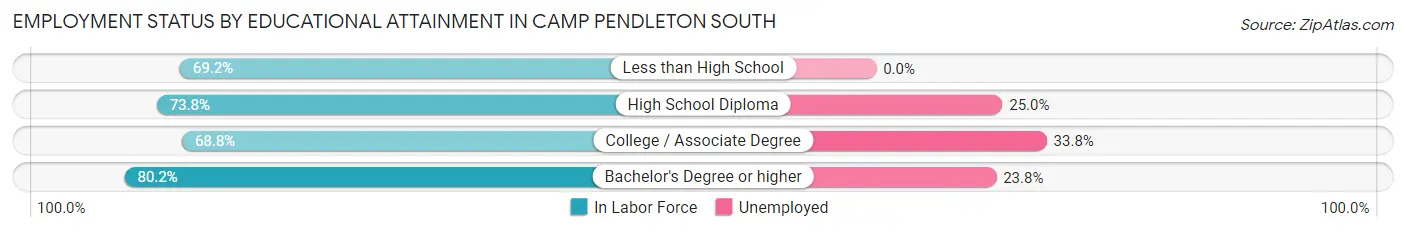
| Educational Attainment | In Labor Force | Unemployed |
| Less than High School | 74 (69.2%) | 0 (0.0%) |
| High School Diploma | 1,018 (73.8%) | 345 (25.0%) |
| College / Associate Degree | 1,784 (68.8%) | 876 (33.8%) |
| Bachelor's Degree or higher | 1,197 (80.2%) | 355 (23.8%) |
| Total | 4,072 (73.1%) | 1,504 (27.0%) |
Employment Occupations by Sex in Camp Pendleton South
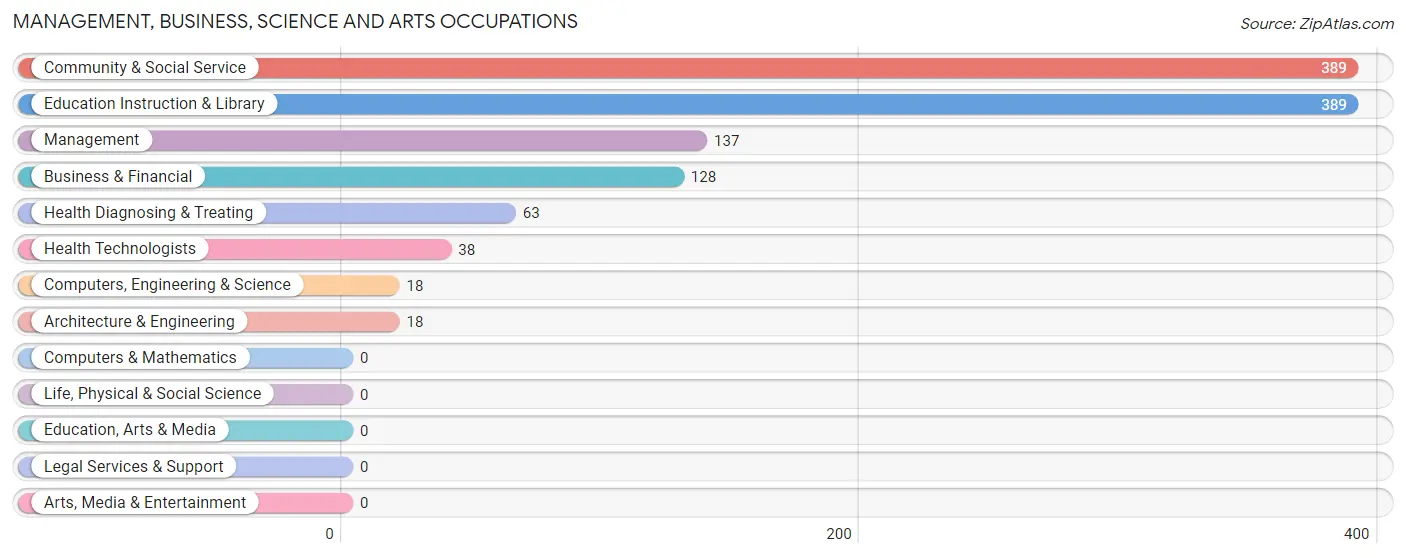
Management, Business, Science and Arts Occupations
The most common Management, Business, Science and Arts occupations in Camp Pendleton South are Community & Social Service (389 | 18.3%), Education Instruction & Library (389 | 18.3%), Management (137 | 6.4%), Business & Financial (128 | 6.0%), and Health Diagnosing & Treating (63 | 3.0%).
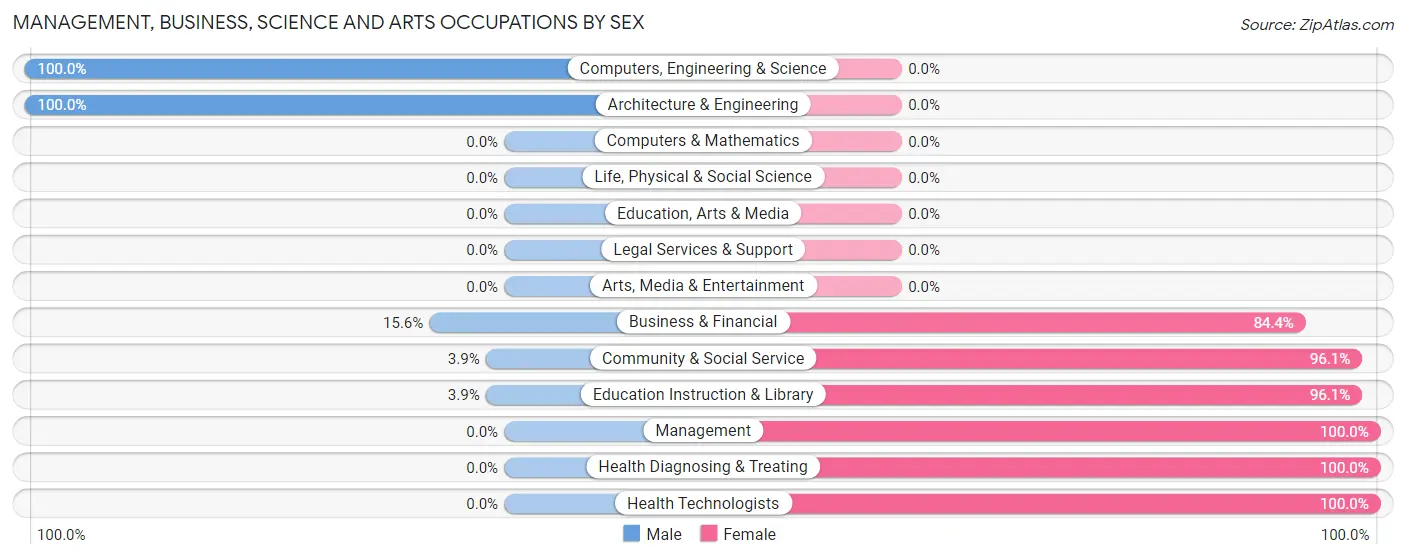
Management, Business, Science and Arts Occupations by Sex
Within the Management, Business, Science and Arts occupations in Camp Pendleton South, the most male-oriented occupations are Computers, Engineering & Science (100.0%), Architecture & Engineering (100.0%), and Business & Financial (15.6%), while the most female-oriented occupations are Management (100.0%), Health Diagnosing & Treating (100.0%), and Health Technologists (100.0%).
| Occupation | Male | Female |
| Management | 0 (0.0%) | 137 (100.0%) |
| Business & Financial | 20 (15.6%) | 108 (84.4%) |
| Computers, Engineering & Science | 18 (100.0%) | 0 (0.0%) |
| Computers & Mathematics | 0 (0.0%) | 0 (0.0%) |
| Architecture & Engineering | 18 (100.0%) | 0 (0.0%) |
| Life, Physical & Social Science | 0 (0.0%) | 0 (0.0%) |
| Community & Social Service | 15 (3.9%) | 374 (96.1%) |
| Education, Arts & Media | 0 (0.0%) | 0 (0.0%) |
| Legal Services & Support | 0 (0.0%) | 0 (0.0%) |
| Education Instruction & Library | 15 (3.9%) | 374 (96.1%) |
| Arts, Media & Entertainment | 0 (0.0%) | 0 (0.0%) |
| Health Diagnosing & Treating | 0 (0.0%) | 63 (100.0%) |
| Health Technologists | 0 (0.0%) | 38 (100.0%) |
| Total (Category) | 53 (7.2%) | 682 (92.8%) |
| Total (Overall) | 293 (13.8%) | 1,834 (86.2%) |
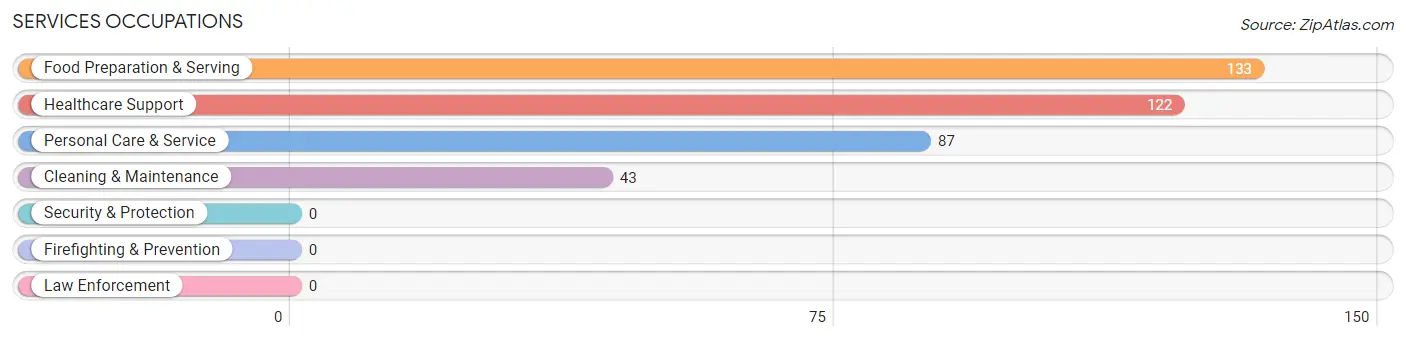
Services Occupations
The most common Services occupations in Camp Pendleton South are Food Preparation & Serving (133 | 6.2%), Healthcare Support (122 | 5.7%), Personal Care & Service (87 | 4.1%), and Cleaning & Maintenance (43 | 2.0%).
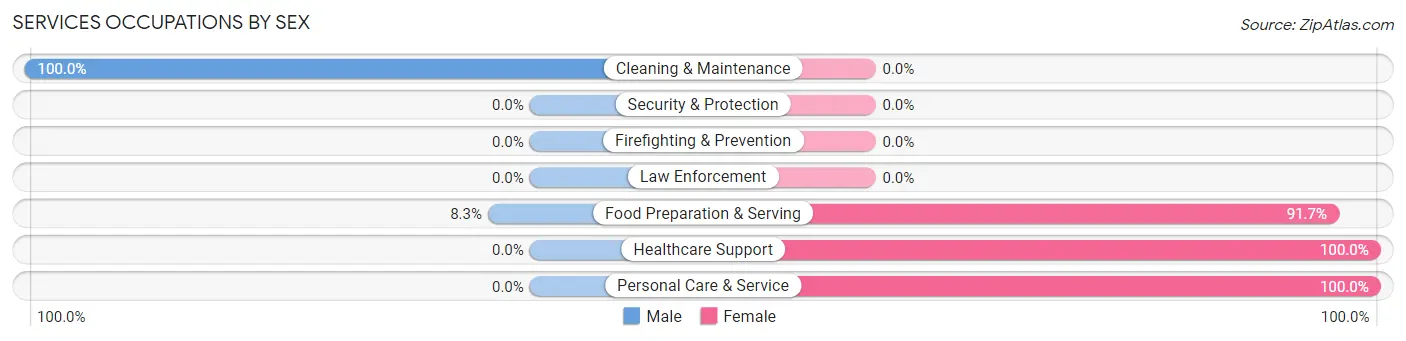
Services Occupations by Sex
Within the Services occupations in Camp Pendleton South, the most male-oriented occupations are Cleaning & Maintenance (100.0%), and Food Preparation & Serving (8.3%), while the most female-oriented occupations are Healthcare Support (100.0%), Personal Care & Service (100.0%), and Food Preparation & Serving (91.7%).
| Occupation | Male | Female |
| Healthcare Support | 0 (0.0%) | 122 (100.0%) |
| Security & Protection | 0 (0.0%) | 0 (0.0%) |
| Firefighting & Prevention | 0 (0.0%) | 0 (0.0%) |
| Law Enforcement | 0 (0.0%) | 0 (0.0%) |
| Food Preparation & Serving | 11 (8.3%) | 122 (91.7%) |
| Cleaning & Maintenance | 43 (100.0%) | 0 (0.0%) |
| Personal Care & Service | 0 (0.0%) | 87 (100.0%) |
| Total (Category) | 54 (14.0%) | 331 (86.0%) |
| Total (Overall) | 293 (13.8%) | 1,834 (86.2%) |
Sales and Office Occupations
The most common Sales and Office occupations in Camp Pendleton South are Office & Administration (407 | 19.1%), and Sales & Related (208 | 9.8%).
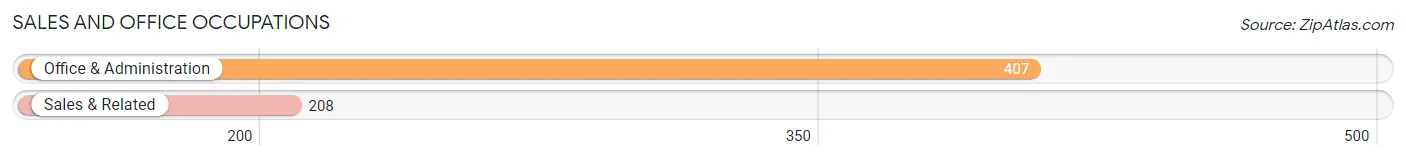
Sales and Office Occupations by Sex
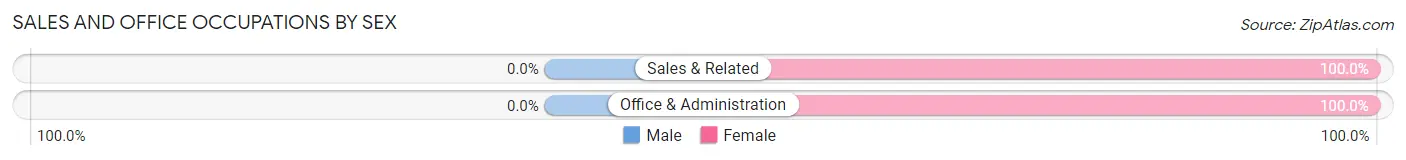
| Occupation | Male | Female |
| Sales & Related | 0 (0.0%) | 208 (100.0%) |
| Office & Administration | 0 (0.0%) | 407 (100.0%) |
| Total (Category) | 0 (0.0%) | 615 (100.0%) |
| Total (Overall) | 293 (13.8%) | 1,834 (86.2%) |
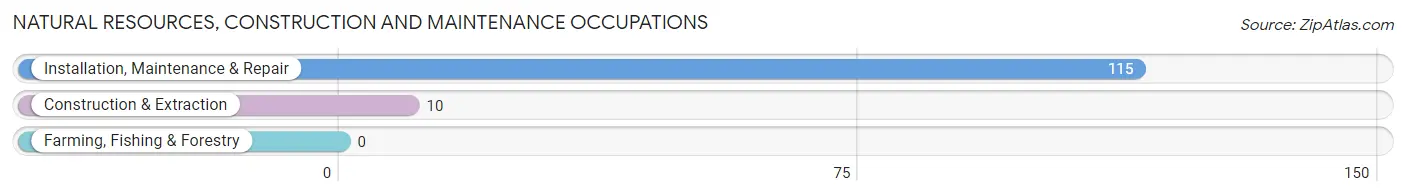
Natural Resources, Construction and Maintenance Occupations
The most common Natural Resources, Construction and Maintenance occupations in Camp Pendleton South are Installation, Maintenance & Repair (115 | 5.4%), and Construction & Extraction (10 | 0.5%).
Natural Resources, Construction and Maintenance Occupations by Sex
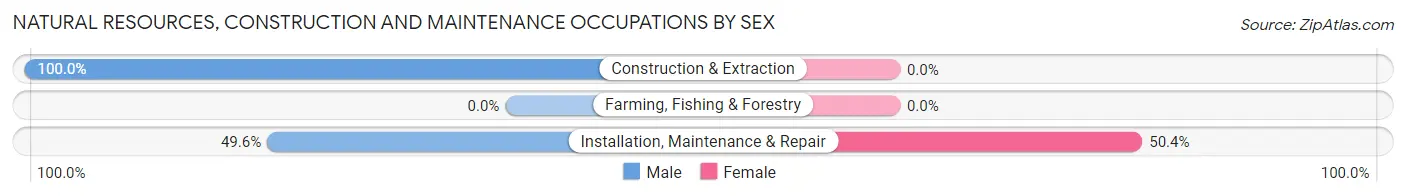
| Occupation | Male | Female |
| Farming, Fishing & Forestry | 0 (0.0%) | 0 (0.0%) |
| Construction & Extraction | 10 (100.0%) | 0 (0.0%) |
| Installation, Maintenance & Repair | 57 (49.6%) | 58 (50.4%) |
| Total (Category) | 67 (53.6%) | 58 (46.4%) |
| Total (Overall) | 293 (13.8%) | 1,834 (86.2%) |
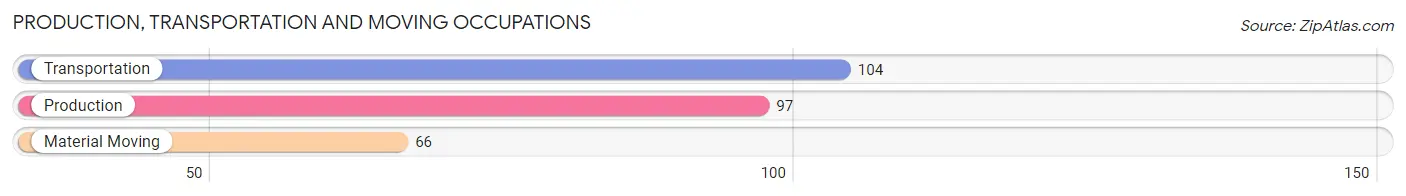
Production, Transportation and Moving Occupations
The most common Production, Transportation and Moving occupations in Camp Pendleton South are Transportation (104 | 4.9%), Production (97 | 4.6%), and Material Moving (66 | 3.1%).
Production, Transportation and Moving Occupations by Sex
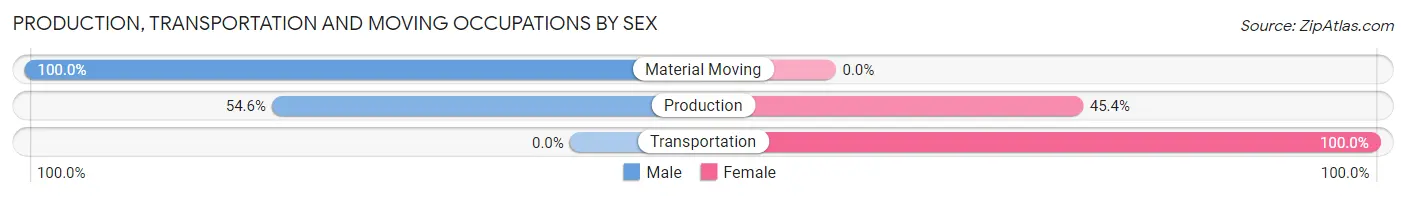
| Occupation | Male | Female |
| Production | 53 (54.6%) | 44 (45.4%) |
| Transportation | 0 (0.0%) | 104 (100.0%) |
| Material Moving | 66 (100.0%) | 0 (0.0%) |
| Total (Category) | 119 (44.6%) | 148 (55.4%) |
| Total (Overall) | 293 (13.8%) | 1,834 (86.2%) |
Employment Industries by Sex in Camp Pendleton South
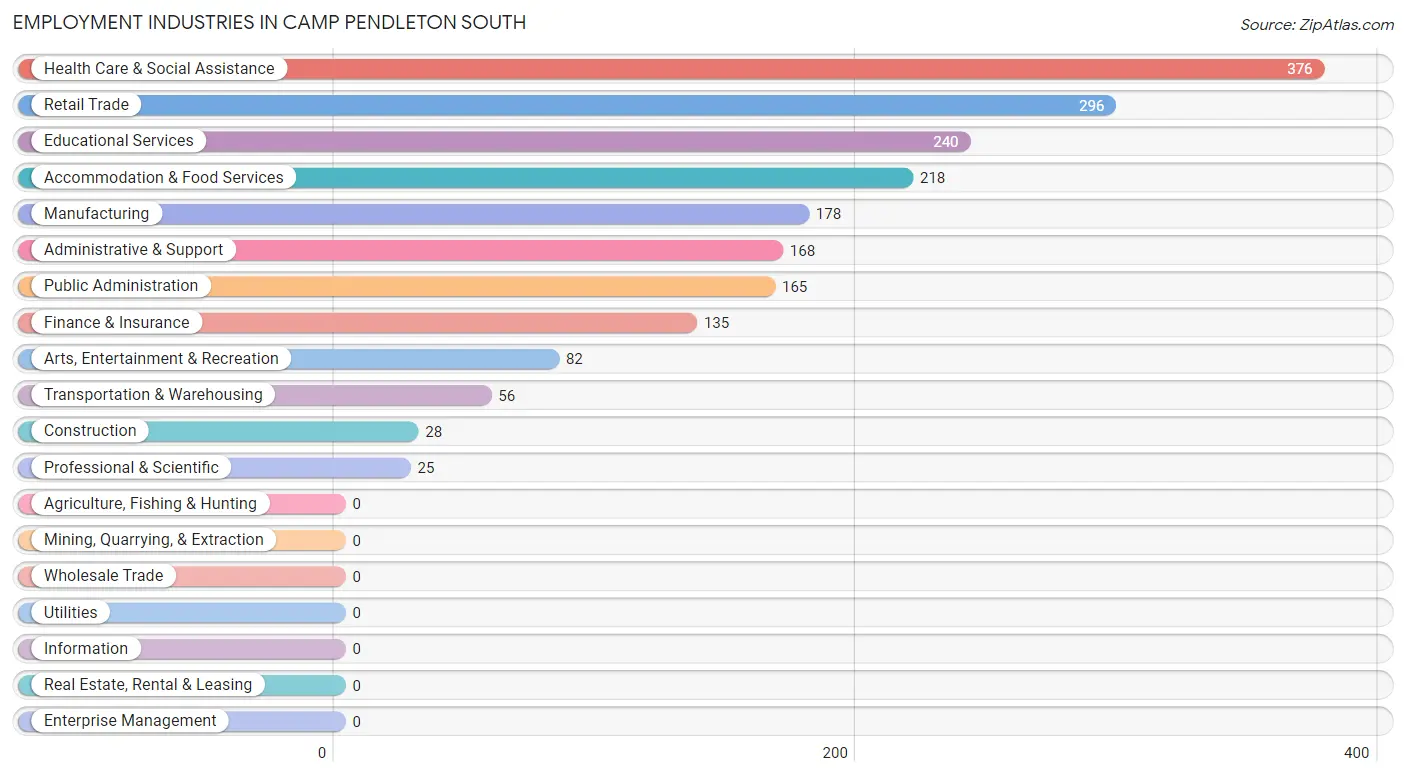
Employment Industries in Camp Pendleton South
The major employment industries in Camp Pendleton South include Health Care & Social Assistance (376 | 17.7%), Retail Trade (296 | 13.9%), Educational Services (240 | 11.3%), Accommodation & Food Services (218 | 10.2%), and Manufacturing (178 | 8.4%).
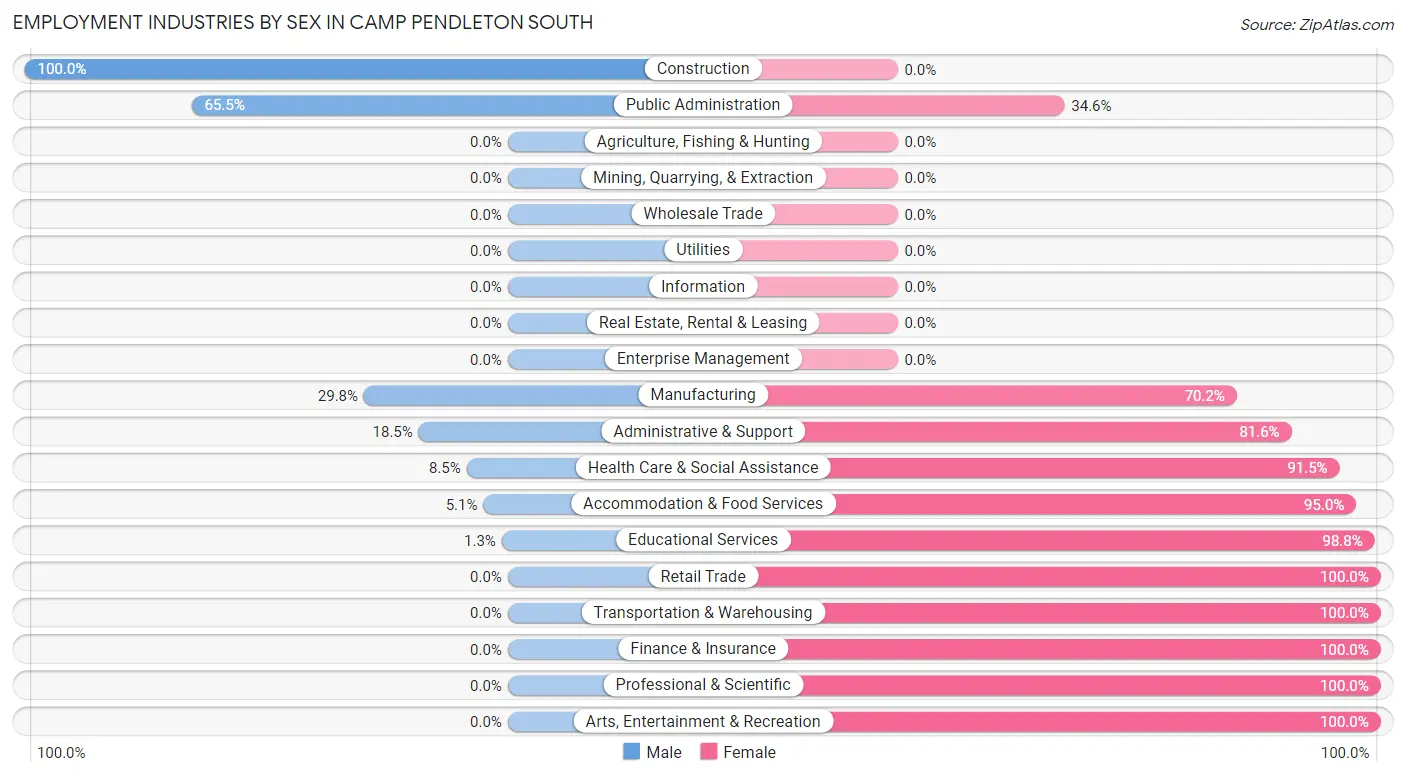
Employment Industries by Sex in Camp Pendleton South
The Camp Pendleton South industries that see more men than women are Construction (100.0%), Public Administration (65.4%), and Manufacturing (29.8%), whereas the industries that tend to have a higher number of women are Retail Trade (100.0%), Transportation & Warehousing (100.0%), and Finance & Insurance (100.0%).
| Industry | Male | Female |
| Agriculture, Fishing & Hunting | 0 (0.0%) | 0 (0.0%) |
| Mining, Quarrying, & Extraction | 0 (0.0%) | 0 (0.0%) |
| Construction | 28 (100.0%) | 0 (0.0%) |
| Manufacturing | 53 (29.8%) | 125 (70.2%) |
| Wholesale Trade | 0 (0.0%) | 0 (0.0%) |
| Retail Trade | 0 (0.0%) | 296 (100.0%) |
| Transportation & Warehousing | 0 (0.0%) | 56 (100.0%) |
| Utilities | 0 (0.0%) | 0 (0.0%) |
| Information | 0 (0.0%) | 0 (0.0%) |
| Finance & Insurance | 0 (0.0%) | 135 (100.0%) |
| Real Estate, Rental & Leasing | 0 (0.0%) | 0 (0.0%) |
| Professional & Scientific | 0 (0.0%) | 25 (100.0%) |
| Enterprise Management | 0 (0.0%) | 0 (0.0%) |
| Administrative & Support | 31 (18.4%) | 137 (81.6%) |
| Educational Services | 3 (1.3%) | 237 (98.8%) |
| Health Care & Social Assistance | 32 (8.5%) | 344 (91.5%) |
| Arts, Entertainment & Recreation | 0 (0.0%) | 82 (100.0%) |
| Accommodation & Food Services | 11 (5.1%) | 207 (95.0%) |
| Public Administration | 108 (65.4%) | 57 (34.5%) |
| Total | 293 (13.8%) | 1,834 (86.2%) |
Education in Camp Pendleton South
School Enrollment in Camp Pendleton South
The most common levels of schooling among the 4,265 students in Camp Pendleton South are college / undergraduate (1,660 | 38.9%), elementary school (969 | 22.7%), and middle school (624 | 14.6%).
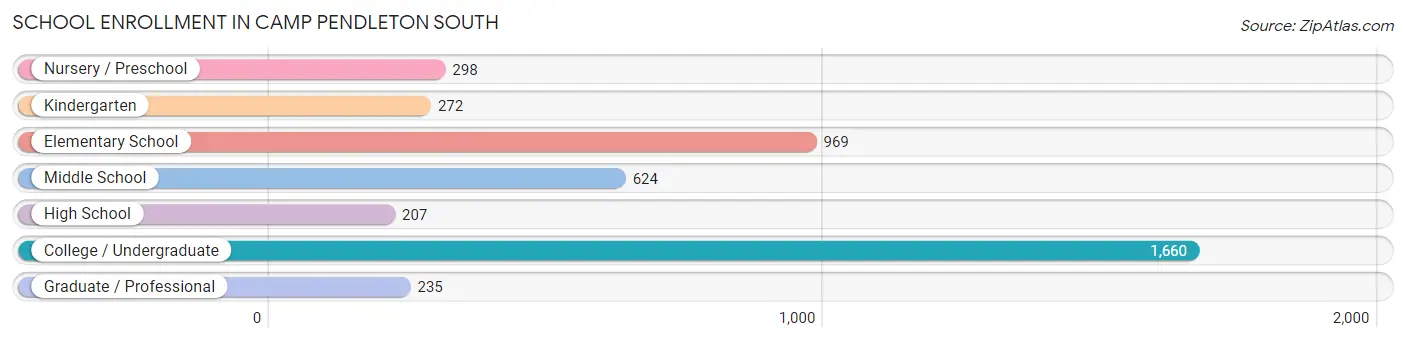
| School Level | # Students | % Students |
| Nursery / Preschool | 298 | 7.0% |
| Kindergarten | 272 | 6.4% |
| Elementary School | 969 | 22.7% |
| Middle School | 624 | 14.6% |
| High School | 207 | 4.9% |
| College / Undergraduate | 1,660 | 38.9% |
| Graduate / Professional | 235 | 5.5% |
| Total | 4,265 | 100.0% |
School Enrollment by Age by Funding Source in Camp Pendleton South
Out of a total of 4,265 students who are enrolled in schools in Camp Pendleton South, 968 (22.7%) attend a private institution, while the remaining 3,297 (77.3%) are enrolled in public schools. The age group of 35 years and over has the highest likelihood of being enrolled in private schools, with 131 (66.8% in the age bracket) enrolled. Conversely, the age group of 15 to 17 year olds has the lowest likelihood of being enrolled in a private school, with 222 (100.0% in the age bracket) attending a public institution.
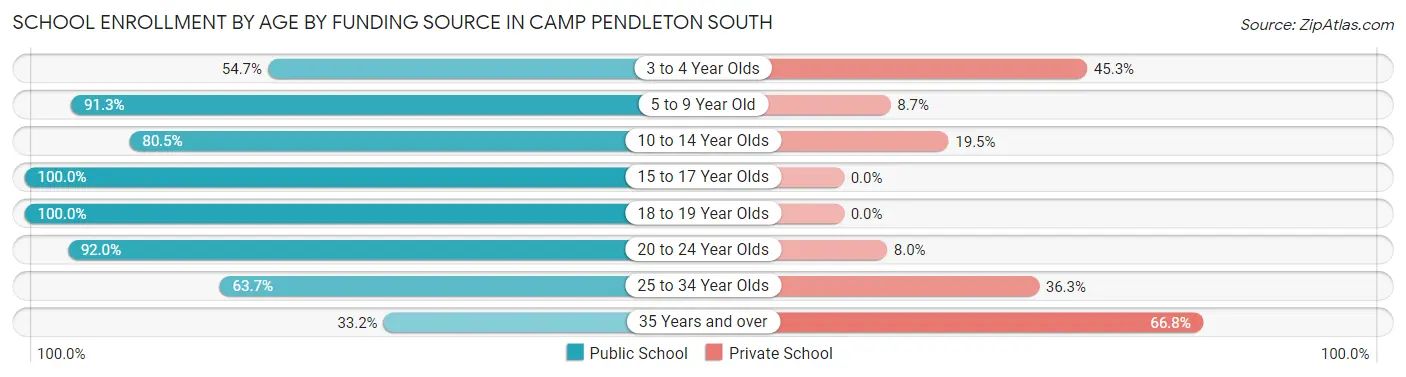
| Age Bracket | Public School | Private School |
| 3 to 4 Year Olds | 105 (54.7%) | 87 (45.3%) |
| 5 to 9 Year Old | 1,252 (91.3%) | 119 (8.7%) |
| 10 to 14 Year Olds | 483 (80.5%) | 117 (19.5%) |
| 15 to 17 Year Olds | 222 (100.0%) | 0 (0.0%) |
| 18 to 19 Year Olds | 8 (100.0%) | 0 (0.0%) |
| 20 to 24 Year Olds | 309 (92.0%) | 27 (8.0%) |
| 25 to 34 Year Olds | 853 (63.7%) | 487 (36.3%) |
| 35 Years and over | 65 (33.2%) | 131 (66.8%) |
| Total | 3,297 (77.3%) | 968 (22.7%) |
Educational Attainment by Field of Study in Camp Pendleton South
Liberal arts & history (310 | 19.1%), business (287 | 17.6%), science & technology (185 | 11.4%), social sciences (172 | 10.6%), and arts & humanities (171 | 10.5%) are the most common fields of study among 1,627 individuals in Camp Pendleton South who have obtained a bachelor's degree or higher.
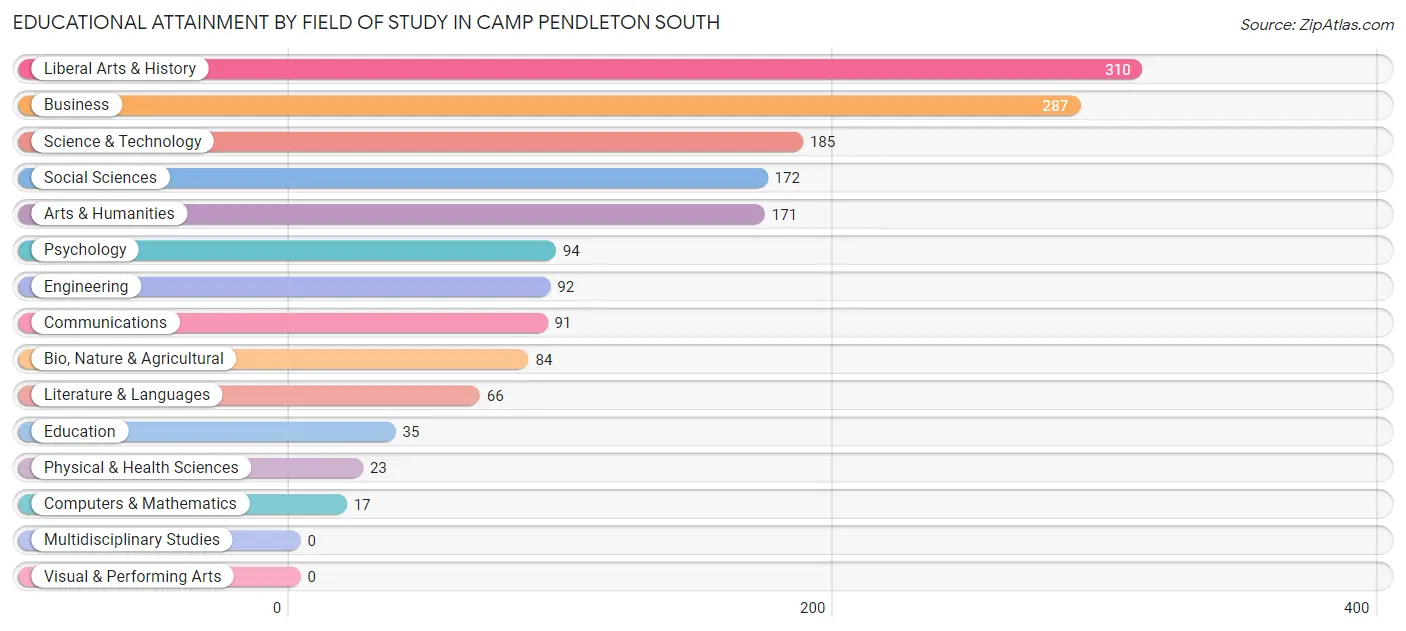
| Field of Study | # Graduates | % Graduates |
| Computers & Mathematics | 17 | 1.0% |
| Bio, Nature & Agricultural | 84 | 5.2% |
| Physical & Health Sciences | 23 | 1.4% |
| Psychology | 94 | 5.8% |
| Social Sciences | 172 | 10.6% |
| Engineering | 92 | 5.7% |
| Multidisciplinary Studies | 0 | 0.0% |
| Science & Technology | 185 | 11.4% |
| Business | 287 | 17.6% |
| Education | 35 | 2.1% |
| Literature & Languages | 66 | 4.1% |
| Liberal Arts & History | 310 | 19.1% |
| Visual & Performing Arts | 0 | 0.0% |
| Communications | 91 | 5.6% |
| Arts & Humanities | 171 | 10.5% |
| Total | 1,627 | 100.0% |
Transportation & Commute in Camp Pendleton South
Vehicle Availability by Sex in Camp Pendleton South
The most prevalent vehicle ownership categories in Camp Pendleton South are males with 2 vehicles (3,027, accounting for 78.5%) and females with 2 vehicles (1,503, making up 149.7%).
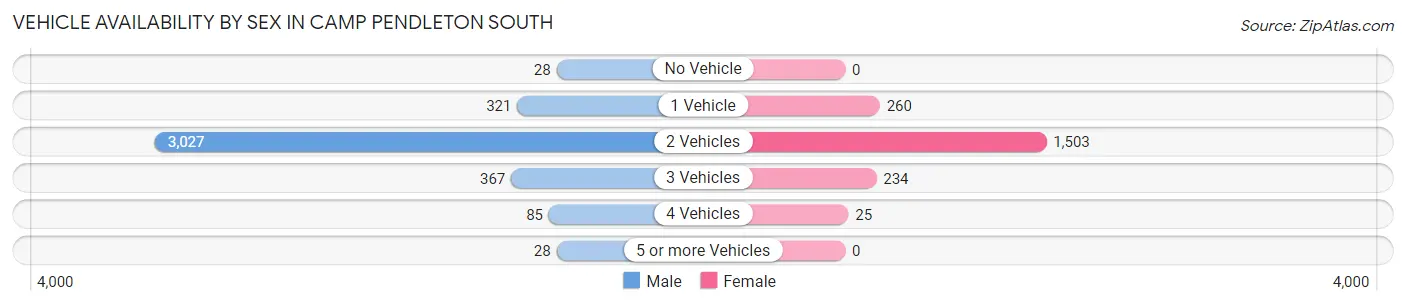
| Vehicles Available | Male | Female |
| No Vehicle | 28 (0.7%) | 0 (0.0%) |
| 1 Vehicle | 321 (8.3%) | 260 (12.9%) |
| 2 Vehicles | 3,027 (78.5%) | 1,503 (74.3%) |
| 3 Vehicles | 367 (9.5%) | 234 (11.6%) |
| 4 Vehicles | 85 (2.2%) | 25 (1.2%) |
| 5 or more Vehicles | 28 (0.7%) | 0 (0.0%) |
| Total | 3,856 (100.0%) | 2,022 (100.0%) |
Commute Time in Camp Pendleton South
The most frequently occuring commute durations in Camp Pendleton South are 20 to 24 minutes (1,049 commuters, 16.7%), 10 to 14 minutes (1,010 commuters, 16.1%), and 15 to 19 minutes (972 commuters, 15.4%).
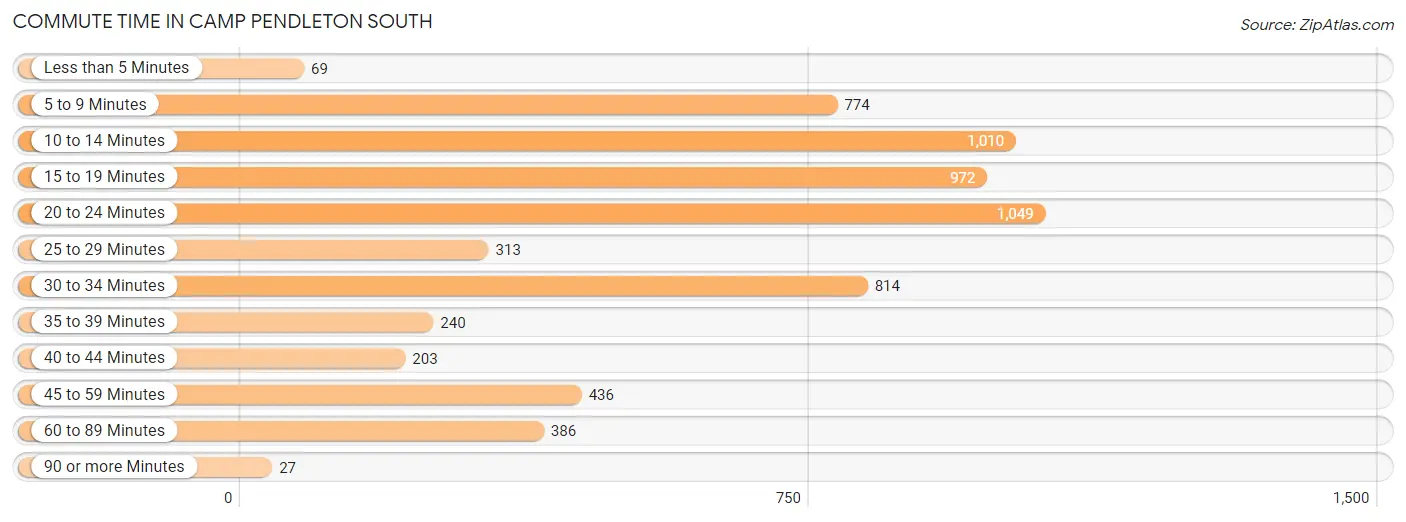
| Commute Time | # Commuters | % Commuters |
| Less than 5 Minutes | 69 | 1.1% |
| 5 to 9 Minutes | 774 | 12.3% |
| 10 to 14 Minutes | 1,010 | 16.1% |
| 15 to 19 Minutes | 972 | 15.4% |
| 20 to 24 Minutes | 1,049 | 16.7% |
| 25 to 29 Minutes | 313 | 5.0% |
| 30 to 34 Minutes | 814 | 12.9% |
| 35 to 39 Minutes | 240 | 3.8% |
| 40 to 44 Minutes | 203 | 3.2% |
| 45 to 59 Minutes | 436 | 6.9% |
| 60 to 89 Minutes | 386 | 6.1% |
| 90 or more Minutes | 27 | 0.4% |
Commute Time by Sex in Camp Pendleton South
The most common commute times in Camp Pendleton South are 15 to 19 minutes (797 commuters, 18.3%) for males and 30 to 34 minutes (421 commuters, 21.6%) for females.
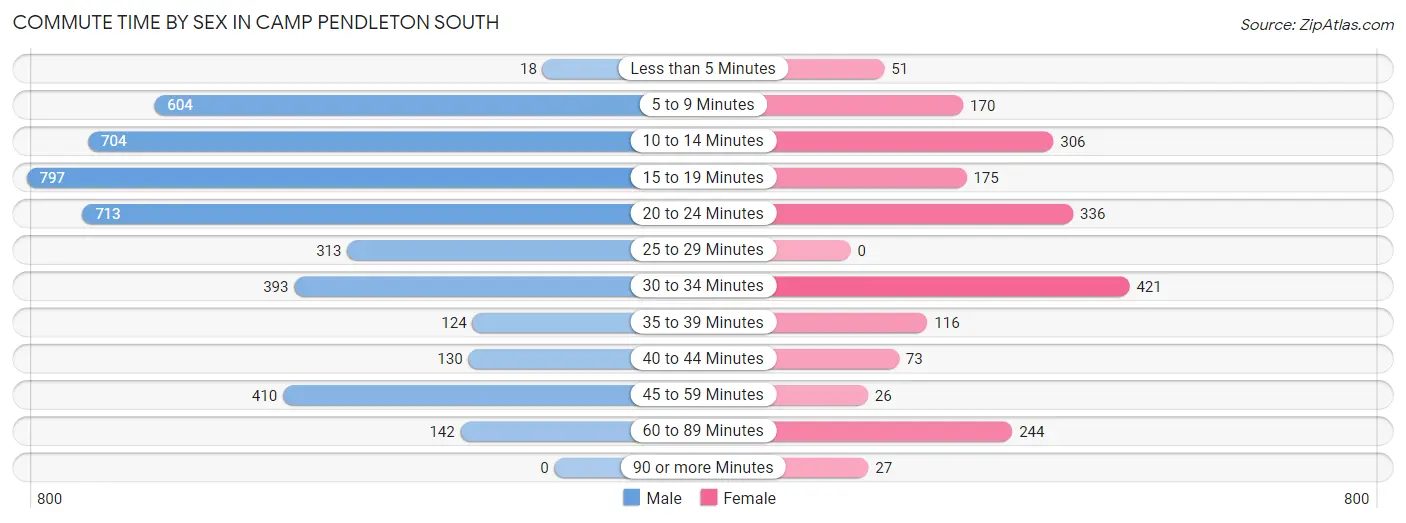
| Commute Time | Male | Female |
| Less than 5 Minutes | 18 (0.4%) | 51 (2.6%) |
| 5 to 9 Minutes | 604 (13.9%) | 170 (8.7%) |
| 10 to 14 Minutes | 704 (16.2%) | 306 (15.7%) |
| 15 to 19 Minutes | 797 (18.3%) | 175 (9.0%) |
| 20 to 24 Minutes | 713 (16.4%) | 336 (17.3%) |
| 25 to 29 Minutes | 313 (7.2%) | 0 (0.0%) |
| 30 to 34 Minutes | 393 (9.0%) | 421 (21.6%) |
| 35 to 39 Minutes | 124 (2.9%) | 116 (6.0%) |
| 40 to 44 Minutes | 130 (3.0%) | 73 (3.7%) |
| 45 to 59 Minutes | 410 (9.4%) | 26 (1.3%) |
| 60 to 89 Minutes | 142 (3.3%) | 244 (12.5%) |
| 90 or more Minutes | 0 (0.0%) | 27 (1.4%) |
Time of Departure to Work by Sex in Camp Pendleton South
The most frequent times of departure to work in Camp Pendleton South are 6:00 AM to 6:29 AM (883, 20.3%) for males and 7:00 AM to 7:29 AM (425, 21.8%) for females.
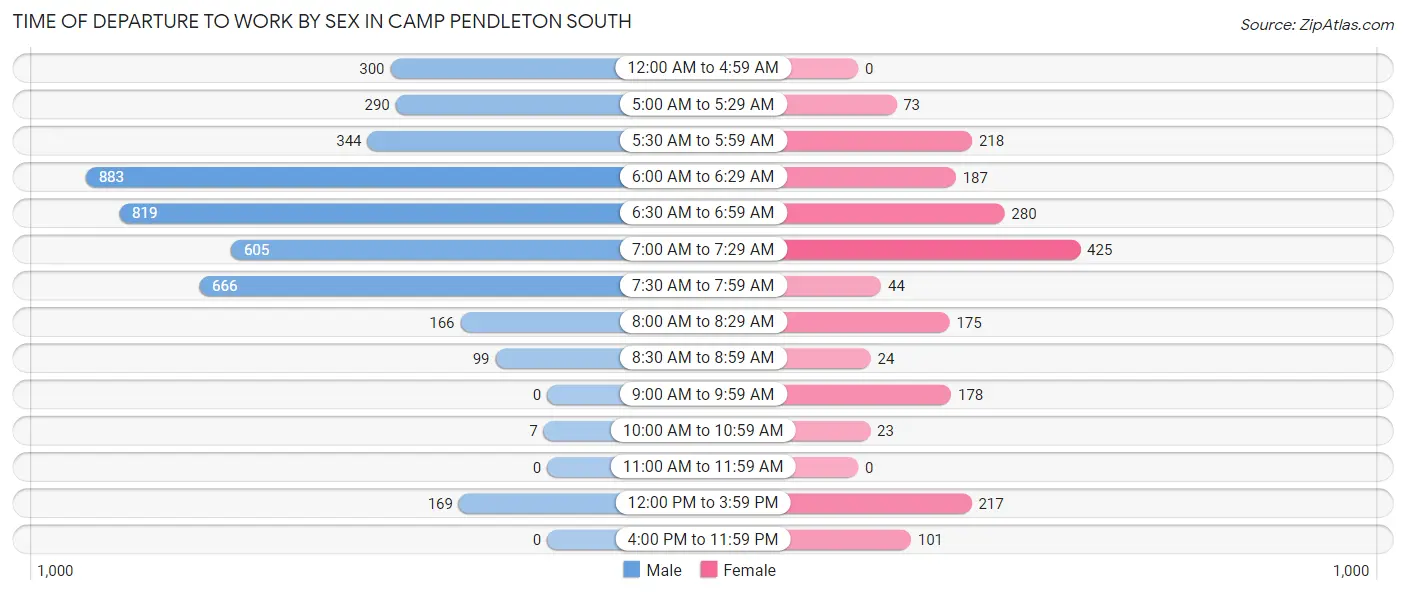
| Time of Departure | Male | Female |
| 12:00 AM to 4:59 AM | 300 (6.9%) | 0 (0.0%) |
| 5:00 AM to 5:29 AM | 290 (6.7%) | 73 (3.7%) |
| 5:30 AM to 5:59 AM | 344 (7.9%) | 218 (11.2%) |
| 6:00 AM to 6:29 AM | 883 (20.3%) | 187 (9.6%) |
| 6:30 AM to 6:59 AM | 819 (18.8%) | 280 (14.4%) |
| 7:00 AM to 7:29 AM | 605 (13.9%) | 425 (21.8%) |
| 7:30 AM to 7:59 AM | 666 (15.3%) | 44 (2.3%) |
| 8:00 AM to 8:29 AM | 166 (3.8%) | 175 (9.0%) |
| 8:30 AM to 8:59 AM | 99 (2.3%) | 24 (1.2%) |
| 9:00 AM to 9:59 AM | 0 (0.0%) | 178 (9.1%) |
| 10:00 AM to 10:59 AM | 7 (0.2%) | 23 (1.2%) |
| 11:00 AM to 11:59 AM | 0 (0.0%) | 0 (0.0%) |
| 12:00 PM to 3:59 PM | 169 (3.9%) | 217 (11.2%) |
| 4:00 PM to 11:59 PM | 0 (0.0%) | 101 (5.2%) |
| Total | 4,348 (100.0%) | 1,945 (100.0%) |
Housing Occupancy in Camp Pendleton South
Occupancy by Ownership in Camp Pendleton South
Of the total 4,250 dwellings in Camp Pendleton South, owner-occupied units account for 45 (1.1%), while renter-occupied units make up 4,205 (98.9%).
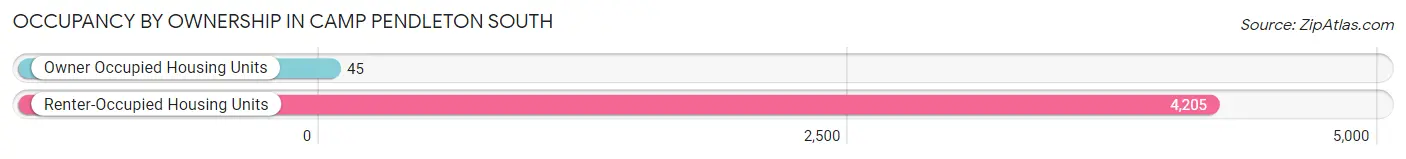
| Occupancy | # Housing Units | % Housing Units |
| Owner Occupied Housing Units | 45 | 1.1% |
| Renter-Occupied Housing Units | 4,205 | 98.9% |
| Total Occupied Housing Units | 4,250 | 100.0% |
Occupancy by Household Size in Camp Pendleton South
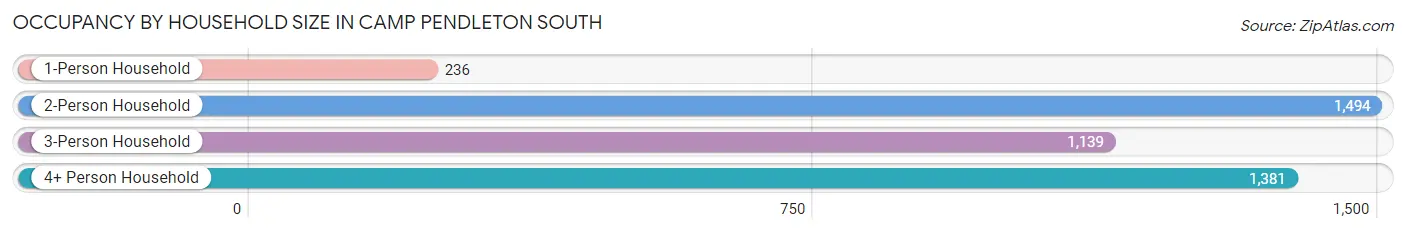
| Household Size | # Housing Units | % Housing Units |
| 1-Person Household | 236 | 5.6% |
| 2-Person Household | 1,494 | 35.1% |
| 3-Person Household | 1,139 | 26.8% |
| 4+ Person Household | 1,381 | 32.5% |
| Total Housing Units | 4,250 | 100.0% |
Occupancy by Ownership by Household Size in Camp Pendleton South
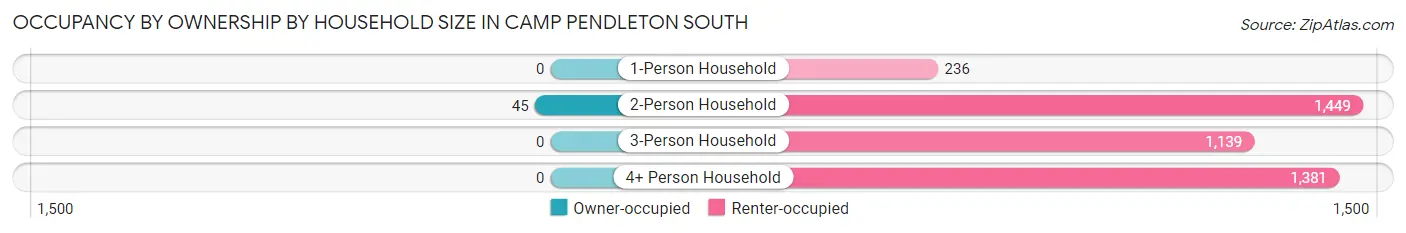
| Household Size | Owner-occupied | Renter-occupied |
| 1-Person Household | 0 (0.0%) | 236 (100.0%) |
| 2-Person Household | 45 (3.0%) | 1,449 (97.0%) |
| 3-Person Household | 0 (0.0%) | 1,139 (100.0%) |
| 4+ Person Household | 0 (0.0%) | 1,381 (100.0%) |
| Total Housing Units | 45 (1.1%) | 4,205 (98.9%) |
Occupancy by Educational Attainment in Camp Pendleton South
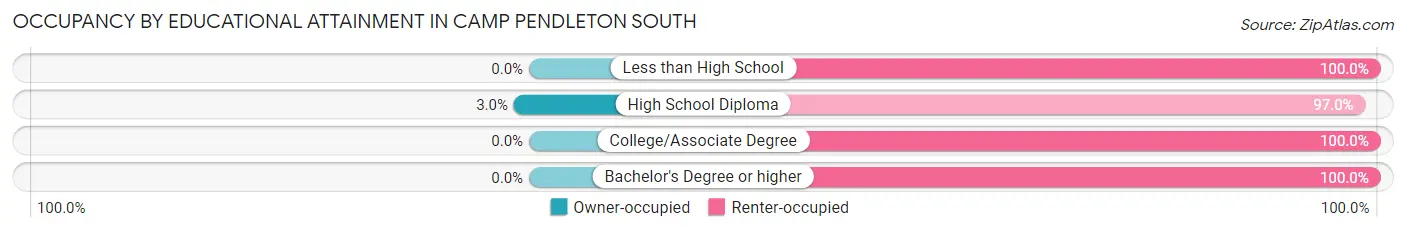
| Household Size | Owner-occupied | Renter-occupied |
| Less than High School | 0 (0.0%) | 12 (100.0%) |
| High School Diploma | 45 (3.0%) | 1,452 (97.0%) |
| College/Associate Degree | 0 (0.0%) | 1,801 (100.0%) |
| Bachelor's Degree or higher | 0 (0.0%) | 940 (100.0%) |
Occupancy by Age of Householder in Camp Pendleton South
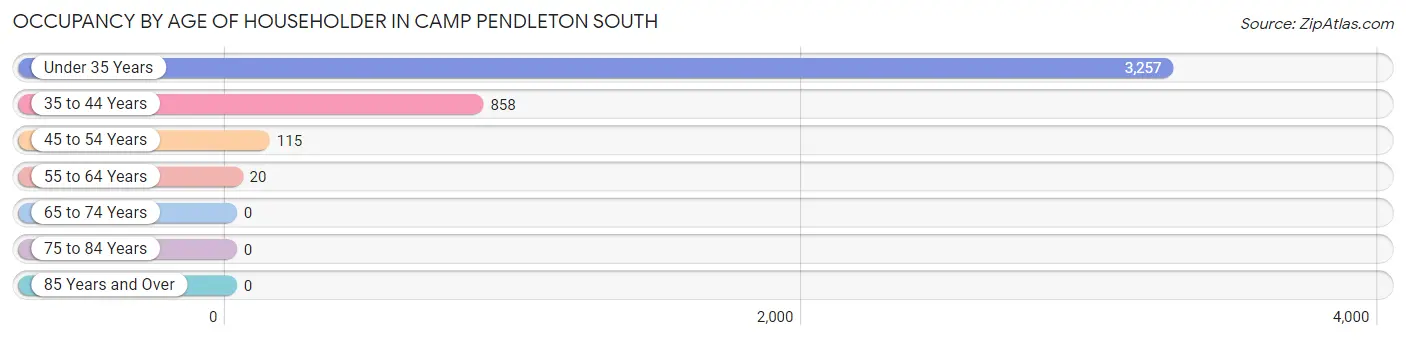
| Age Bracket | # Households | % Households |
| Under 35 Years | 3,257 | 76.6% |
| 35 to 44 Years | 858 | 20.2% |
| 45 to 54 Years | 115 | 2.7% |
| 55 to 64 Years | 20 | 0.5% |
| 65 to 74 Years | 0 | 0.0% |
| 75 to 84 Years | 0 | 0.0% |
| 85 Years and Over | 0 | 0.0% |
| Total | 4,250 | 100.0% |
Housing Finances in Camp Pendleton South
Median Income by Occupancy in Camp Pendleton South
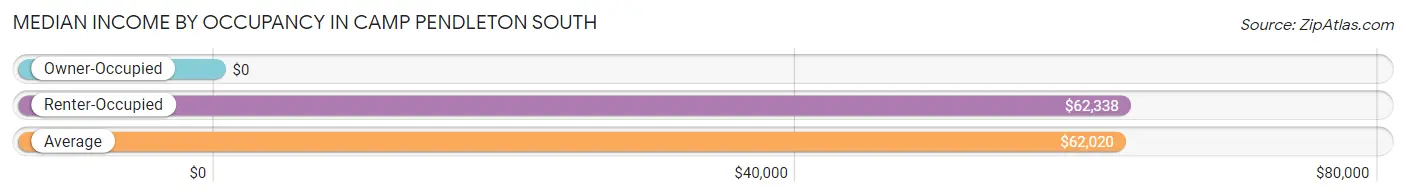
| Occupancy Type | # Households | Median Income |
| Owner-Occupied | 45 (1.1%) | $0 |
| Renter-Occupied | 4,205 (98.9%) | $62,338 |
| Average | 4,250 (100.0%) | $62,020 |
Occupancy by Householder Income Bracket in Camp Pendleton South
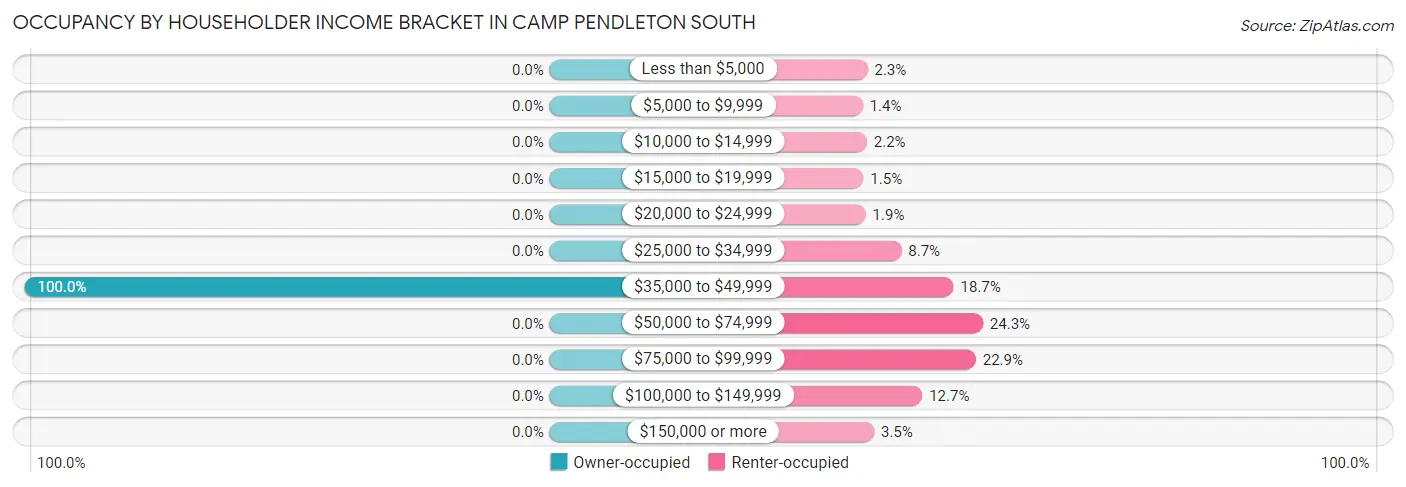
| Income Bracket | Owner-occupied | Renter-occupied |
| Less than $5,000 | 0 (0.0%) | 96 (2.3%) |
| $5,000 to $9,999 | 0 (0.0%) | 57 (1.4%) |
| $10,000 to $14,999 | 0 (0.0%) | 91 (2.2%) |
| $15,000 to $19,999 | 0 (0.0%) | 63 (1.5%) |
| $20,000 to $24,999 | 0 (0.0%) | 81 (1.9%) |
| $25,000 to $34,999 | 0 (0.0%) | 367 (8.7%) |
| $35,000 to $49,999 | 45 (100.0%) | 785 (18.7%) |
| $50,000 to $74,999 | 0 (0.0%) | 1,020 (24.3%) |
| $75,000 to $99,999 | 0 (0.0%) | 963 (22.9%) |
| $100,000 to $149,999 | 0 (0.0%) | 534 (12.7%) |
| $150,000 or more | 0 (0.0%) | 148 (3.5%) |
| Total | 45 (100.0%) | 4,205 (100.0%) |
Monthly Housing Cost Tiers in Camp Pendleton South
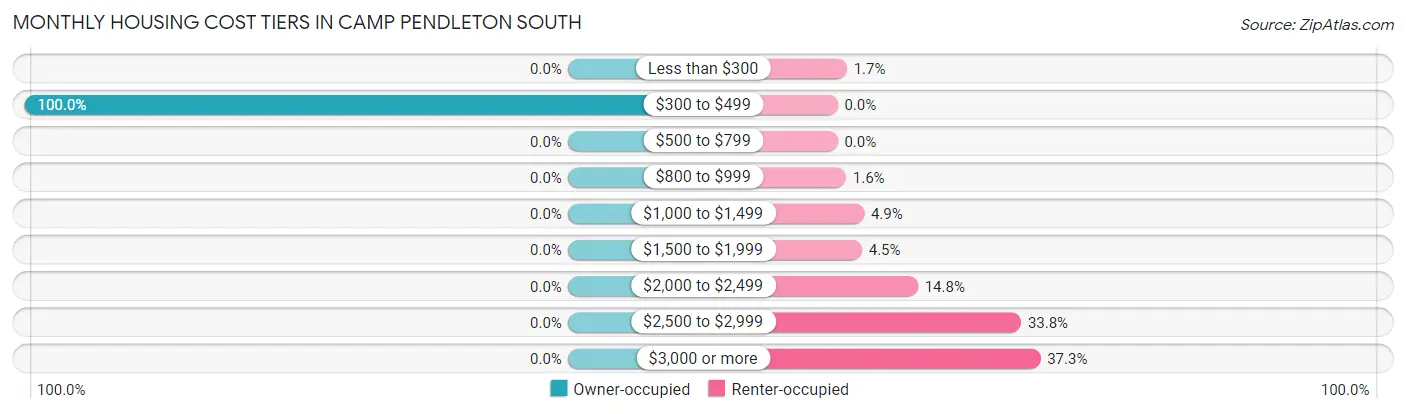
| Monthly Cost | Owner-occupied | Renter-occupied |
| Less than $300 | 0 (0.0%) | 72 (1.7%) |
| $300 to $499 | 45 (100.0%) | 0 (0.0%) |
| $500 to $799 | 0 (0.0%) | 0 (0.0%) |
| $800 to $999 | 0 (0.0%) | 65 (1.5%) |
| $1,000 to $1,499 | 0 (0.0%) | 205 (4.9%) |
| $1,500 to $1,999 | 0 (0.0%) | 189 (4.5%) |
| $2,000 to $2,499 | 0 (0.0%) | 622 (14.8%) |
| $2,500 to $2,999 | 0 (0.0%) | 1,421 (33.8%) |
| $3,000 or more | 0 (0.0%) | 1,570 (37.3%) |
| Total | 45 (100.0%) | 4,205 (100.0%) |
Physical Housing Characteristics in Camp Pendleton South
Housing Structures in Camp Pendleton South
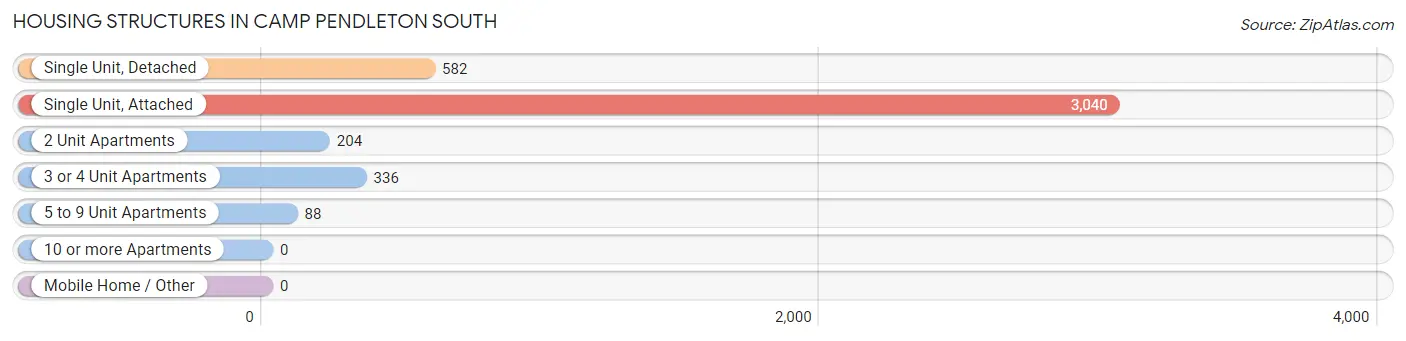
| Structure Type | # Housing Units | % Housing Units |
| Single Unit, Detached | 582 | 13.7% |
| Single Unit, Attached | 3,040 | 71.5% |
| 2 Unit Apartments | 204 | 4.8% |
| 3 or 4 Unit Apartments | 336 | 7.9% |
| 5 to 9 Unit Apartments | 88 | 2.1% |
| 10 or more Apartments | 0 | 0.0% |
| Mobile Home / Other | 0 | 0.0% |
| Total | 4,250 | 100.0% |
Housing Structures by Occupancy in Camp Pendleton South
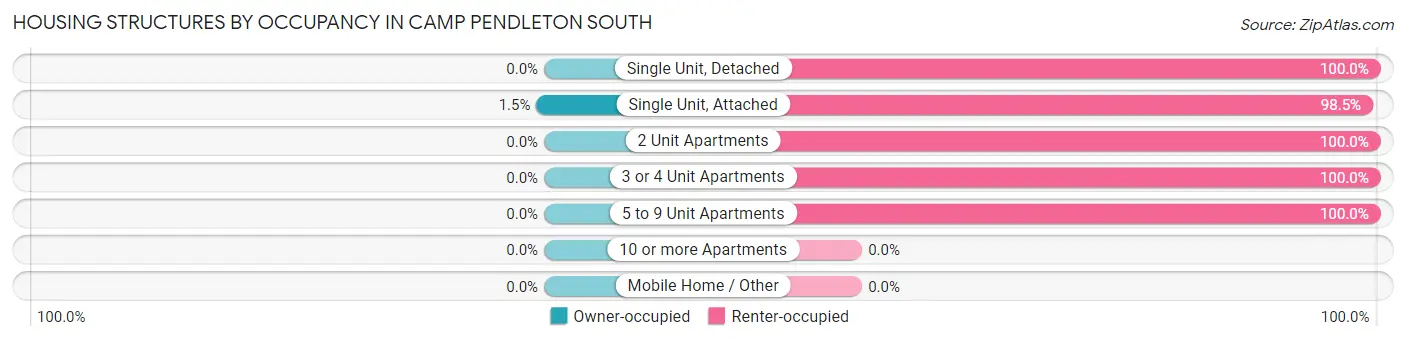
| Structure Type | Owner-occupied | Renter-occupied |
| Single Unit, Detached | 0 (0.0%) | 582 (100.0%) |
| Single Unit, Attached | 45 (1.5%) | 2,995 (98.5%) |
| 2 Unit Apartments | 0 (0.0%) | 204 (100.0%) |
| 3 or 4 Unit Apartments | 0 (0.0%) | 336 (100.0%) |
| 5 to 9 Unit Apartments | 0 (0.0%) | 88 (100.0%) |
| 10 or more Apartments | 0 (0.0%) | 0 (0.0%) |
| Mobile Home / Other | 0 (0.0%) | 0 (0.0%) |
| Total | 45 (1.1%) | 4,205 (98.9%) |
Housing Structures by Number of Rooms in Camp Pendleton South
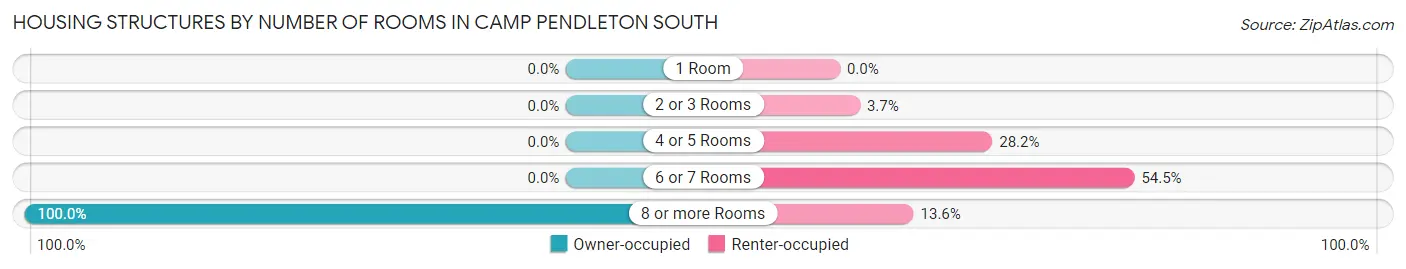
| Number of Rooms | Owner-occupied | Renter-occupied |
| 1 Room | 0 (0.0%) | 0 (0.0%) |
| 2 or 3 Rooms | 0 (0.0%) | 156 (3.7%) |
| 4 or 5 Rooms | 0 (0.0%) | 1,185 (28.2%) |
| 6 or 7 Rooms | 0 (0.0%) | 2,291 (54.5%) |
| 8 or more Rooms | 45 (100.0%) | 573 (13.6%) |
| Total | 45 (100.0%) | 4,205 (100.0%) |
Housing Structure by Heating Type in Camp Pendleton South
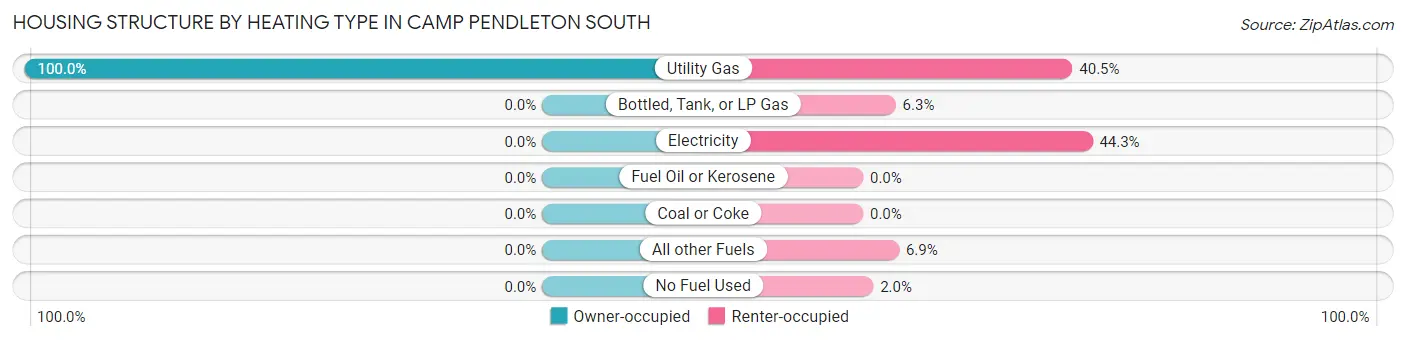
| Heating Type | Owner-occupied | Renter-occupied |
| Utility Gas | 45 (100.0%) | 1,701 (40.5%) |
| Bottled, Tank, or LP Gas | 0 (0.0%) | 265 (6.3%) |
| Electricity | 0 (0.0%) | 1,864 (44.3%) |
| Fuel Oil or Kerosene | 0 (0.0%) | 0 (0.0%) |
| Coal or Coke | 0 (0.0%) | 0 (0.0%) |
| All other Fuels | 0 (0.0%) | 292 (6.9%) |
| No Fuel Used | 0 (0.0%) | 83 (2.0%) |
| Total | 45 (100.0%) | 4,205 (100.0%) |
Household Vehicle Usage in Camp Pendleton South
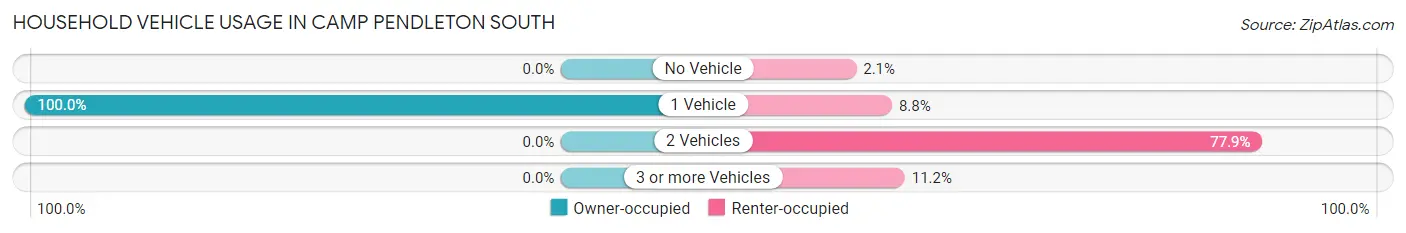
| Vehicles per Household | Owner-occupied | Renter-occupied |
| No Vehicle | 0 (0.0%) | 89 (2.1%) |
| 1 Vehicle | 45 (100.0%) | 369 (8.8%) |
| 2 Vehicles | 0 (0.0%) | 3,277 (77.9%) |
| 3 or more Vehicles | 0 (0.0%) | 470 (11.2%) |
| Total | 45 (100.0%) | 4,205 (100.0%) |
Real Estate & Mortgages in Camp Pendleton South
Real Estate and Mortgage Overview in Camp Pendleton South
| Characteristic | Without Mortgage | With Mortgage |
| Housing Units | 45 | 0 |
| Median Property Value | - | - |
| Median Household Income | - | - |
| Monthly Housing Costs | - | - |
| Real Estate Taxes | - | - |
Property Value by Mortgage Status in Camp Pendleton South
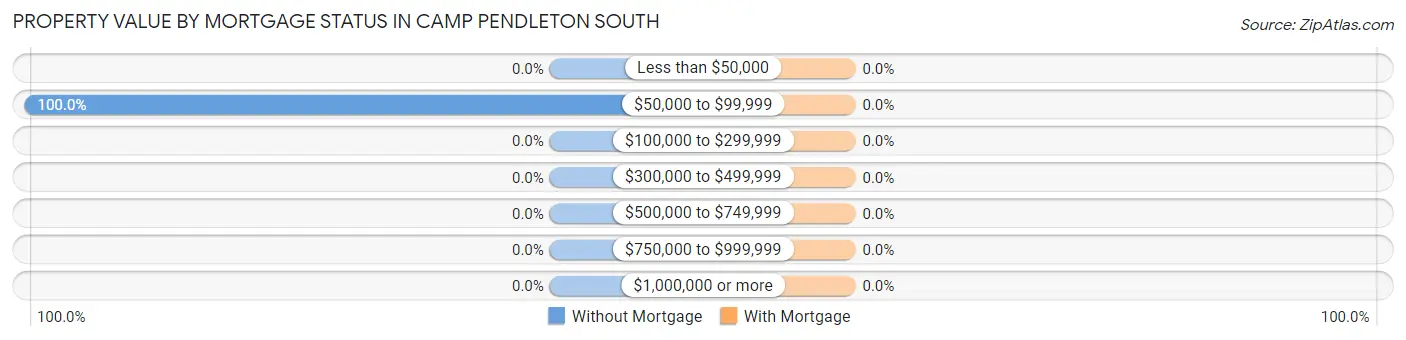
| Property Value | Without Mortgage | With Mortgage |
| Less than $50,000 | 0 (0.0%) | 0 (0.0%) |
| $50,000 to $99,999 | 45 (100.0%) | 0 (0.0%) |
| $100,000 to $299,999 | 0 (0.0%) | 0 (0.0%) |
| $300,000 to $499,999 | 0 (0.0%) | 0 (0.0%) |
| $500,000 to $749,999 | 0 (0.0%) | 0 (0.0%) |
| $750,000 to $999,999 | 0 (0.0%) | 0 (0.0%) |
| $1,000,000 or more | 0 (0.0%) | 0 (0.0%) |
| Total | 45 (100.0%) | 0 (0.0%) |
Household Income by Mortgage Status in Camp Pendleton South
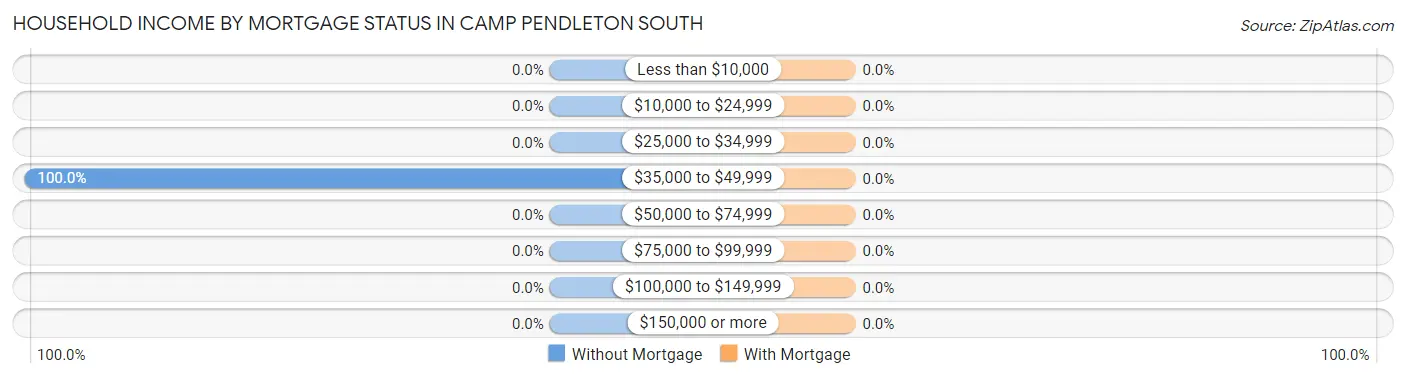
| Household Income | Without Mortgage | With Mortgage |
| Less than $10,000 | 0 (0.0%) | 0 (0.0%) |
| $10,000 to $24,999 | 0 (0.0%) | 0 (0.0%) |
| $25,000 to $34,999 | 0 (0.0%) | 0 (0.0%) |
| $35,000 to $49,999 | 45 (100.0%) | 0 (0.0%) |
| $50,000 to $74,999 | 0 (0.0%) | 0 (0.0%) |
| $75,000 to $99,999 | 0 (0.0%) | 0 (0.0%) |
| $100,000 to $149,999 | 0 (0.0%) | 0 (0.0%) |
| $150,000 or more | 0 (0.0%) | 0 (0.0%) |
| Total | 45 (100.0%) | 0 (0.0%) |
Property Value to Household Income Ratio in Camp Pendleton South
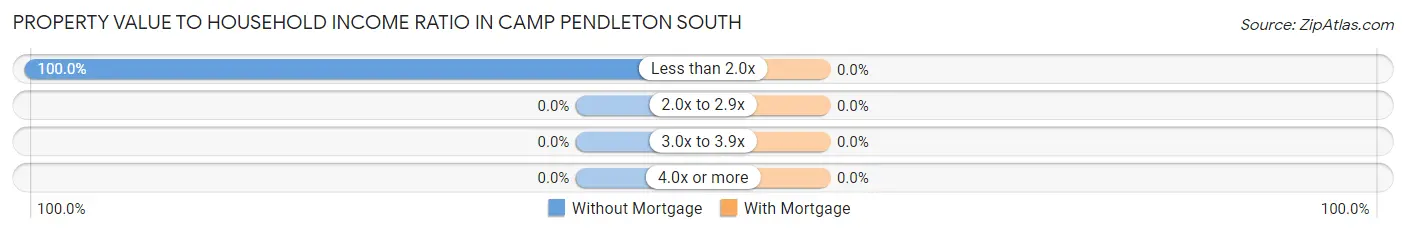
| Value-to-Income Ratio | Without Mortgage | With Mortgage |
| Less than 2.0x | 45 (100.0%) | 0 (0.0%) |
| 2.0x to 2.9x | 0 (0.0%) | 0 (0.0%) |
| 3.0x to 3.9x | 0 (0.0%) | 0 (0.0%) |
| 4.0x or more | 0 (0.0%) | 0 (0.0%) |
| Total | 45 (100.0%) | 0 (0.0%) |
Real Estate Taxes by Mortgage Status in Camp Pendleton South
| Property Taxes | Without Mortgage | With Mortgage |
| Less than $800 | 0 (0.0%) | 0 (0.0%) |
| $800 to $1,499 | 0 (0.0%) | 0 (0.0%) |
| $800 to $1,499 | 0 (0.0%) | 0 (0.0%) |
| Total | 45 (100.0%) | 0 (0.0%) |
Health & Disability in Camp Pendleton South
Health Insurance Coverage by Age in Camp Pendleton South
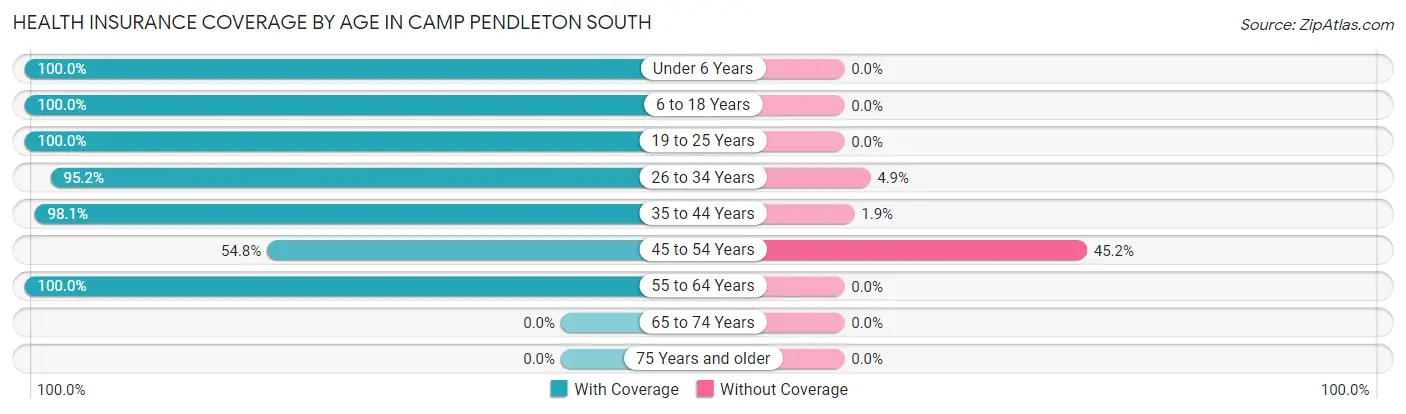
| Age Bracket | With Coverage | Without Coverage |
| Under 6 Years | 2,919 (100.0%) | 0 (0.0%) |
| 6 to 18 Years | 1,970 (100.0%) | 0 (0.0%) |
| 19 to 25 Years | 1,432 (100.0%) | 0 (0.0%) |
| 26 to 34 Years | 1,922 (95.2%) | 98 (4.9%) |
| 35 to 44 Years | 626 (98.1%) | 12 (1.9%) |
| 45 to 54 Years | 63 (54.8%) | 52 (45.2%) |
| 55 to 64 Years | 96 (100.0%) | 0 (0.0%) |
| 65 to 74 Years | 0 (0.0%) | 0 (0.0%) |
| 75 Years and older | 0 (0.0%) | 0 (0.0%) |
| Total | 9,028 (98.2%) | 162 (1.8%) |
Health Insurance Coverage by Citizenship Status in Camp Pendleton South
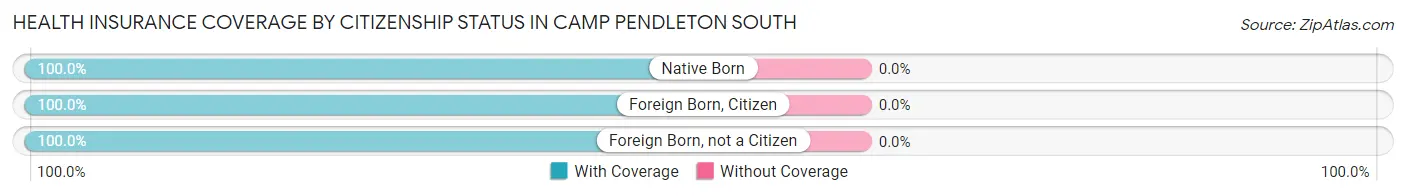
| Citizenship Status | With Coverage | Without Coverage |
| Native Born | 2,919 (100.0%) | 0 (0.0%) |
| Foreign Born, Citizen | 1,970 (100.0%) | 0 (0.0%) |
| Foreign Born, not a Citizen | 1,432 (100.0%) | 0 (0.0%) |
Health Insurance Coverage by Household Income in Camp Pendleton South
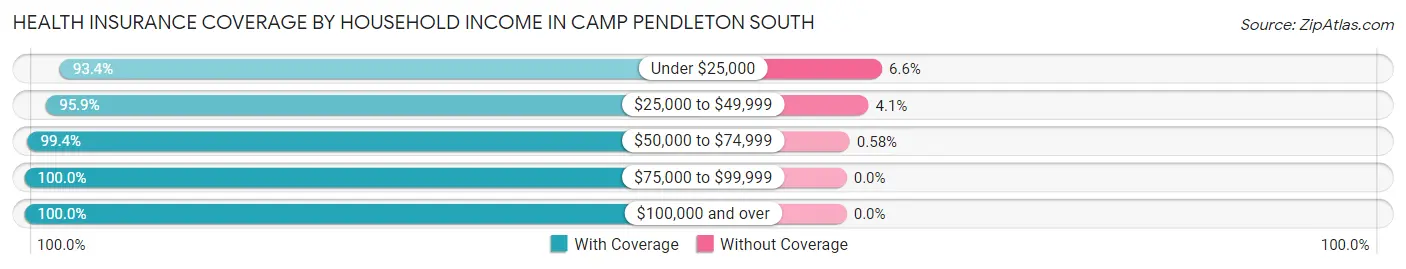
| Household Income | With Coverage | Without Coverage |
| Under $25,000 | 735 (93.4%) | 52 (6.6%) |
| $25,000 to $49,999 | 2,304 (95.9%) | 98 (4.1%) |
| $50,000 to $74,999 | 2,043 (99.4%) | 12 (0.6%) |
| $75,000 to $99,999 | 2,224 (100.0%) | 0 (0.0%) |
| $100,000 and over | 1,722 (100.0%) | 0 (0.0%) |
Public vs Private Health Insurance Coverage by Age in Camp Pendleton South
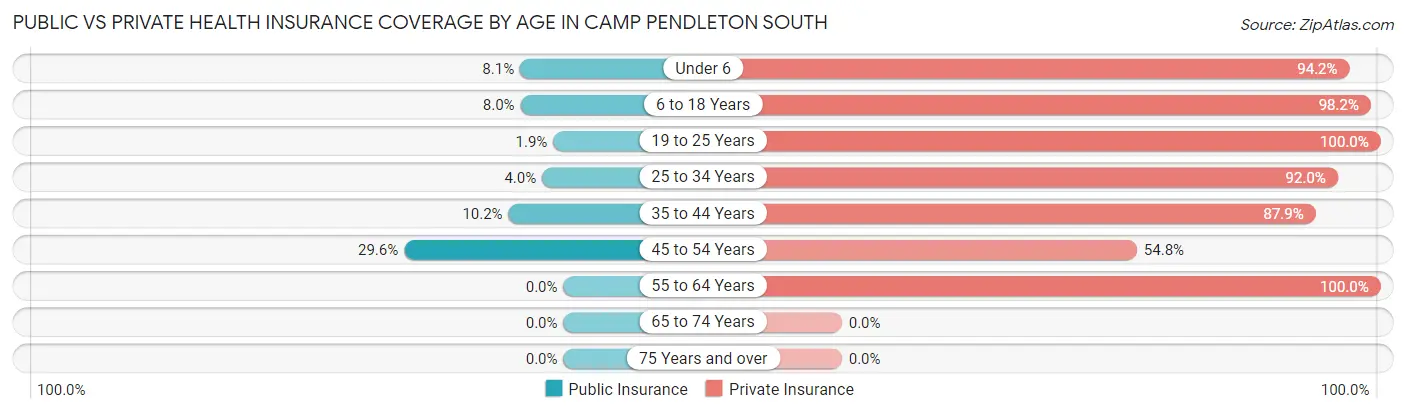
| Age Bracket | Public Insurance | Private Insurance |
| Under 6 | 235 (8.1%) | 2,750 (94.2%) |
| 6 to 18 Years | 157 (8.0%) | 1,934 (98.2%) |
| 19 to 25 Years | 27 (1.9%) | 1,432 (100.0%) |
| 25 to 34 Years | 80 (4.0%) | 1,859 (92.0%) |
| 35 to 44 Years | 65 (10.2%) | 561 (87.9%) |
| 45 to 54 Years | 34 (29.6%) | 63 (54.8%) |
| 55 to 64 Years | 0 (0.0%) | 96 (100.0%) |
| 65 to 74 Years | 0 (0.0%) | 0 (0.0%) |
| 75 Years and over | 0 (0.0%) | 0 (0.0%) |
| Total | 598 (6.5%) | 8,695 (94.6%) |
Disability Status by Sex by Age in Camp Pendleton South
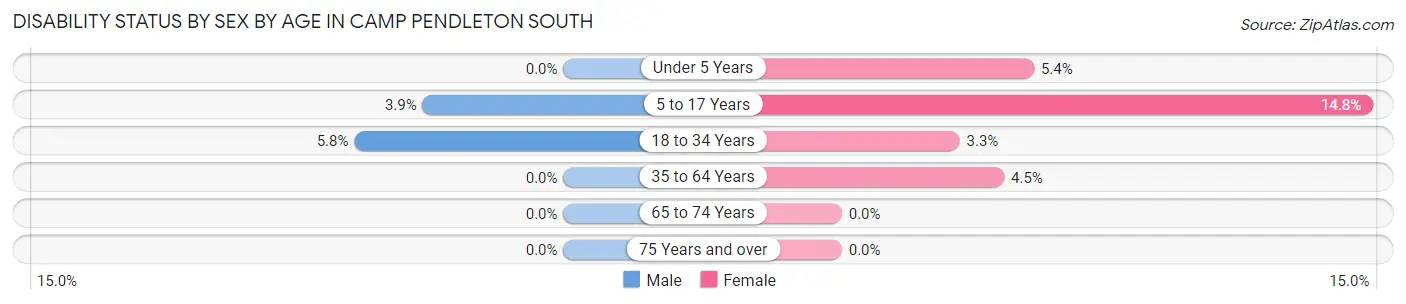
| Age Bracket | Male | Female |
| Under 5 Years | 0 (0.0%) | 70 (5.3%) |
| 5 to 17 Years | 53 (3.9%) | 168 (14.8%) |
| 18 to 34 Years | 27 (5.8%) | 98 (3.3%) |
| 35 to 64 Years | 0 (0.0%) | 34 (4.5%) |
| 65 to 74 Years | 0 (0.0%) | 0 (0.0%) |
| 75 Years and over | 0 (0.0%) | 0 (0.0%) |
Disability Class by Sex by Age in Camp Pendleton South
Disability Class: Hearing Difficulty
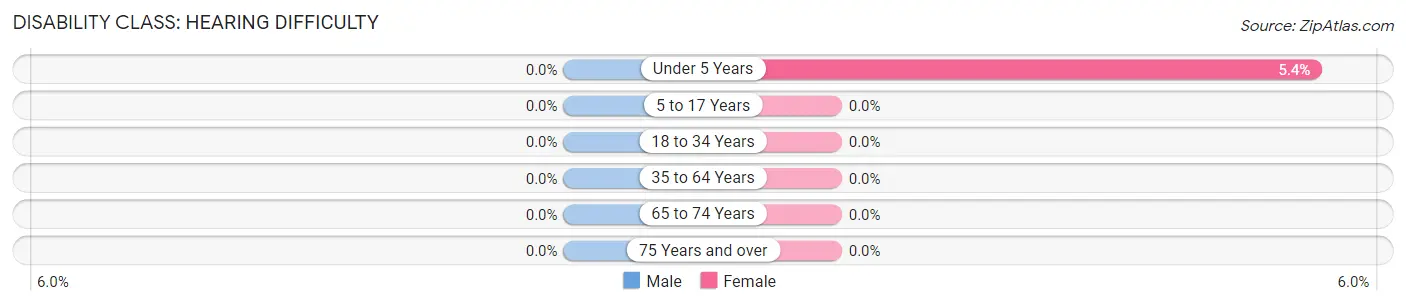
| Age Bracket | Male | Female |
| Under 5 Years | 0 (0.0%) | 70 (5.3%) |
| 5 to 17 Years | 0 (0.0%) | 0 (0.0%) |
| 18 to 34 Years | 0 (0.0%) | 0 (0.0%) |
| 35 to 64 Years | 0 (0.0%) | 0 (0.0%) |
| 65 to 74 Years | 0 (0.0%) | 0 (0.0%) |
| 75 Years and over | 0 (0.0%) | 0 (0.0%) |
Disability Class: Vision Difficulty
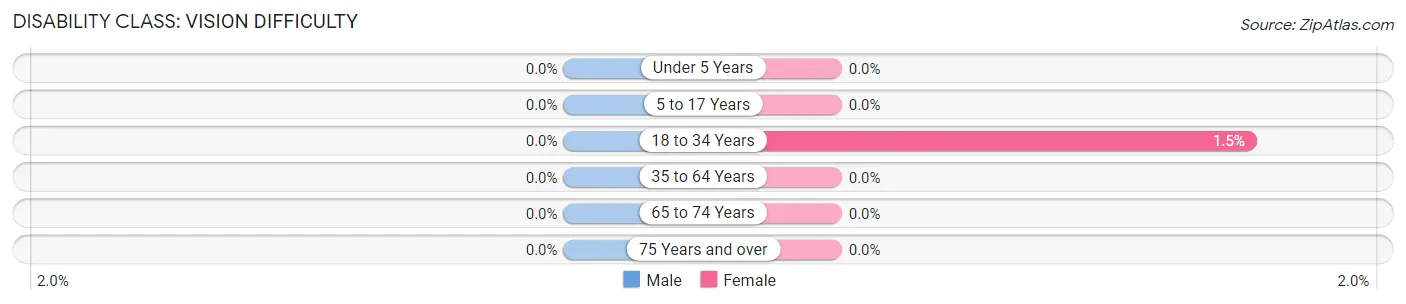
| Age Bracket | Male | Female |
| Under 5 Years | 0 (0.0%) | 0 (0.0%) |
| 5 to 17 Years | 0 (0.0%) | 0 (0.0%) |
| 18 to 34 Years | 0 (0.0%) | 46 (1.5%) |
| 35 to 64 Years | 0 (0.0%) | 0 (0.0%) |
| 65 to 74 Years | 0 (0.0%) | 0 (0.0%) |
| 75 Years and over | 0 (0.0%) | 0 (0.0%) |
Disability Class: Cognitive Difficulty
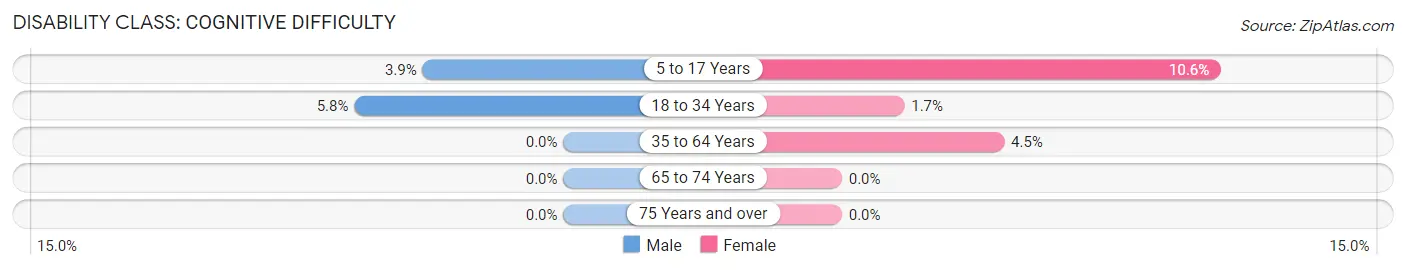
| Age Bracket | Male | Female |
| 5 to 17 Years | 53 (3.9%) | 120 (10.6%) |
| 18 to 34 Years | 27 (5.8%) | 52 (1.7%) |
| 35 to 64 Years | 0 (0.0%) | 34 (4.5%) |
| 65 to 74 Years | 0 (0.0%) | 0 (0.0%) |
| 75 Years and over | 0 (0.0%) | 0 (0.0%) |
Disability Class: Ambulatory Difficulty
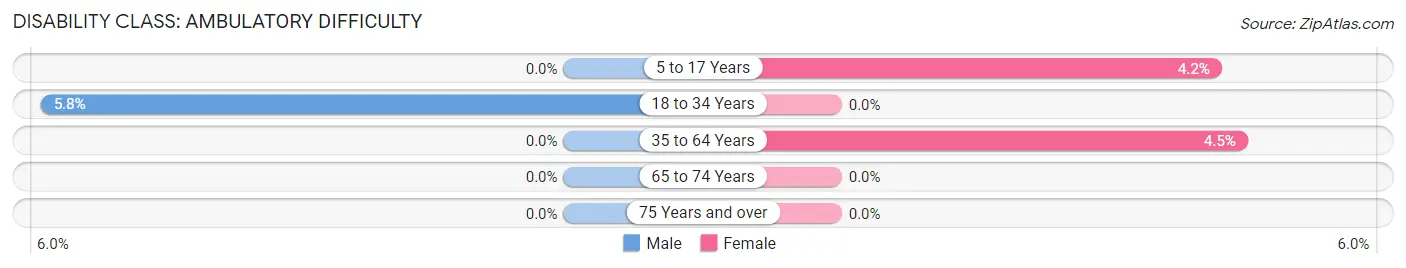
| Age Bracket | Male | Female |
| 5 to 17 Years | 0 (0.0%) | 48 (4.2%) |
| 18 to 34 Years | 27 (5.8%) | 0 (0.0%) |
| 35 to 64 Years | 0 (0.0%) | 34 (4.5%) |
| 65 to 74 Years | 0 (0.0%) | 0 (0.0%) |
| 75 Years and over | 0 (0.0%) | 0 (0.0%) |
Disability Class: Self-Care Difficulty
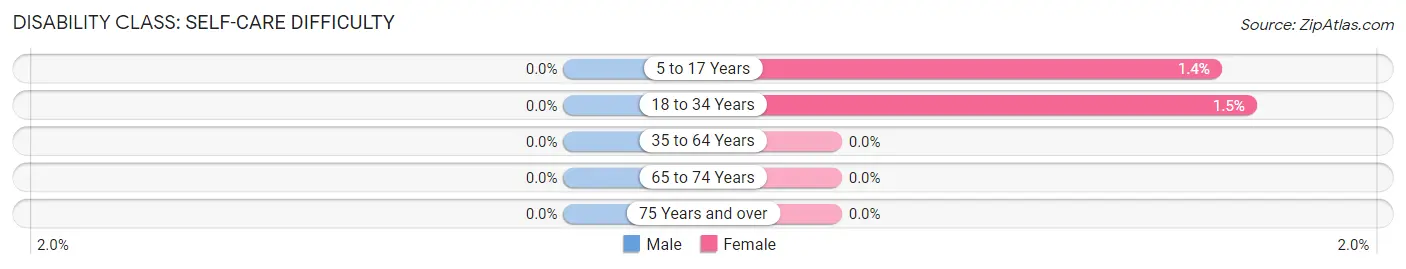
| Age Bracket | Male | Female |
| 5 to 17 Years | 0 (0.0%) | 16 (1.4%) |
| 18 to 34 Years | 0 (0.0%) | 46 (1.5%) |
| 35 to 64 Years | 0 (0.0%) | 0 (0.0%) |
| 65 to 74 Years | 0 (0.0%) | 0 (0.0%) |
| 75 Years and over | 0 (0.0%) | 0 (0.0%) |
Technology Access in Camp Pendleton South
Computing Device Access in Camp Pendleton South
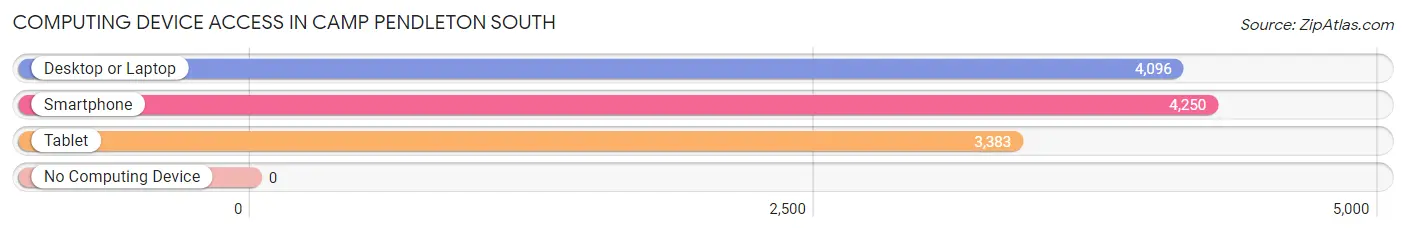
| Device Type | # Households | % Households |
| Desktop or Laptop | 4,096 | 96.4% |
| Smartphone | 4,250 | 100.0% |
| Tablet | 3,383 | 79.6% |
| No Computing Device | 0 | 0.0% |
| Total | 4,250 | 100.0% |
Internet Access in Camp Pendleton South
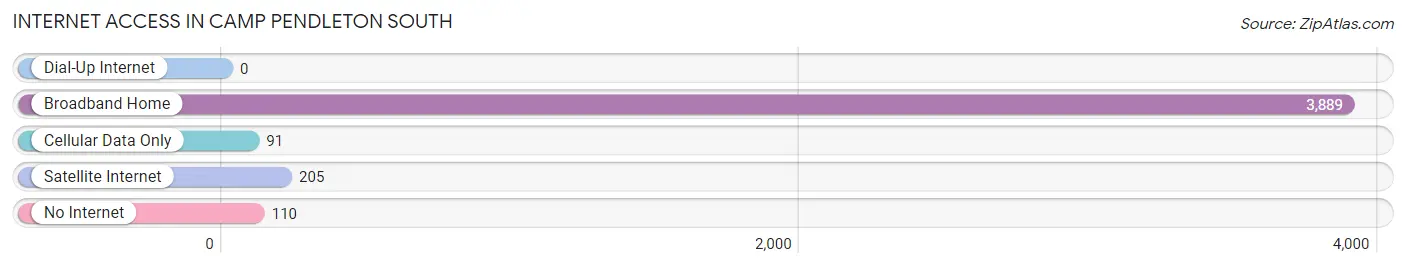
| Internet Type | # Households | % Households |
| Dial-Up Internet | 0 | 0.0% |
| Broadband Home | 3,889 | 91.5% |
| Cellular Data Only | 91 | 2.1% |
| Satellite Internet | 205 | 4.8% |
| No Internet | 110 | 2.6% |
| Total | 4,250 | 100.0% |
Camp Pendleton South Summary
Pendleton South, California is a small unincorporated community located in San Diego County, California. It is located on the northern edge of the Marine Corps Base Camp Pendleton, which is the largest United States Marine Corps base on the West Coast. The community is located approximately 25 miles north of San Diego and is home to approximately 1,500 people.
History
The area that is now Camp Pendleton South was originally inhabited by the Luiseño people, who were part of the larger Kumeyaay Nation. The area was first explored by Europeans in 1769, when Spanish explorer Gaspar de Portolà and his expedition passed through the area. The area was later used as a cattle ranch by the Mexican government, and in 1846, the United States acquired the area as part of the Treaty of Guadalupe Hidalgo.
In 1942, the United States Marine Corps acquired the land that is now Camp Pendleton South and established the Marine Corps Base Camp Pendleton. The base was used as a training facility for the Marines during World War II and the Korean War. In the 1950s, the base was expanded to include a housing area for military personnel and their families. This area was later incorporated as the community of Camp Pendleton South.
Geography
Camp Pendleton South is located in San Diego County, California, approximately 25 miles north of San Diego. The community is located on the northern edge of the Marine Corps Base Camp Pendleton, which covers an area of 125,000 acres. The community is bordered by the San Luis Rey River to the east and the Pacific Ocean to the west. The climate in the area is Mediterranean, with mild winters and warm, dry summers.
Economy
The economy of Camp Pendleton South is largely dependent on the Marine Corps Base Camp Pendleton. The base is the largest United States Marine Corps base on the West Coast and is home to approximately 40,000 active duty personnel and their families. The base is also home to a variety of businesses, including retail stores, restaurants, and other services.
Demographics
As of the 2010 census, the population of Camp Pendleton South was 1,500. The racial makeup of the community was 79.3% White, 8.3% African American, 0.7% Native American, 4.7% Asian, 0.3% Pacific Islander, and 6.0% from other races. The median household income in the community was $45,000, and the median age was 33. The majority of the population (90%) was employed, and the unemployment rate was 4.3%. The majority of the population (90%) was married, and the median age of marriage was 28.
Common Questions
What is Per Capita Income in Camp Pendleton South?
Per Capita income in Camp Pendleton South is $23,059.
What is the Median Family Income in Camp Pendleton South?
Median Family Income in Camp Pendleton South is $63,086.
What is the Median Household income in Camp Pendleton South?
Median Household Income in Camp Pendleton South is $62,020.
What is Income or Wage Gap in Camp Pendleton South?
Income or Wage Gap in Camp Pendleton South is 43.0%.
Women in Camp Pendleton South earn 57.0 cents for every dollar earned by a man.
What is Inequality or Gini Index in Camp Pendleton South?
Inequality or Gini Index in Camp Pendleton South is 0.31.
What is the Total Population of Camp Pendleton South?
Total Population of Camp Pendleton South is 13,936.
What is the Total Male Population of Camp Pendleton South?
Total Male Population of Camp Pendleton South is 7,434.
What is the Total Female Population of Camp Pendleton South?
Total Female Population of Camp Pendleton South is 6,502.
What is the Ratio of Males per 100 Females in Camp Pendleton South?
There are 114.33 Males per 100 Females in Camp Pendleton South.
What is the Ratio of Females per 100 Males in Camp Pendleton South?
There are 87.46 Females per 100 Males in Camp Pendleton South.
What is the Median Population Age in Camp Pendleton South?
Median Population Age in Camp Pendleton South is 23.0 Years.
What is the Average Family Size in Camp Pendleton South
Average Family Size in Camp Pendleton South is 3.2 People.
What is the Average Household Size in Camp Pendleton South
Average Household Size in Camp Pendleton South is 3.1 People.
How Large is the Labor Force in Camp Pendleton South?
There are 7,340 People in the Labor Forcein in Camp Pendleton South.
What is the Percentage of People in the Labor Force in Camp Pendleton South?
79.7% of People are in the Labor Force in Camp Pendleton South.
What is the Unemployment Rate in Camp Pendleton South?
Unemployment Rate in Camp Pendleton South is 19.6%.