Anchor Bay, CA Map & Demographics
Anchor Bay Map
Anchor Bay Overview
$44,983
PER CAPITA INCOME
$79,398
AVG FAMILY INCOME
$68,452
AVG HOUSEHOLD INCOME
0.22
INEQUALITY / GINI INDEX
369
TOTAL POPULATION
156
MALE POPULATION
213
FEMALE POPULATION
73.24
MALES / 100 FEMALES
136.54
FEMALES / 100 MALES
63.9
MEDIAN AGE
1.9
AVG FAMILY SIZE
1.5
AVG HOUSEHOLD SIZE
158
LABOR FORCE [ PEOPLE ]
42.8%
PERCENT IN LABOR FORCE
Income in Anchor Bay
Income Overview in Anchor Bay
Per Capita Income in Anchor Bay is $44,983, while median incomes of families and households are $79,398 and $68,452 respectively.
| Characteristic | Number | Measure |
| Per Capita Income | 369 | $44,983 |
| Median Family Income | 83 | $79,398 |
| Mean Family Income | 83 | $78,864 |
| Median Household Income | 252 | $68,452 |
| Mean Household Income | 252 | $67,274 |
| Income Deficit | 83 | $0 |
| Wage / Income Gap (%) | 369 | 0.00% |
| Wage / Income Gap ($) | 369 | 100.00¢ per $1 |
| Gini / Inequality Index | 369 | 0.22 |
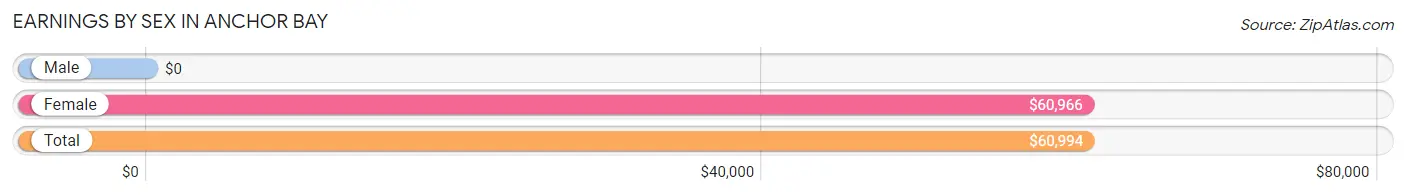
Earnings by Sex in Anchor Bay
| Sex | Number | Average Earnings |
| Male | 44 (21.8%) | $0 |
| Female | 158 (78.2%) | $60,966 |
| Total | 202 (100.0%) | $60,994 |
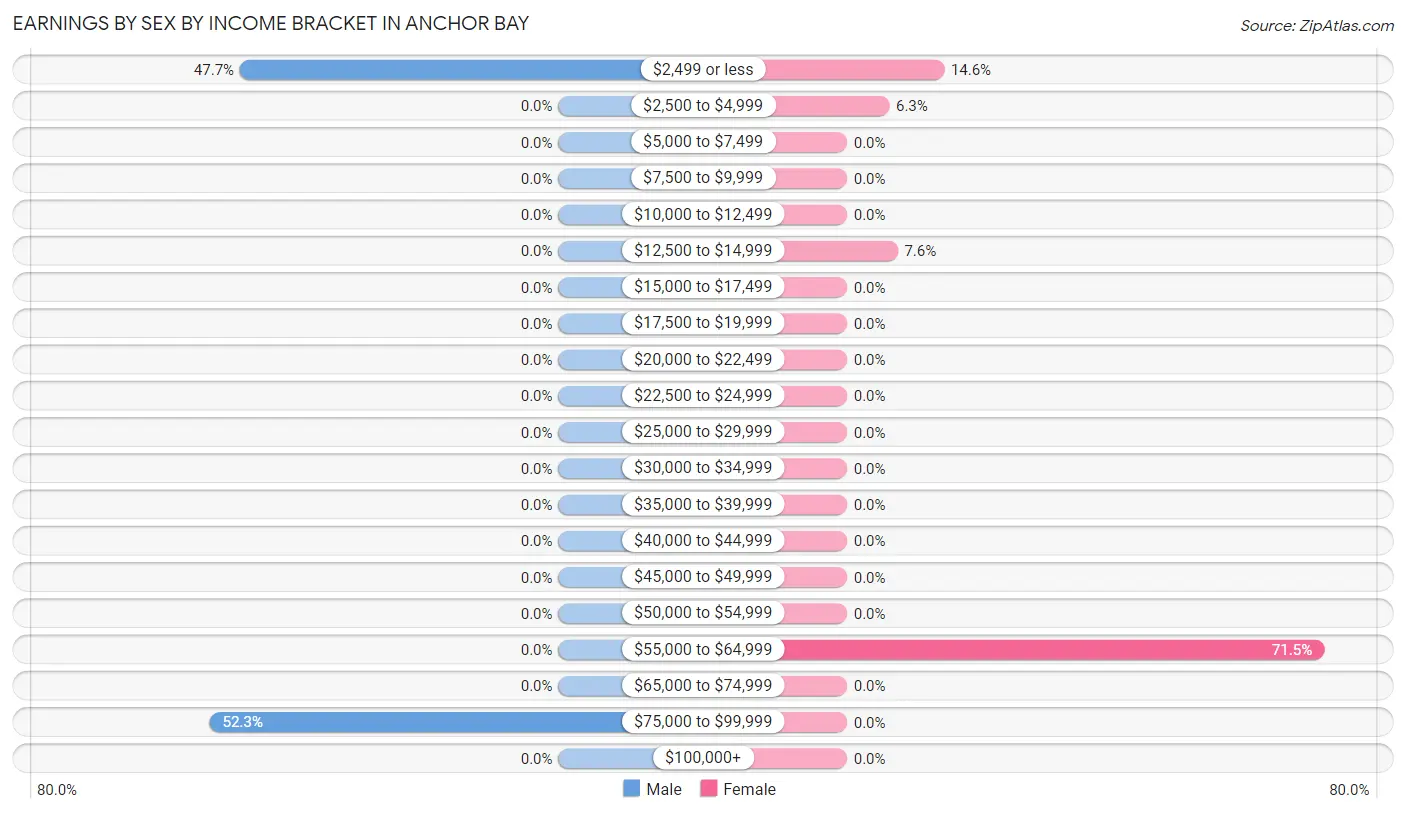
Earnings by Sex by Income Bracket in Anchor Bay
The most common earnings brackets in Anchor Bay are $75,000 to $99,999 for men (23 | 52.3%) and $55,000 to $64,999 for women (113 | 71.5%).
| Income | Male | Female |
| $2,499 or less | 21 (47.7%) | 23 (14.6%) |
| $2,500 to $4,999 | 0 (0.0%) | 10 (6.3%) |
| $5,000 to $7,499 | 0 (0.0%) | 0 (0.0%) |
| $7,500 to $9,999 | 0 (0.0%) | 0 (0.0%) |
| $10,000 to $12,499 | 0 (0.0%) | 0 (0.0%) |
| $12,500 to $14,999 | 0 (0.0%) | 12 (7.6%) |
| $15,000 to $17,499 | 0 (0.0%) | 0 (0.0%) |
| $17,500 to $19,999 | 0 (0.0%) | 0 (0.0%) |
| $20,000 to $22,499 | 0 (0.0%) | 0 (0.0%) |
| $22,500 to $24,999 | 0 (0.0%) | 0 (0.0%) |
| $25,000 to $29,999 | 0 (0.0%) | 0 (0.0%) |
| $30,000 to $34,999 | 0 (0.0%) | 0 (0.0%) |
| $35,000 to $39,999 | 0 (0.0%) | 0 (0.0%) |
| $40,000 to $44,999 | 0 (0.0%) | 0 (0.0%) |
| $45,000 to $49,999 | 0 (0.0%) | 0 (0.0%) |
| $50,000 to $54,999 | 0 (0.0%) | 0 (0.0%) |
| $55,000 to $64,999 | 0 (0.0%) | 113 (71.5%) |
| $65,000 to $74,999 | 0 (0.0%) | 0 (0.0%) |
| $75,000 to $99,999 | 23 (52.3%) | 0 (0.0%) |
| $100,000+ | 0 (0.0%) | 0 (0.0%) |
| Total | 44 (100.0%) | 158 (100.0%) |
Earnings by Sex by Educational Attainment in Anchor Bay
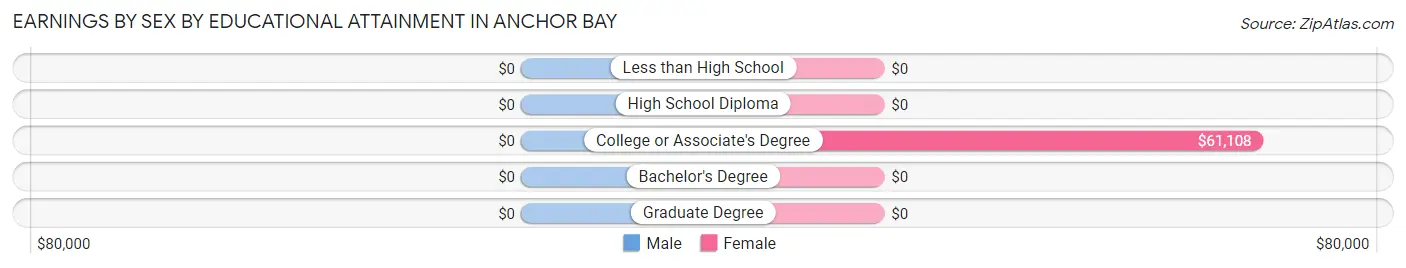
| Educational Attainment | Male Income | Female Income |
| Less than High School | - | - |
| High School Diploma | - | - |
| College or Associate's Degree | - | - |
| Bachelor's Degree | - | - |
| Graduate Degree | - | - |
| Total | - | - |
Family Income in Anchor Bay
Family Income Brackets in Anchor Bay
According to the Anchor Bay family income data, there are 62 families falling into the $75,000 to $99,999 income range, which is the most common income bracket and makes up 74.7% of all families.
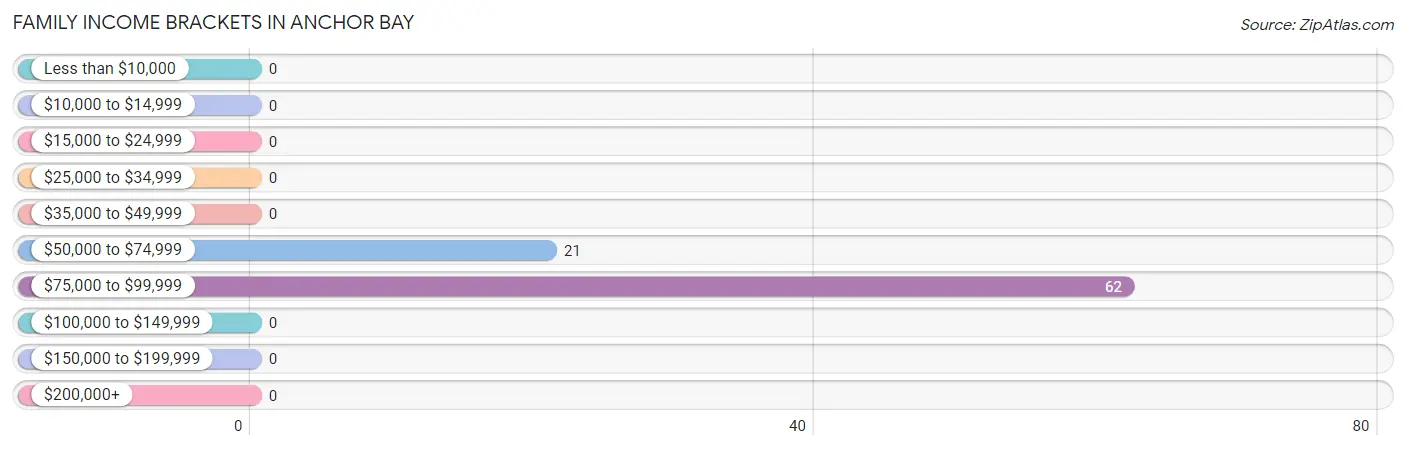
| Income Bracket | # Families | % Families |
| Less than $10,000 | 0 | 0.0% |
| $10,000 to $14,999 | 0 | 0.0% |
| $15,000 to $24,999 | 0 | 0.0% |
| $25,000 to $34,999 | 0 | 0.0% |
| $35,000 to $49,999 | 0 | 0.0% |
| $50,000 to $74,999 | 21 | 25.3% |
| $75,000 to $99,999 | 62 | 74.7% |
| $100,000 to $149,999 | 0 | 0.0% |
| $150,000 to $199,999 | 0 | 0.0% |
| $200,000+ | 0 | 0.0% |
Family Income by Famaliy Size in Anchor Bay
2-person families (83 | 100.0%) account for the highest median family income in Anchor Bay with $79,398 per family, while 2-person families (83 | 100.0%) have the highest median income of $39,699 per family member.
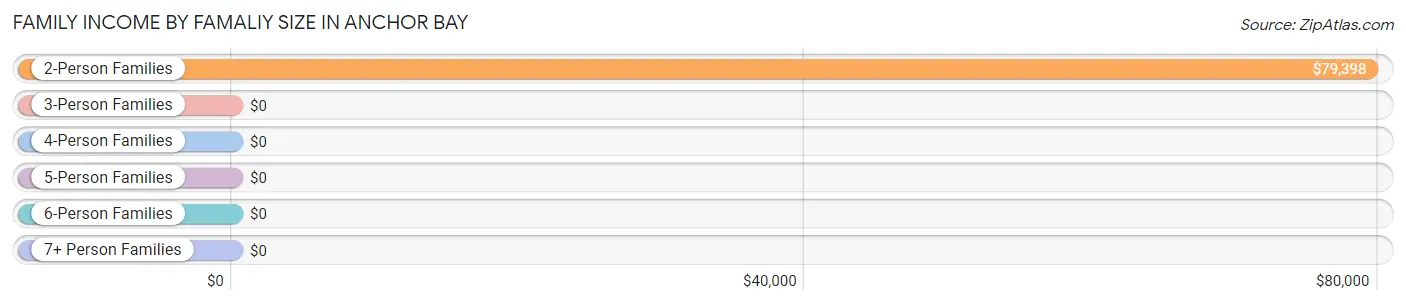
| Income Bracket | # Families | Median Income |
| 2-Person Families | 83 (100.0%) | $79,398 |
| 3-Person Families | 0 (0.0%) | $0 |
| 4-Person Families | 0 (0.0%) | $0 |
| 5-Person Families | 0 (0.0%) | $0 |
| 6-Person Families | 0 (0.0%) | $0 |
| 7+ Person Families | 0 (0.0%) | $0 |
| Total | 83 (100.0%) | $79,398 |
Family Income by Number of Earners in Anchor Bay
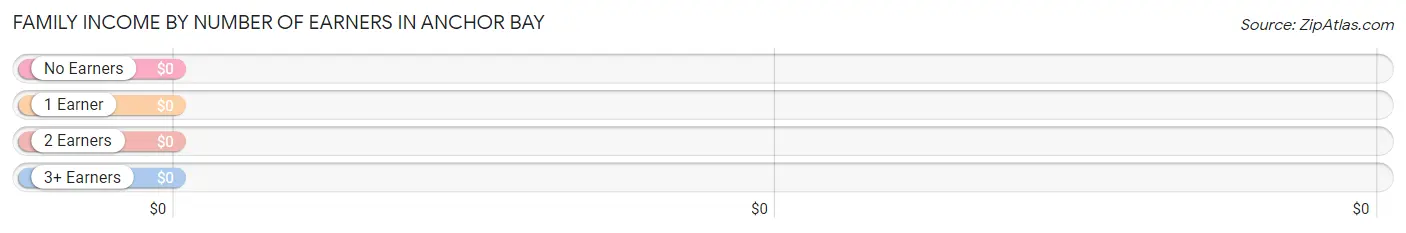
| Number of Earners | # Families | Median Income |
| No Earners | 27 (32.5%) | $0 |
| 1 Earner | 35 (42.2%) | $0 |
| 2 Earners | 21 (25.3%) | $0 |
| 3+ Earners | 0 (0.0%) | $0 |
| Total | 83 (100.0%) | $79,398 |
Household Income in Anchor Bay
Household Income Brackets in Anchor Bay
With 109 households falling in the category, the $50,000 to $74,999 income range is the most frequent in Anchor Bay, accounting for 43.2% of all households.
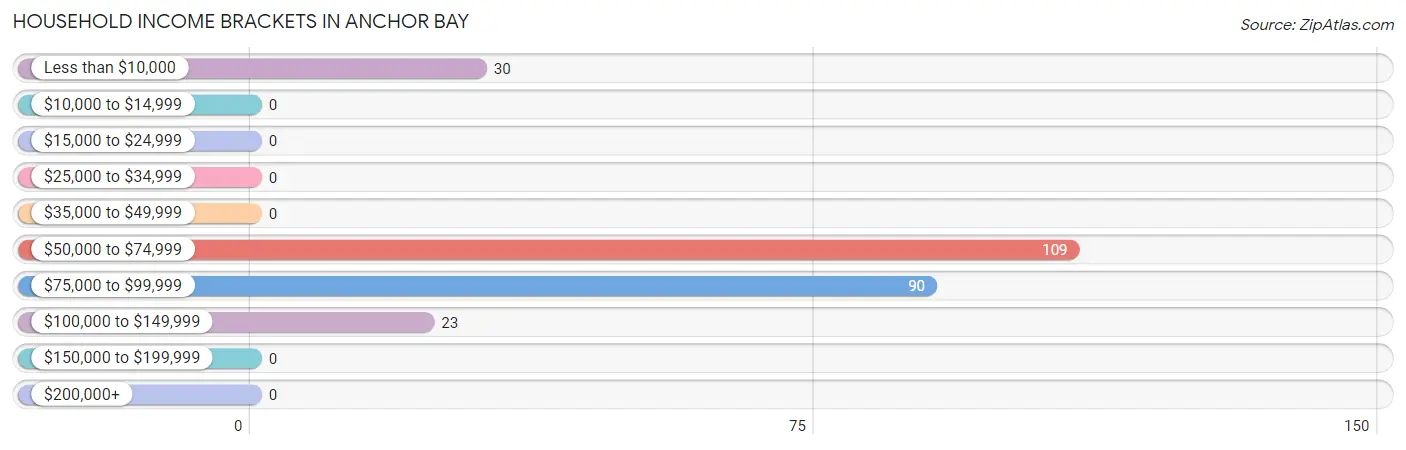
| Income Bracket | # Households | % Households |
| Less than $10,000 | 30 | 11.9% |
| $10,000 to $14,999 | 0 | 0.0% |
| $15,000 to $24,999 | 0 | 0.0% |
| $25,000 to $34,999 | 0 | 0.0% |
| $35,000 to $49,999 | 0 | 0.0% |
| $50,000 to $74,999 | 109 | 43.3% |
| $75,000 to $99,999 | 90 | 35.7% |
| $100,000 to $149,999 | 23 | 9.1% |
| $150,000 to $199,999 | 0 | 0.0% |
| $200,000+ | 0 | 0.0% |
Household Income by Householder Age in Anchor Bay
The median household income in Anchor Bay is $68,452, with the highest median household income of $79,074 found in the 65+ years age bracket for the primary householder. A total of 76 households (30.2%) fall into this category.
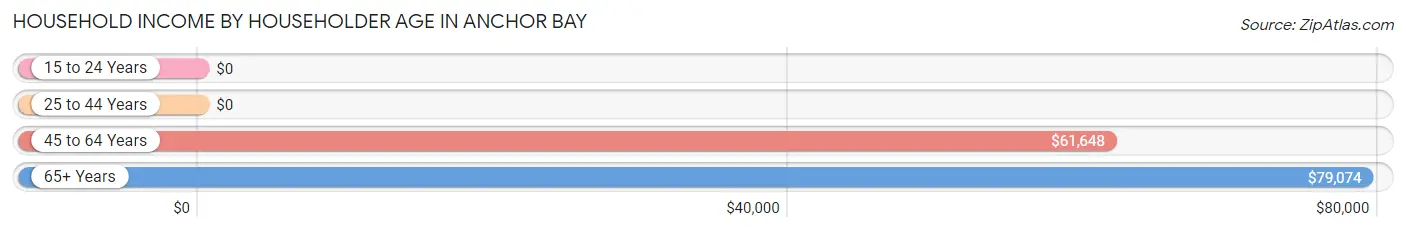
| Income Bracket | # Households | Median Income |
| 15 to 24 Years | 0 (0.0%) | $0 |
| 25 to 44 Years | 0 (0.0%) | $0 |
| 45 to 64 Years | 176 (69.8%) | $61,648 |
| 65+ Years | 76 (30.2%) | $79,074 |
| Total | 252 (100.0%) | $68,452 |
Poverty in Anchor Bay
Income Below Poverty by Sex and Age in Anchor Bay
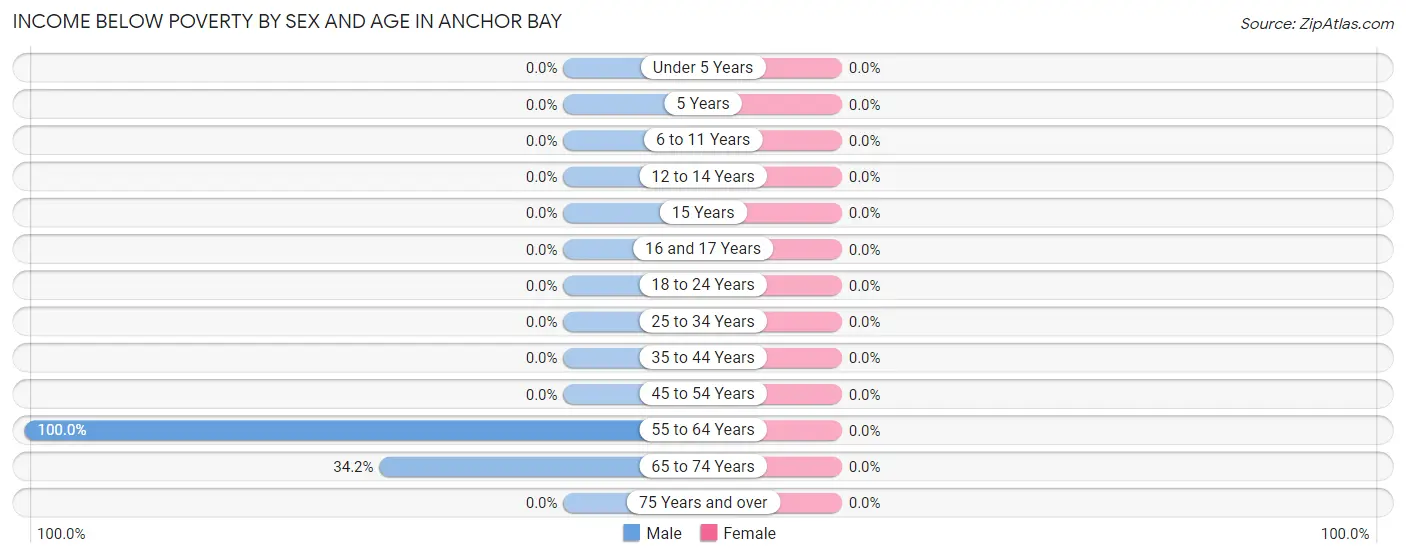
| Age Bracket | Male | Female |
| Under 5 Years | 0 (0.0%) | 0 (0.0%) |
| 5 Years | 0 (0.0%) | 0 (0.0%) |
| 6 to 11 Years | 0 (0.0%) | 0 (0.0%) |
| 12 to 14 Years | 0 (0.0%) | 0 (0.0%) |
| 15 Years | 0 (0.0%) | 0 (0.0%) |
| 16 and 17 Years | 0 (0.0%) | 0 (0.0%) |
| 18 to 24 Years | 0 (0.0%) | 0 (0.0%) |
| 25 to 34 Years | 0 (0.0%) | 0 (0.0%) |
| 35 to 44 Years | 0 (0.0%) | 0 (0.0%) |
| 45 to 54 Years | 0 (0.0%) | 0 (0.0%) |
| 55 to 64 Years | 30 (100.0%) | 0 (0.0%) |
| 65 to 74 Years | 28 (34.2%) | 0 (0.0%) |
| 75 Years and over | 0 (0.0%) | 0 (0.0%) |
| Total | 58 (37.2%) | 0 (0.0%) |
Income Above Poverty by Sex and Age in Anchor Bay
According to the poverty statistics in Anchor Bay, males aged 45 to 54 years and females aged 25 to 34 years are the age groups that are most secure financially, with 100.0% of males and 100.0% of females in these age groups living above the poverty line.
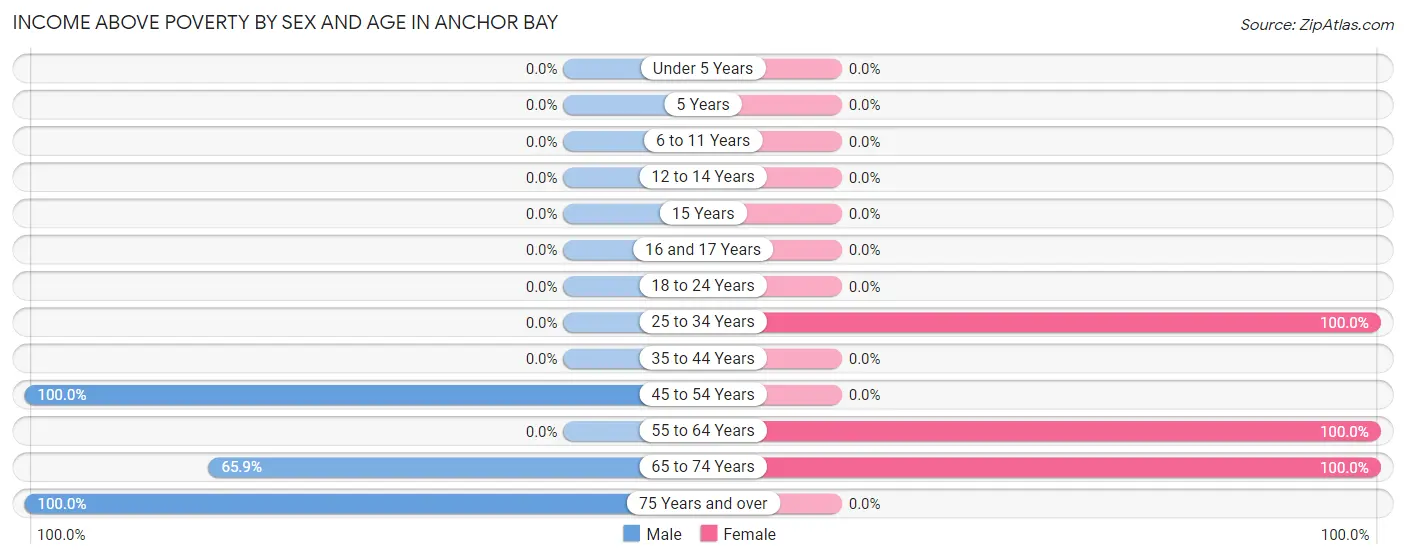
| Age Bracket | Male | Female |
| Under 5 Years | 0 (0.0%) | 0 (0.0%) |
| 5 Years | 0 (0.0%) | 0 (0.0%) |
| 6 to 11 Years | 0 (0.0%) | 0 (0.0%) |
| 12 to 14 Years | 0 (0.0%) | 0 (0.0%) |
| 15 Years | 0 (0.0%) | 0 (0.0%) |
| 16 and 17 Years | 0 (0.0%) | 0 (0.0%) |
| 18 to 24 Years | 0 (0.0%) | 0 (0.0%) |
| 25 to 34 Years | 0 (0.0%) | 12 (100.0%) |
| 35 to 44 Years | 0 (0.0%) | 0 (0.0%) |
| 45 to 54 Years | 23 (100.0%) | 0 (0.0%) |
| 55 to 64 Years | 0 (0.0%) | 123 (100.0%) |
| 65 to 74 Years | 54 (65.8%) | 78 (100.0%) |
| 75 Years and over | 21 (100.0%) | 0 (0.0%) |
| Total | 98 (62.8%) | 213 (100.0%) |
Income Below Poverty Among Married-Couple Families in Anchor Bay
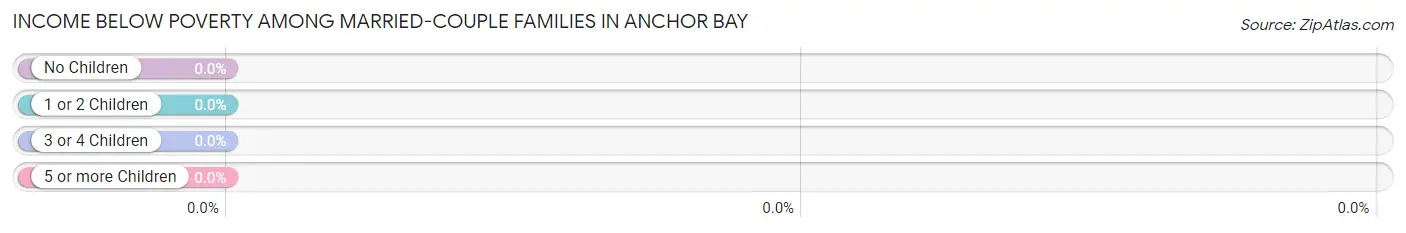
| Children | Above Poverty | Below Poverty |
| No Children | 83 (100.0%) | 0 (0.0%) |
| 1 or 2 Children | 0 (0.0%) | 0 (0.0%) |
| 3 or 4 Children | 0 (0.0%) | 0 (0.0%) |
| 5 or more Children | 0 (0.0%) | 0 (0.0%) |
| Total | 83 (100.0%) | 0 (0.0%) |
Income Below Poverty Among Single-Parent Households in Anchor Bay
| Children | Single Father | Single Mother |
| No Children | 0 (0.0%) | 0 (0.0%) |
| 1 or 2 Children | 0 (0.0%) | 0 (0.0%) |
| 3 or 4 Children | 0 (0.0%) | 0 (0.0%) |
| 5 or more Children | 0 (0.0%) | 0 (0.0%) |
| Total | 0 (0.0%) | 0 (0.0%) |
Income Below Poverty Among Married-Couple vs Single-Parent Households in Anchor Bay
| Children | Married-Couple Families | Single-Parent Households |
| No Children | 0 (0.0%) | 0 (0.0%) |
| 1 or 2 Children | 0 (0.0%) | 0 (0.0%) |
| 3 or 4 Children | 0 (0.0%) | 0 (0.0%) |
| 5 or more Children | 0 (0.0%) | 0 (0.0%) |
| Total | 0 (0.0%) | 0 (0.0%) |
Race in Anchor Bay
The most populous races in Anchor Bay are White / Caucasian (332 | 90.0%), Hispanic or Latino (55 | 14.9%), and Two or more Races (37 | 10.0%).
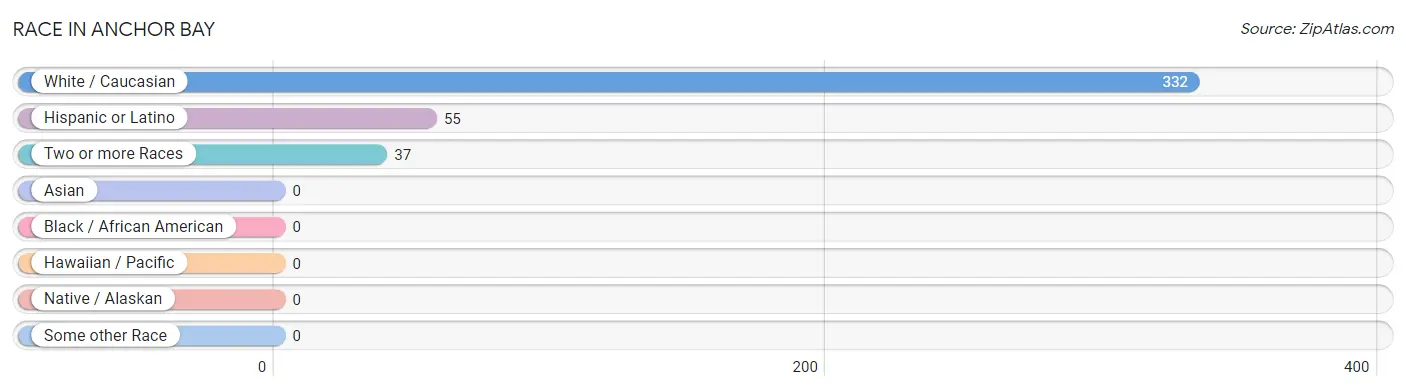
| Race | # Population | % Population |
| Asian | 0 | 0.0% |
| Black / African American | 0 | 0.0% |
| Hawaiian / Pacific | 0 | 0.0% |
| Hispanic or Latino | 55 | 14.9% |
| Native / Alaskan | 0 | 0.0% |
| White / Caucasian | 332 | 90.0% |
| Two or more Races | 37 | 10.0% |
| Some other Race | 0 | 0.0% |
| Total | 369 | 100.0% |
Ancestry in Anchor Bay
The most populous ancestries reported in Anchor Bay are German (86 | 23.3%), Spaniard (55 | 14.9%), English (37 | 10.0%), Irish (37 | 10.0%), and Italian (30 | 8.1%), together accounting for 66.4% of all Anchor Bay residents.
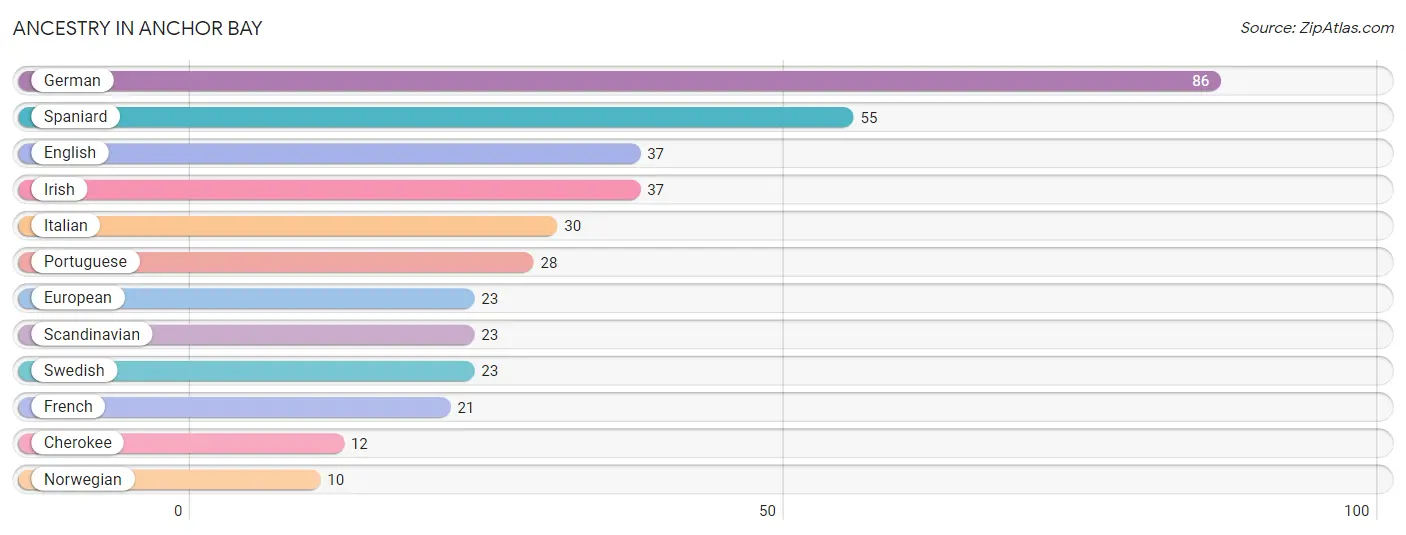
| Ancestry | # Population | % Population |
| Cherokee | 12 | 3.3% |
| English | 37 | 10.0% |
| European | 23 | 6.2% |
| French | 21 | 5.7% |
| German | 86 | 23.3% |
| Irish | 37 | 10.0% |
| Italian | 30 | 8.1% |
| Norwegian | 10 | 2.7% |
| Portuguese | 28 | 7.6% |
| Scandinavian | 23 | 6.2% |
| Spaniard | 55 | 14.9% |
| Swedish | 23 | 6.2% | View All 12 Rows |
Immigrants in Anchor Bay
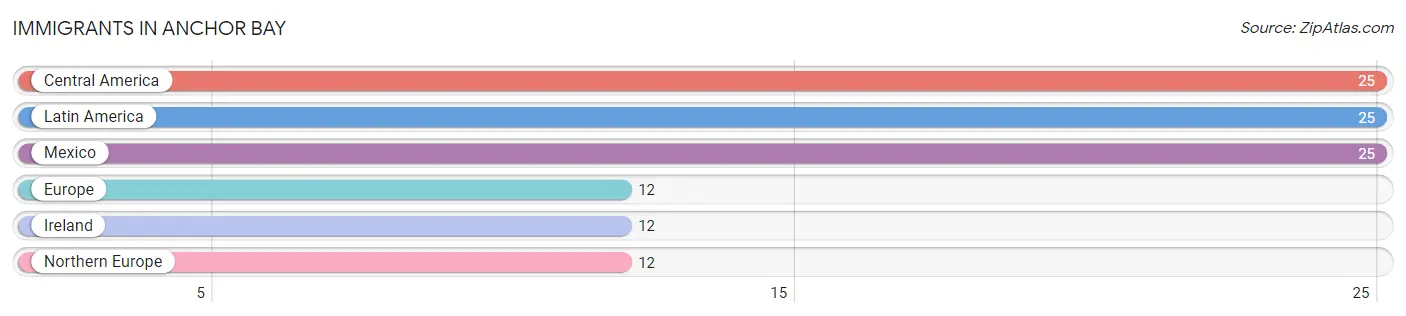
The most numerous immigrant groups reported in Anchor Bay came from Central America (25 | 6.8%), Latin America (25 | 6.8%), Mexico (25 | 6.8%), Europe (12 | 3.3%), and Ireland (12 | 3.3%), together accounting for 26.8% of all Anchor Bay residents.
| Immigration Origin | # Population | % Population |
| Central America | 25 | 6.8% |
| Europe | 12 | 3.3% |
| Ireland | 12 | 3.3% |
| Latin America | 25 | 6.8% |
| Mexico | 25 | 6.8% |
| Northern Europe | 12 | 3.3% | View All 6 Rows |
Sex and Age in Anchor Bay
Sex and Age in Anchor Bay
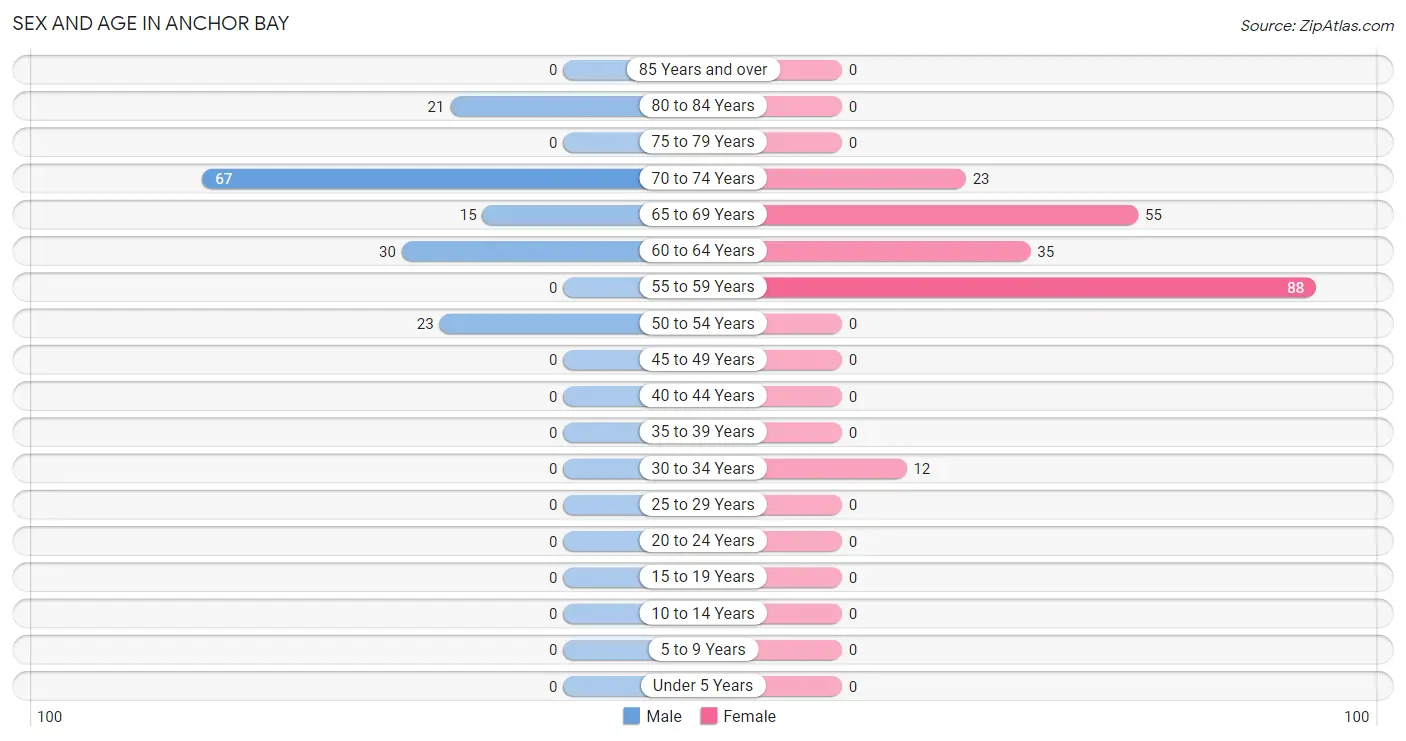
The most populous age groups in Anchor Bay are 70 to 74 Years (67 | 42.9%) for men and 55 to 59 Years (88 | 41.3%) for women.
| Age Bracket | Male | Female |
| Under 5 Years | 0 (0.0%) | 0 (0.0%) |
| 5 to 9 Years | 0 (0.0%) | 0 (0.0%) |
| 10 to 14 Years | 0 (0.0%) | 0 (0.0%) |
| 15 to 19 Years | 0 (0.0%) | 0 (0.0%) |
| 20 to 24 Years | 0 (0.0%) | 0 (0.0%) |
| 25 to 29 Years | 0 (0.0%) | 0 (0.0%) |
| 30 to 34 Years | 0 (0.0%) | 12 (5.6%) |
| 35 to 39 Years | 0 (0.0%) | 0 (0.0%) |
| 40 to 44 Years | 0 (0.0%) | 0 (0.0%) |
| 45 to 49 Years | 0 (0.0%) | 0 (0.0%) |
| 50 to 54 Years | 23 (14.7%) | 0 (0.0%) |
| 55 to 59 Years | 0 (0.0%) | 88 (41.3%) |
| 60 to 64 Years | 30 (19.2%) | 35 (16.4%) |
| 65 to 69 Years | 15 (9.6%) | 55 (25.8%) |
| 70 to 74 Years | 67 (42.9%) | 23 (10.8%) |
| 75 to 79 Years | 0 (0.0%) | 0 (0.0%) |
| 80 to 84 Years | 21 (13.5%) | 0 (0.0%) |
| 85 Years and over | 0 (0.0%) | 0 (0.0%) |
| Total | 156 (100.0%) | 213 (100.0%) |
Families and Households in Anchor Bay
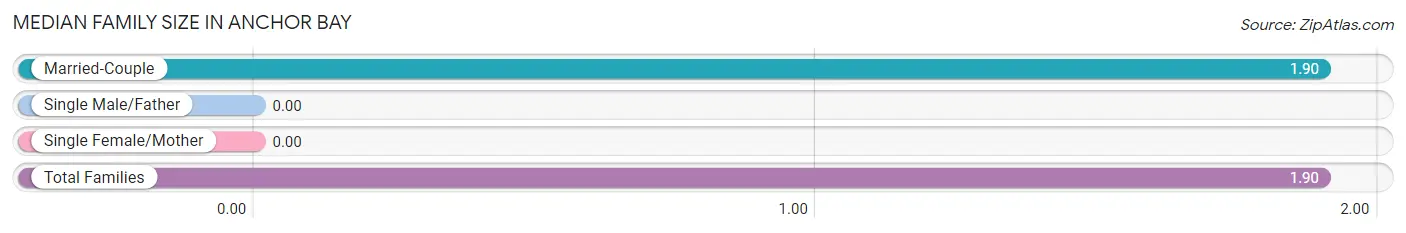
Median Family Size in Anchor Bay
| Family Type | # Families | Family Size |
| Married-Couple | 83 (100.0%) | 1.90 |
| Single Male/Father | 0 (0.0%) | - |
| Single Female/Mother | 0 (0.0%) | - |
| Total Families | 83 (100.0%) | 1.90 |
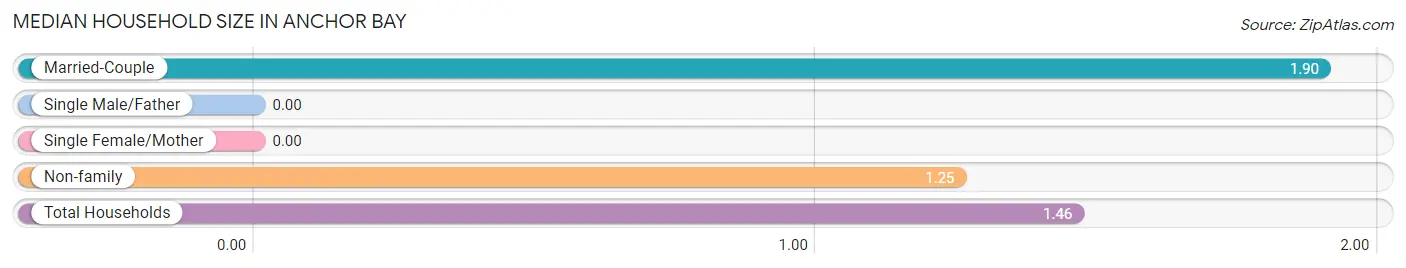
Median Household Size in Anchor Bay
| Household Type | # Households | Household Size |
| Married-Couple | 83 (32.9%) | 1.90 |
| Single Male/Father | 0 (0.0%) | - |
| Single Female/Mother | 0 (0.0%) | - |
| Non-family | 169 (67.1%) | 1.25 |
| Total Households | 252 (100.0%) | 1.46 |
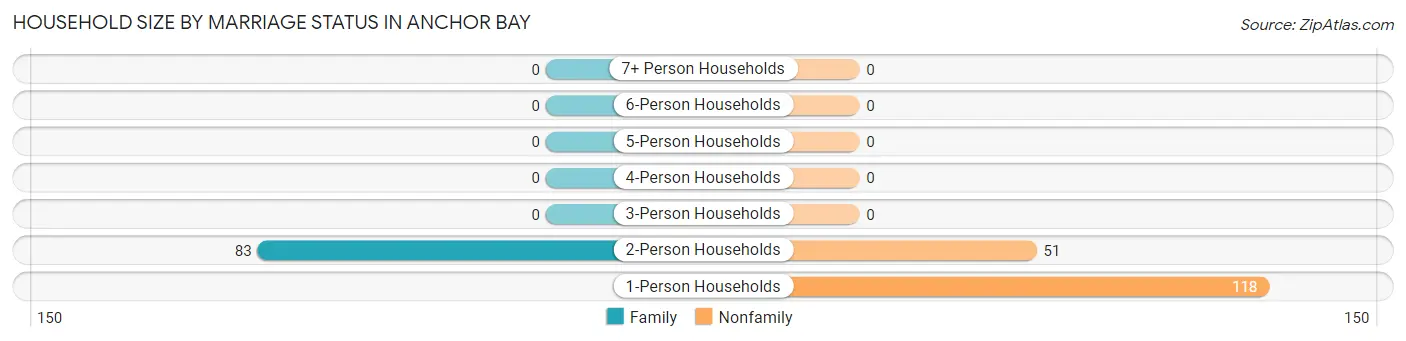
Household Size by Marriage Status in Anchor Bay
Out of a total of 252 households in Anchor Bay, 83 (32.9%) are family households, while 169 (67.1%) are nonfamily households. The most numerous type of family households are 2-person households, comprising 83, and the most common type of nonfamily households are 1-person households, comprising 118.
| Household Size | Family Households | Nonfamily Households |
| 1-Person Households | - | 118 (46.8%) |
| 2-Person Households | 83 (32.9%) | 51 (20.2%) |
| 3-Person Households | 0 (0.0%) | 0 (0.0%) |
| 4-Person Households | 0 (0.0%) | 0 (0.0%) |
| 5-Person Households | 0 (0.0%) | 0 (0.0%) |
| 6-Person Households | 0 (0.0%) | 0 (0.0%) |
| 7+ Person Households | 0 (0.0%) | 0 (0.0%) |
| Total | 83 (32.9%) | 169 (67.1%) |
Female Fertility in Anchor Bay
Fertility by Age in Anchor Bay
| Age Bracket | Women with Births | Births / 1,000 Women |
| 15 to 19 years | 0 (0.0%) | 0.0 |
| 20 to 34 years | 0 (0.0%) | 0.0 |
| 35 to 50 years | 0 (0.0%) | 0.0 |
| Total | 0 (0.0%) | 0.0 |
Fertility by Age by Marriage Status in Anchor Bay
| Age Bracket | Married | Unmarried |
| 15 to 19 years | 0 (0.0%) | 0 (0.0%) |
| 20 to 34 years | 0 (0.0%) | 0 (0.0%) |
| 35 to 50 years | 0 (0.0%) | 0 (0.0%) |
| Total | 0 (0.0%) | 0 (0.0%) |
Fertility by Education in Anchor Bay
| Educational Attainment | Women with Births | Births / 1,000 Women |
| Less than High School | 0 (0.0%) | 0.0 |
| High School Diploma | 0 (0.0%) | 0.0 |
| College or Associate's Degree | 0 (0.0%) | 0.0 |
| Bachelor's Degree | 0 (0.0%) | 0.0 |
| Graduate Degree | 0 (0.0%) | 0.0 |
| Total | 0 (0.0%) | 0.0 |
Fertility by Education by Marriage Status in Anchor Bay
| Educational Attainment | Married | Unmarried |
| Less than High School | 0 (0.0%) | 0 (0.0%) |
| High School Diploma | 0 (0.0%) | 0 (0.0%) |
| College or Associate's Degree | 0 (0.0%) | 0 (0.0%) |
| Bachelor's Degree | 0 (0.0%) | 0 (0.0%) |
| Graduate Degree | 0 (0.0%) | 0 (0.0%) |
| Total | 0 (0.0%) | 0 (0.0%) |
Employment Characteristics in Anchor Bay
Employment by Class of Employer in Anchor Bay
Among the 146 employed individuals in Anchor Bay, not-for-profit organizations (88 | 60.3%), private company employees (33 | 22.6%), and local government employees (25 | 17.1%) make up the most common classes of employment.
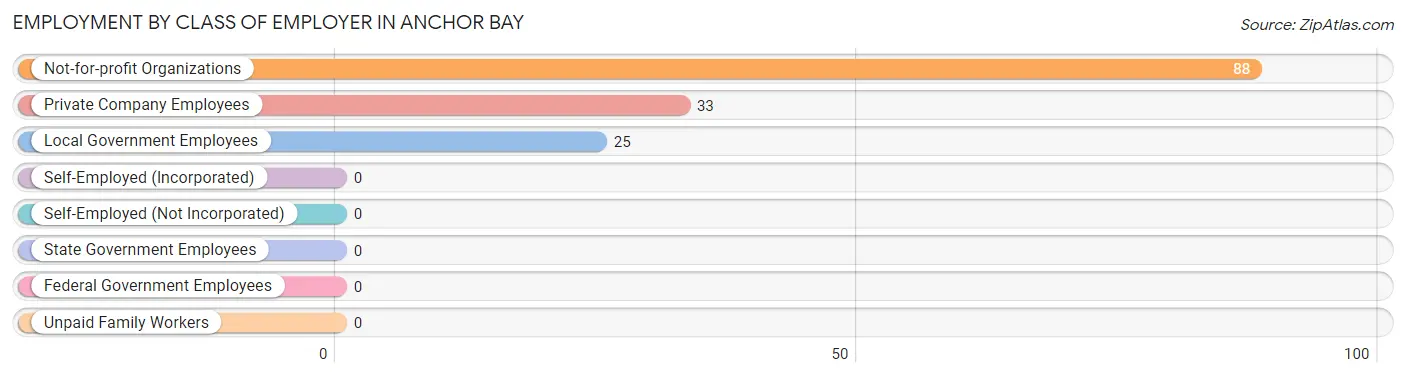
| Employer Class | # Employees | % Employees |
| Private Company Employees | 33 | 22.6% |
| Self-Employed (Incorporated) | 0 | 0.0% |
| Self-Employed (Not Incorporated) | 0 | 0.0% |
| Not-for-profit Organizations | 88 | 60.3% |
| Local Government Employees | 25 | 17.1% |
| State Government Employees | 0 | 0.0% |
| Federal Government Employees | 0 | 0.0% |
| Unpaid Family Workers | 0 | 0.0% |
| Total | 146 | 100.0% |
Employment Status by Age in Anchor Bay
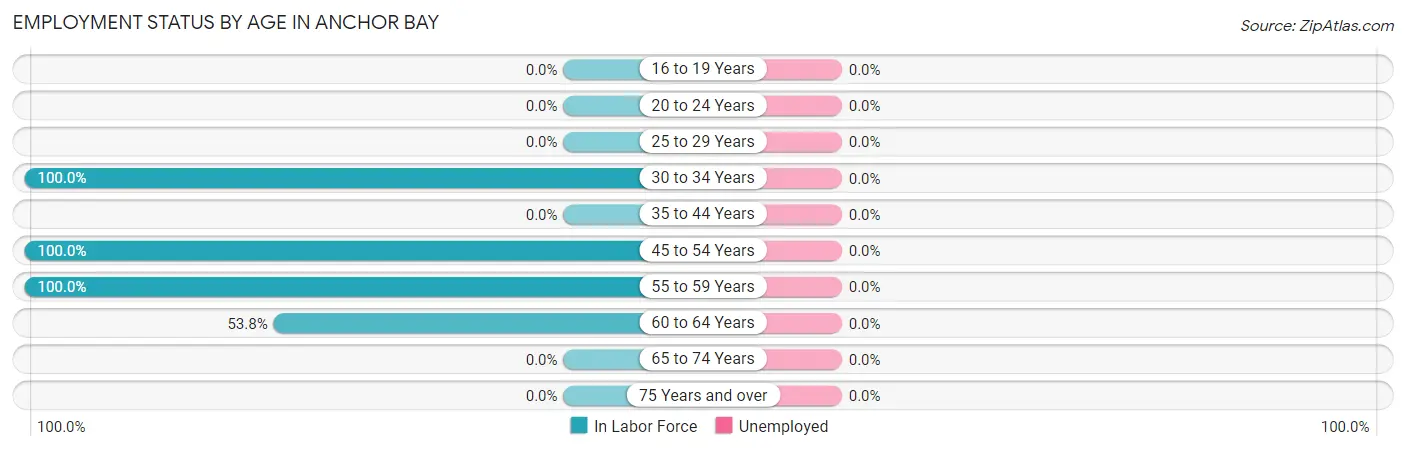
| Age Bracket | In Labor Force | Unemployed |
| 16 to 19 Years | 0 (0.0%) | 0 (0.0%) |
| 20 to 24 Years | 0 (0.0%) | 0 (0.0%) |
| 25 to 29 Years | 0 (0.0%) | 0 (0.0%) |
| 30 to 34 Years | 12 (100.0%) | 0 (0.0%) |
| 35 to 44 Years | 0 (0.0%) | 0 (0.0%) |
| 45 to 54 Years | 23 (100.0%) | 0 (0.0%) |
| 55 to 59 Years | 88 (100.0%) | 0 (0.0%) |
| 60 to 64 Years | 35 (53.8%) | 0 (0.0%) |
| 65 to 74 Years | 0 (0.0%) | 0 (0.0%) |
| 75 Years and over | 0 (0.0%) | 0 (0.0%) |
| Total | 158 (42.8%) | 0 (0.0%) |
Employment Status by Educational Attainment in Anchor Bay
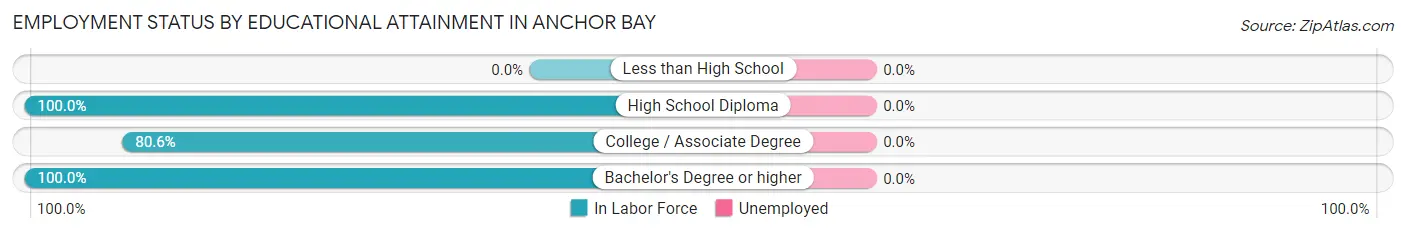
| Educational Attainment | In Labor Force | Unemployed |
| Less than High School | 0 (0.0%) | 0 (0.0%) |
| High School Diploma | 23 (100.0%) | 0 (0.0%) |
| College / Associate Degree | 125 (80.6%) | 0 (0.0%) |
| Bachelor's Degree or higher | 10 (100.0%) | 0 (0.0%) |
| Total | 158 (84.0%) | 0 (0.0%) |
Employment Occupations by Sex in Anchor Bay
Management, Business, Science and Arts Occupations
The most common Management, Business, Science and Arts occupations in Anchor Bay are Business & Financial (88 | 55.7%), and Management (10 | 6.3%).
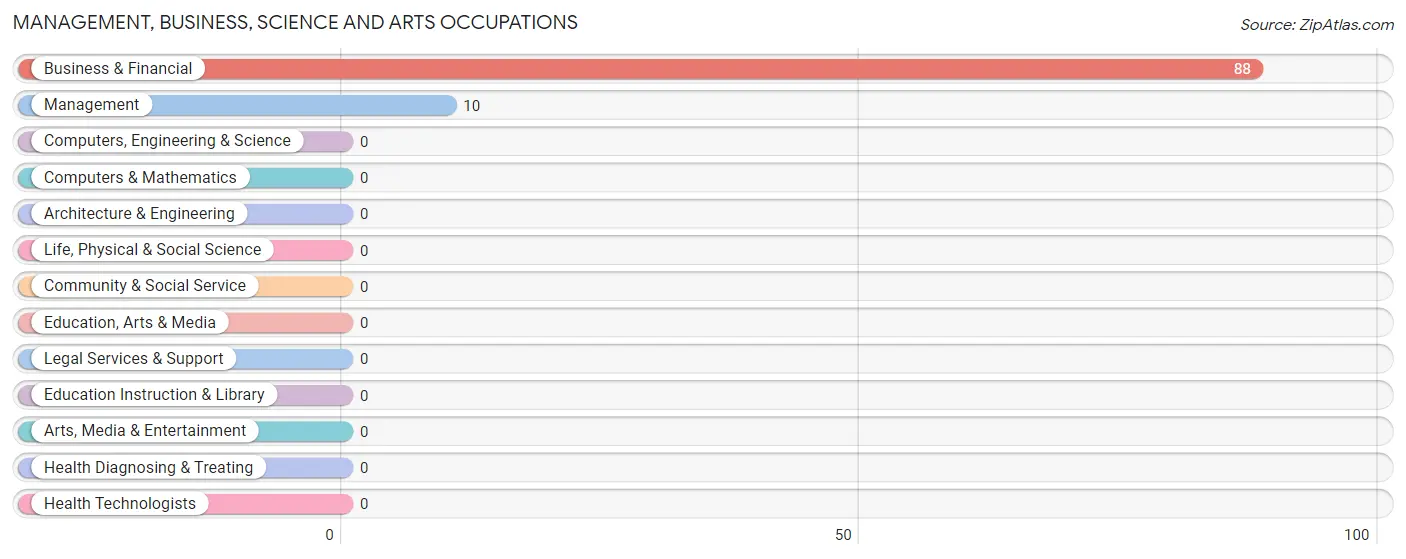
Management, Business, Science and Arts Occupations by Sex
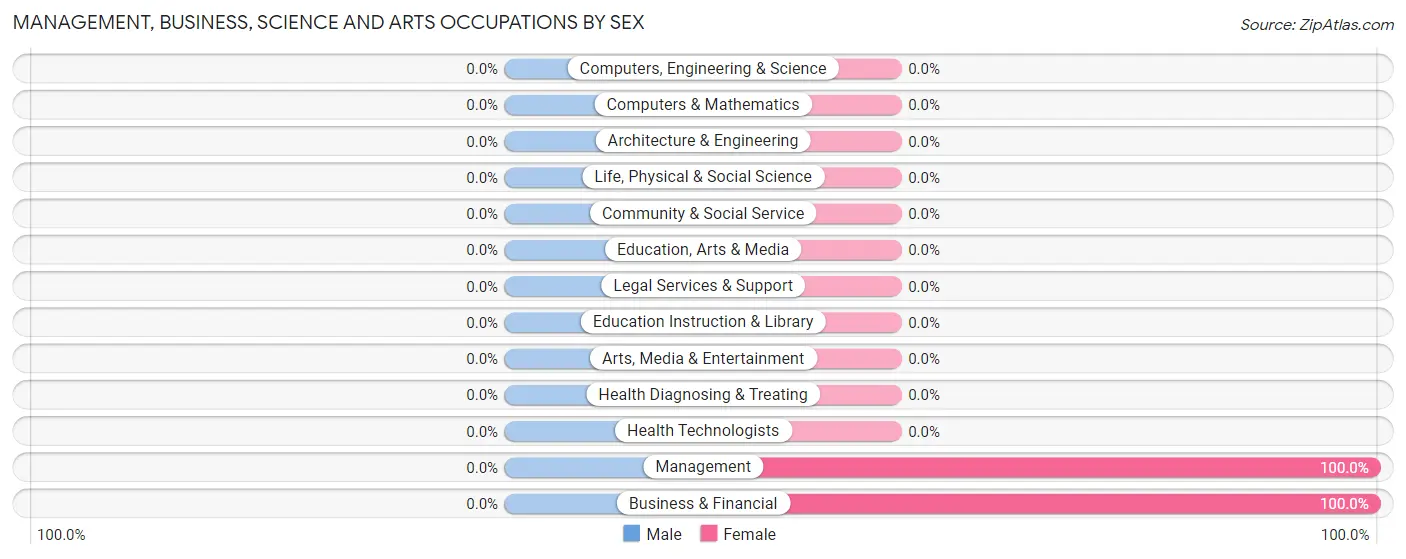
| Occupation | Male | Female |
| Management | 0 (0.0%) | 10 (100.0%) |
| Business & Financial | 0 (0.0%) | 88 (100.0%) |
| Computers, Engineering & Science | 0 (0.0%) | 0 (0.0%) |
| Computers & Mathematics | 0 (0.0%) | 0 (0.0%) |
| Architecture & Engineering | 0 (0.0%) | 0 (0.0%) |
| Life, Physical & Social Science | 0 (0.0%) | 0 (0.0%) |
| Community & Social Service | 0 (0.0%) | 0 (0.0%) |
| Education, Arts & Media | 0 (0.0%) | 0 (0.0%) |
| Legal Services & Support | 0 (0.0%) | 0 (0.0%) |
| Education Instruction & Library | 0 (0.0%) | 0 (0.0%) |
| Arts, Media & Entertainment | 0 (0.0%) | 0 (0.0%) |
| Health Diagnosing & Treating | 0 (0.0%) | 0 (0.0%) |
| Health Technologists | 0 (0.0%) | 0 (0.0%) |
| Total (Category) | 0 (0.0%) | 98 (100.0%) |
| Total (Overall) | 23 (14.6%) | 135 (85.4%) |
Services Occupations
The most common Services occupations in Anchor Bay are , and Food Preparation & Serving (12 | 7.6%).
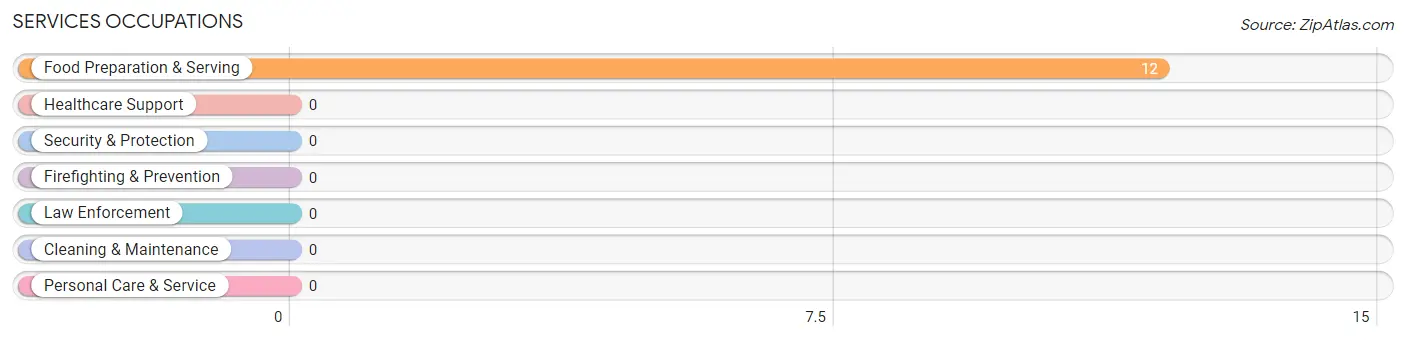
Services Occupations by Sex
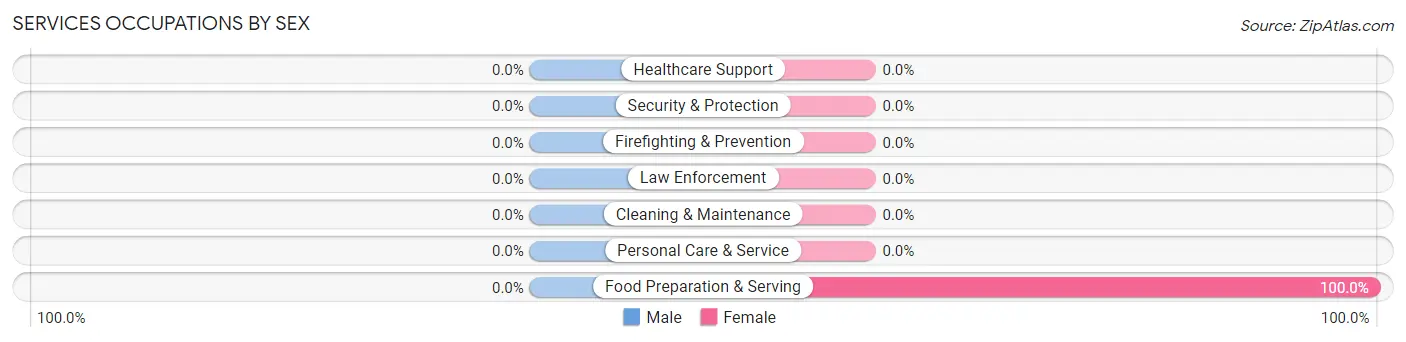
| Occupation | Male | Female |
| Healthcare Support | 0 (0.0%) | 0 (0.0%) |
| Security & Protection | 0 (0.0%) | 0 (0.0%) |
| Firefighting & Prevention | 0 (0.0%) | 0 (0.0%) |
| Law Enforcement | 0 (0.0%) | 0 (0.0%) |
| Food Preparation & Serving | 0 (0.0%) | 12 (100.0%) |
| Cleaning & Maintenance | 0 (0.0%) | 0 (0.0%) |
| Personal Care & Service | 0 (0.0%) | 0 (0.0%) |
| Total (Category) | 0 (0.0%) | 12 (100.0%) |
| Total (Overall) | 23 (14.6%) | 135 (85.4%) |
Sales and Office Occupations
Sales and Office Occupations by Sex
| Occupation | Male | Female |
| Sales & Related | 0 (0.0%) | 0 (0.0%) |
| Office & Administration | 0 (0.0%) | 0 (0.0%) |
| Total (Category) | 0 (0.0%) | 0 (0.0%) |
| Total (Overall) | 23 (14.6%) | 135 (85.4%) |
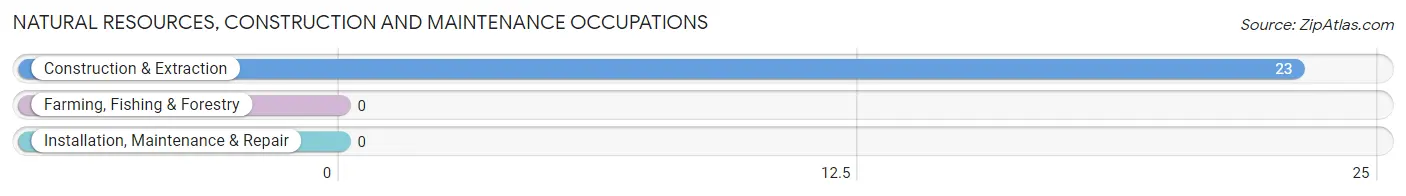
Natural Resources, Construction and Maintenance Occupations
The most common Natural Resources, Construction and Maintenance occupations in Anchor Bay are , and Construction & Extraction (23 | 14.6%).
Natural Resources, Construction and Maintenance Occupations by Sex
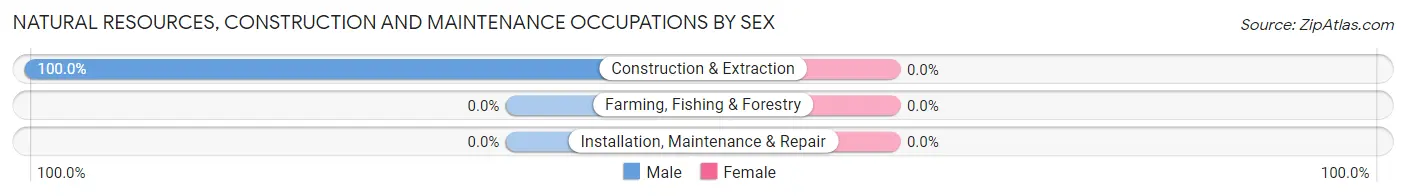
| Occupation | Male | Female |
| Farming, Fishing & Forestry | 0 (0.0%) | 0 (0.0%) |
| Construction & Extraction | 23 (100.0%) | 0 (0.0%) |
| Installation, Maintenance & Repair | 0 (0.0%) | 0 (0.0%) |
| Total (Category) | 23 (100.0%) | 0 (0.0%) |
| Total (Overall) | 23 (14.6%) | 135 (85.4%) |
Production, Transportation and Moving Occupations
The most common Production, Transportation and Moving occupations in Anchor Bay are , and Transportation (25 | 15.8%).
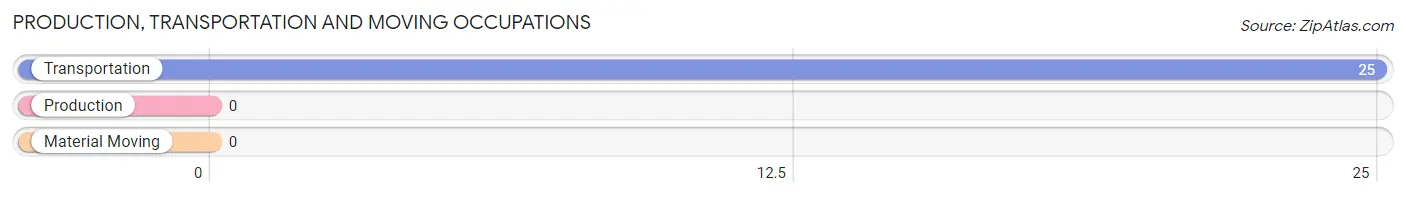
Production, Transportation and Moving Occupations by Sex
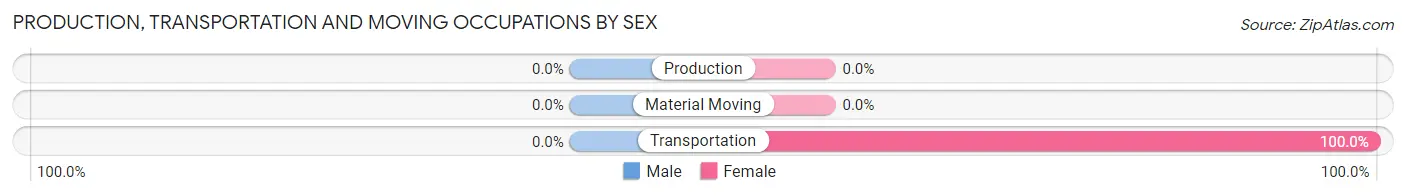
| Occupation | Male | Female |
| Production | 0 (0.0%) | 0 (0.0%) |
| Transportation | 0 (0.0%) | 25 (100.0%) |
| Material Moving | 0 (0.0%) | 0 (0.0%) |
| Total (Category) | 0 (0.0%) | 25 (100.0%) |
| Total (Overall) | 23 (14.6%) | 135 (85.4%) |
Employment Industries by Sex in Anchor Bay
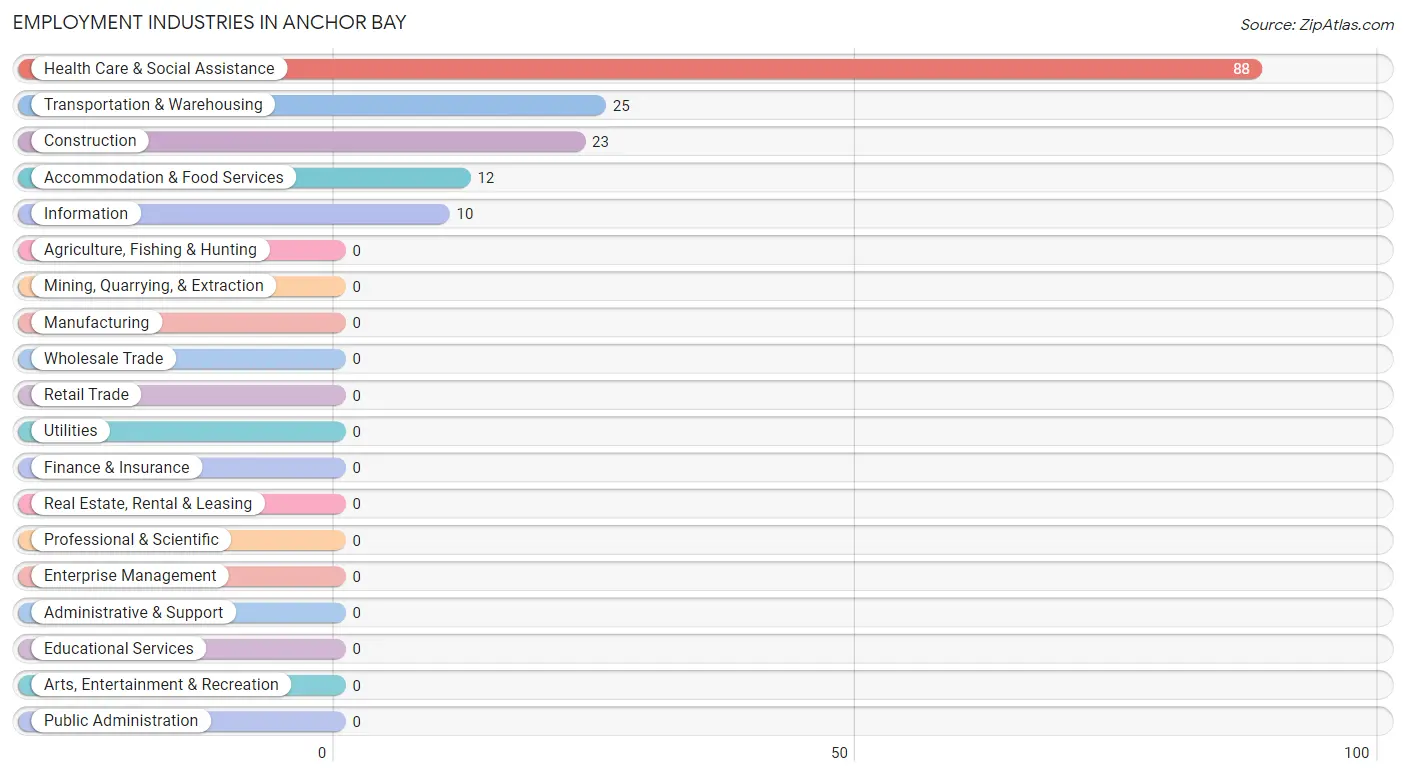
Employment Industries in Anchor Bay
The major employment industries in Anchor Bay include Health Care & Social Assistance (88 | 55.7%), Transportation & Warehousing (25 | 15.8%), Construction (23 | 14.6%), Accommodation & Food Services (12 | 7.6%), and Information (10 | 6.3%).
Employment Industries by Sex in Anchor Bay
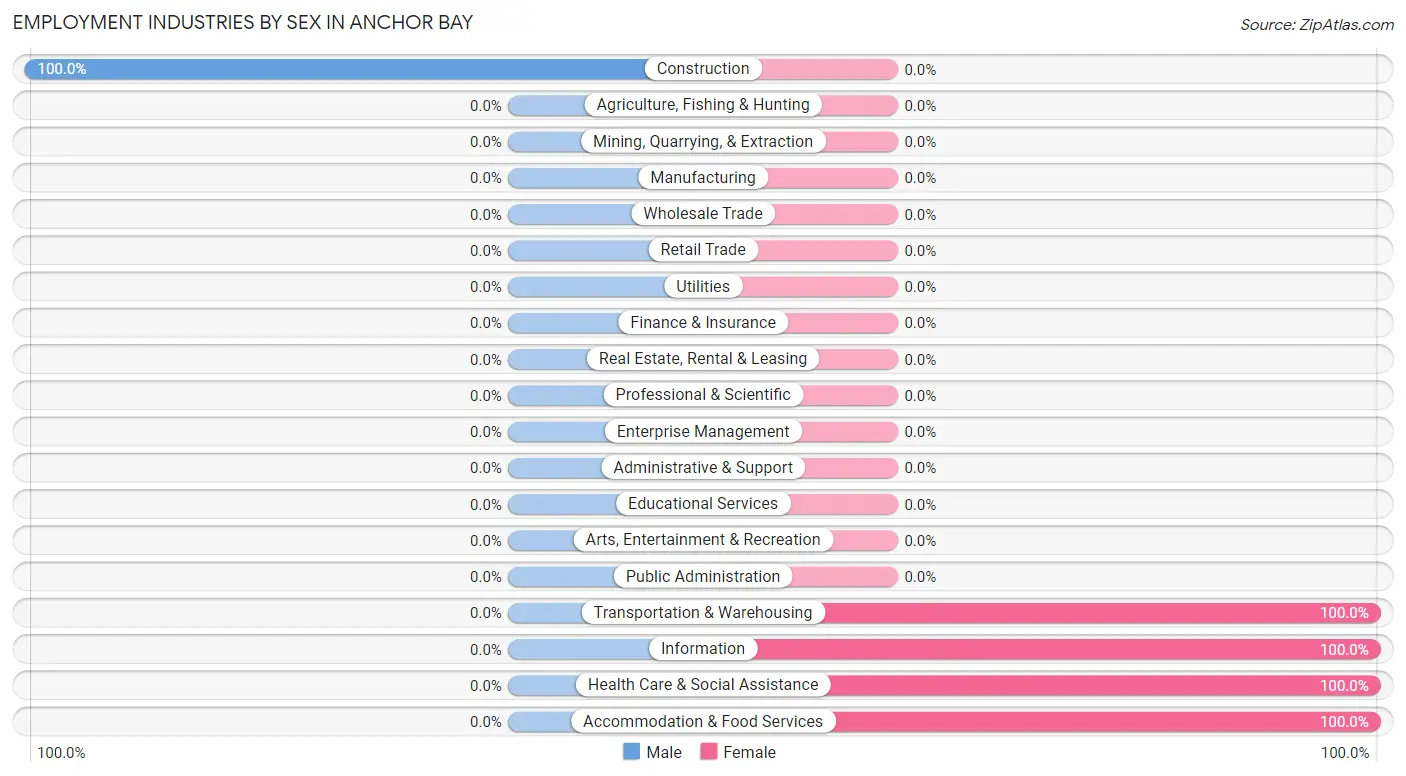
| Industry | Male | Female |
| Agriculture, Fishing & Hunting | 0 (0.0%) | 0 (0.0%) |
| Mining, Quarrying, & Extraction | 0 (0.0%) | 0 (0.0%) |
| Construction | 23 (100.0%) | 0 (0.0%) |
| Manufacturing | 0 (0.0%) | 0 (0.0%) |
| Wholesale Trade | 0 (0.0%) | 0 (0.0%) |
| Retail Trade | 0 (0.0%) | 0 (0.0%) |
| Transportation & Warehousing | 0 (0.0%) | 25 (100.0%) |
| Utilities | 0 (0.0%) | 0 (0.0%) |
| Information | 0 (0.0%) | 10 (100.0%) |
| Finance & Insurance | 0 (0.0%) | 0 (0.0%) |
| Real Estate, Rental & Leasing | 0 (0.0%) | 0 (0.0%) |
| Professional & Scientific | 0 (0.0%) | 0 (0.0%) |
| Enterprise Management | 0 (0.0%) | 0 (0.0%) |
| Administrative & Support | 0 (0.0%) | 0 (0.0%) |
| Educational Services | 0 (0.0%) | 0 (0.0%) |
| Health Care & Social Assistance | 0 (0.0%) | 88 (100.0%) |
| Arts, Entertainment & Recreation | 0 (0.0%) | 0 (0.0%) |
| Accommodation & Food Services | 0 (0.0%) | 12 (100.0%) |
| Public Administration | 0 (0.0%) | 0 (0.0%) |
| Total | 23 (14.6%) | 135 (85.4%) |
Education in Anchor Bay
School Enrollment in Anchor Bay
| School Level | # Students | % Students |
| Nursery / Preschool | 0 | 0.0% |
| Kindergarten | 0 | 0.0% |
| Elementary School | 0 | 0.0% |
| Middle School | 0 | 0.0% |
| High School | 0 | 0.0% |
| College / Undergraduate | 0 | 0.0% |
| Graduate / Professional | 0 | 0.0% |
| Total | 0 | 0.0% |
School Enrollment by Age by Funding Source in Anchor Bay
| Age Bracket | Public School | Private School |
| 3 to 4 Year Olds | 0 (0.0%) | 0 (0.0%) |
| 5 to 9 Year Old | 0 (0.0%) | 0 (0.0%) |
| 10 to 14 Year Olds | 0 (0.0%) | 0 (0.0%) |
| 15 to 17 Year Olds | 0 (0.0%) | 0 (0.0%) |
| 18 to 19 Year Olds | 0 (0.0%) | 0 (0.0%) |
| 20 to 24 Year Olds | 0 (0.0%) | 0 (0.0%) |
| 25 to 34 Year Olds | 0 (0.0%) | 0 (0.0%) |
| 35 Years and over | 0 (0.0%) | 0 (0.0%) |
| Total | 0 (0.0%) | 0 (0.0%) |
Educational Attainment by Field of Study in Anchor Bay
Liberal arts & history (30 | 75.0%), and literature & languages (10 | 25.0%) are the most common fields of study among 40 individuals in Anchor Bay who have obtained a bachelor's degree or higher.
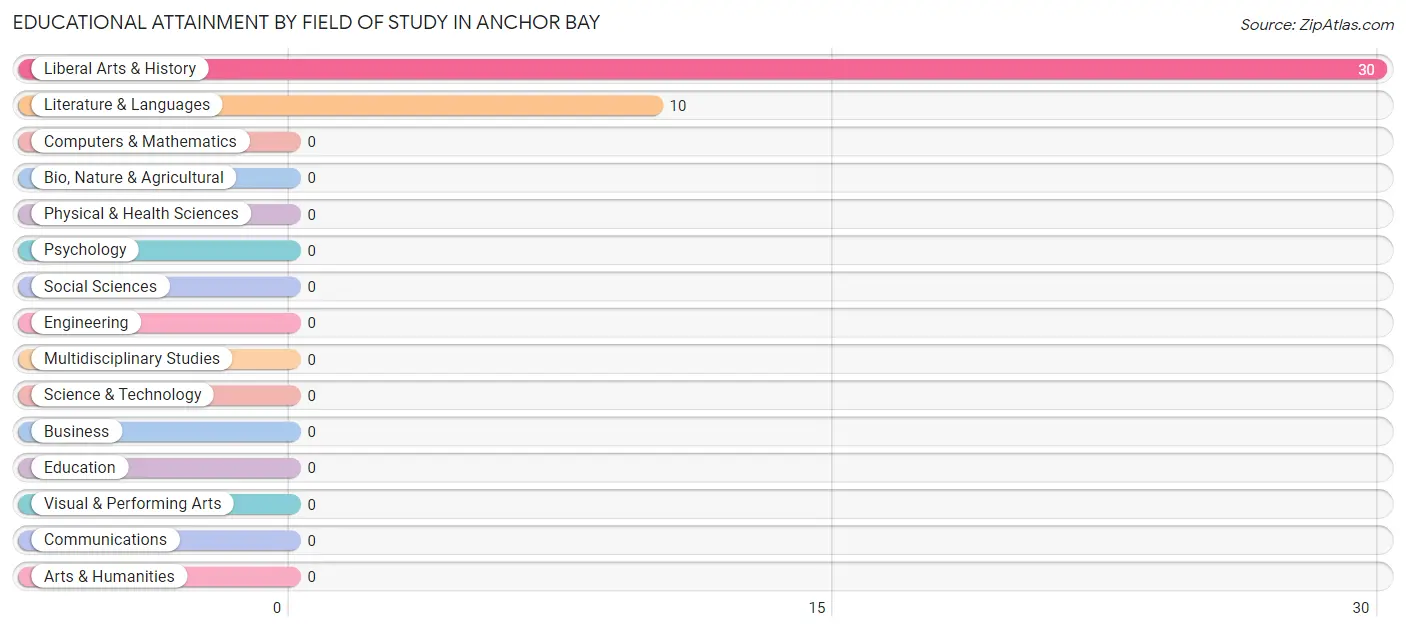
| Field of Study | # Graduates | % Graduates |
| Computers & Mathematics | 0 | 0.0% |
| Bio, Nature & Agricultural | 0 | 0.0% |
| Physical & Health Sciences | 0 | 0.0% |
| Psychology | 0 | 0.0% |
| Social Sciences | 0 | 0.0% |
| Engineering | 0 | 0.0% |
| Multidisciplinary Studies | 0 | 0.0% |
| Science & Technology | 0 | 0.0% |
| Business | 0 | 0.0% |
| Education | 0 | 0.0% |
| Literature & Languages | 10 | 25.0% |
| Liberal Arts & History | 30 | 75.0% |
| Visual & Performing Arts | 0 | 0.0% |
| Communications | 0 | 0.0% |
| Arts & Humanities | 0 | 0.0% |
| Total | 40 | 100.0% |
Transportation & Commute in Anchor Bay
Vehicle Availability by Sex in Anchor Bay
The most prevalent vehicle ownership categories in Anchor Bay are males with 2 vehicles (23, accounting for 100.0%) and females with 2 vehicles (10, making up 18.7%).
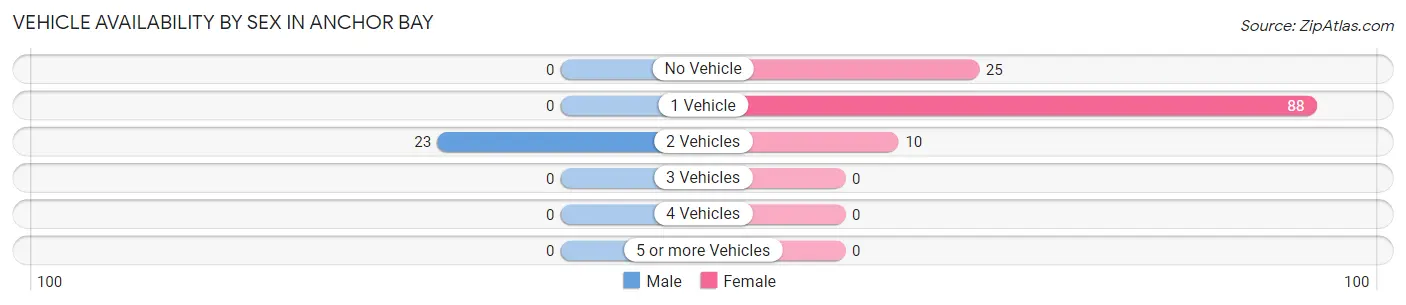
| Vehicles Available | Male | Female |
| No Vehicle | 0 (0.0%) | 25 (20.3%) |
| 1 Vehicle | 0 (0.0%) | 88 (71.5%) |
| 2 Vehicles | 23 (100.0%) | 10 (8.1%) |
| 3 Vehicles | 0 (0.0%) | 0 (0.0%) |
| 4 Vehicles | 0 (0.0%) | 0 (0.0%) |
| 5 or more Vehicles | 0 (0.0%) | 0 (0.0%) |
| Total | 23 (100.0%) | 123 (100.0%) |
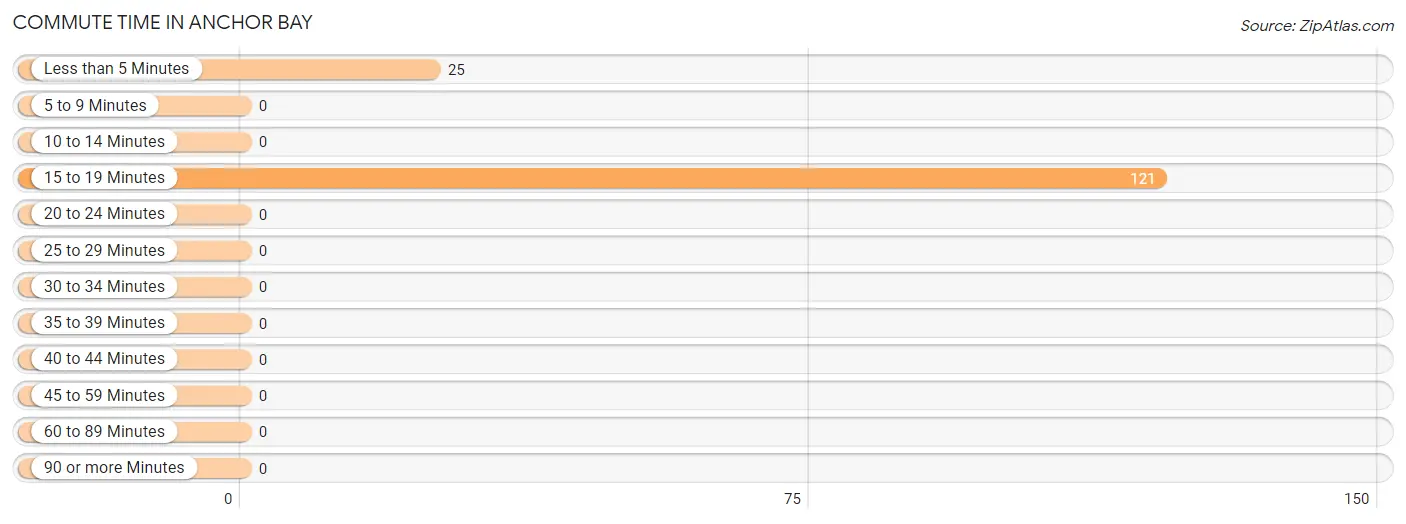
Commute Time in Anchor Bay
The most frequently occuring commute durations in Anchor Bay are 15 to 19 minutes (121 commuters, 82.9%), less than 5 minutes (25 commuters, 17.1%), and 5 to 9 minutes (0 commuters, 0.0%).
| Commute Time | # Commuters | % Commuters |
| Less than 5 Minutes | 25 | 17.1% |
| 5 to 9 Minutes | 0 | 0.0% |
| 10 to 14 Minutes | 0 | 0.0% |
| 15 to 19 Minutes | 121 | 82.9% |
| 20 to 24 Minutes | 0 | 0.0% |
| 25 to 29 Minutes | 0 | 0.0% |
| 30 to 34 Minutes | 0 | 0.0% |
| 35 to 39 Minutes | 0 | 0.0% |
| 40 to 44 Minutes | 0 | 0.0% |
| 45 to 59 Minutes | 0 | 0.0% |
| 60 to 89 Minutes | 0 | 0.0% |
| 90 or more Minutes | 0 | 0.0% |
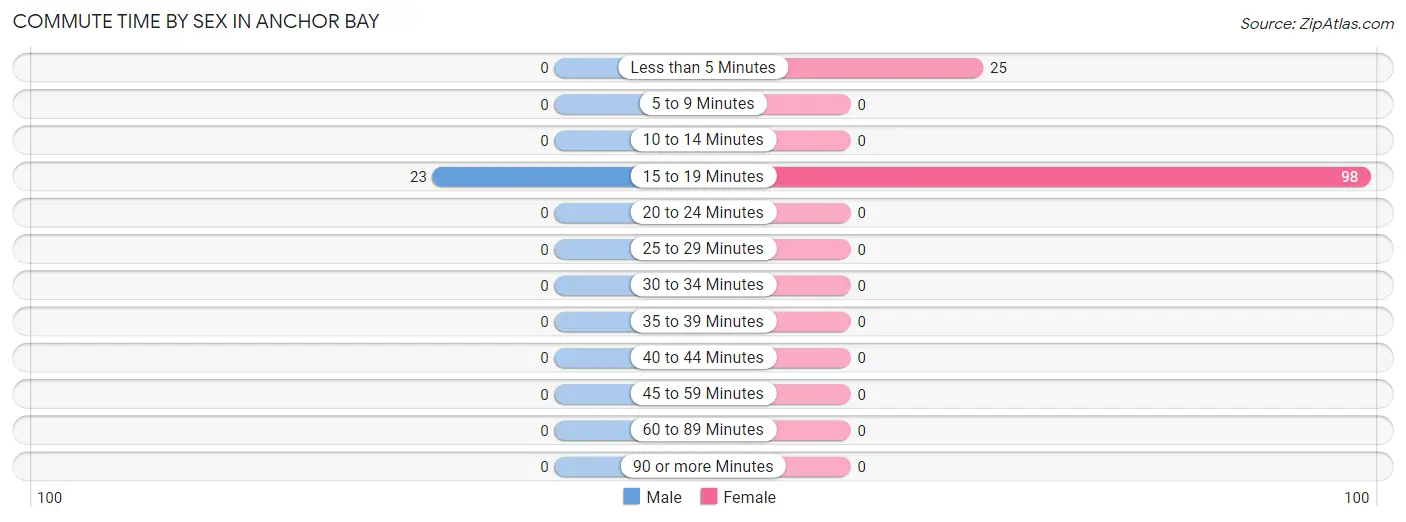
Commute Time by Sex in Anchor Bay
The most common commute times in Anchor Bay are 15 to 19 minutes (23 commuters, 100.0%) for males and 15 to 19 minutes (98 commuters, 79.7%) for females.
| Commute Time | Male | Female |
| Less than 5 Minutes | 0 (0.0%) | 25 (20.3%) |
| 5 to 9 Minutes | 0 (0.0%) | 0 (0.0%) |
| 10 to 14 Minutes | 0 (0.0%) | 0 (0.0%) |
| 15 to 19 Minutes | 23 (100.0%) | 98 (79.7%) |
| 20 to 24 Minutes | 0 (0.0%) | 0 (0.0%) |
| 25 to 29 Minutes | 0 (0.0%) | 0 (0.0%) |
| 30 to 34 Minutes | 0 (0.0%) | 0 (0.0%) |
| 35 to 39 Minutes | 0 (0.0%) | 0 (0.0%) |
| 40 to 44 Minutes | 0 (0.0%) | 0 (0.0%) |
| 45 to 59 Minutes | 0 (0.0%) | 0 (0.0%) |
| 60 to 89 Minutes | 0 (0.0%) | 0 (0.0%) |
| 90 or more Minutes | 0 (0.0%) | 0 (0.0%) |
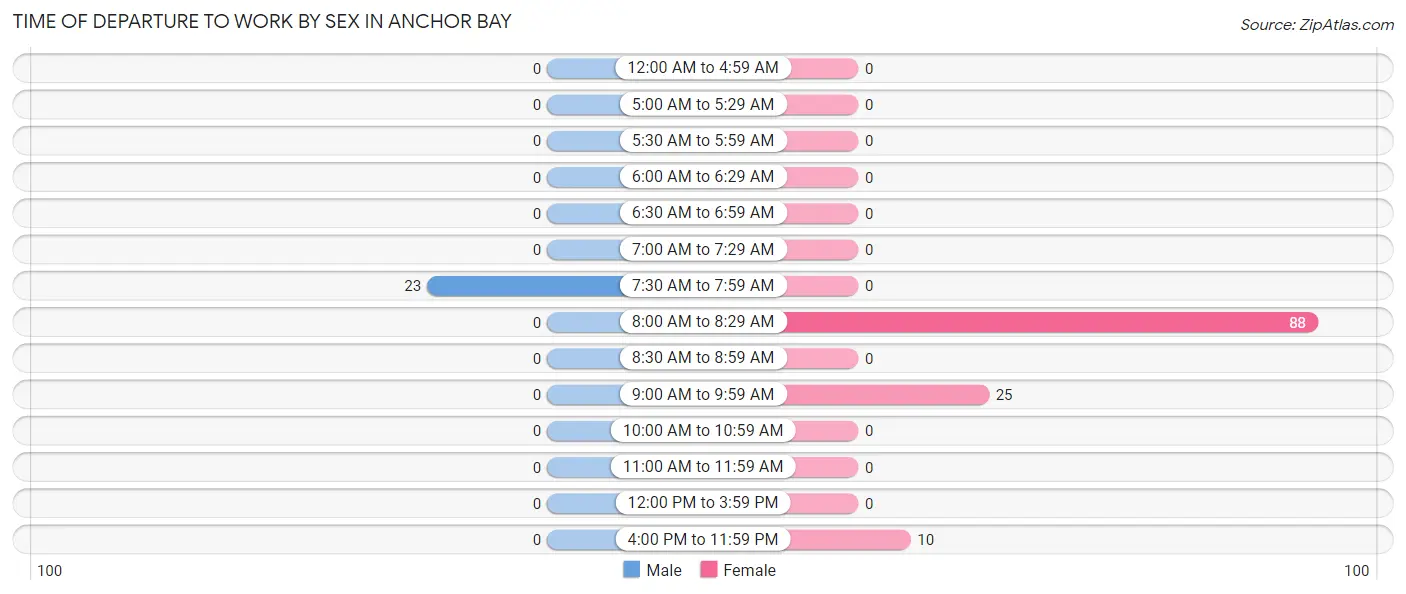
Time of Departure to Work by Sex in Anchor Bay
The most frequent times of departure to work in Anchor Bay are 7:30 AM to 7:59 AM (23, 100.0%) for males and 8:00 AM to 8:29 AM (88, 71.5%) for females.
| Time of Departure | Male | Female |
| 12:00 AM to 4:59 AM | 0 (0.0%) | 0 (0.0%) |
| 5:00 AM to 5:29 AM | 0 (0.0%) | 0 (0.0%) |
| 5:30 AM to 5:59 AM | 0 (0.0%) | 0 (0.0%) |
| 6:00 AM to 6:29 AM | 0 (0.0%) | 0 (0.0%) |
| 6:30 AM to 6:59 AM | 0 (0.0%) | 0 (0.0%) |
| 7:00 AM to 7:29 AM | 0 (0.0%) | 0 (0.0%) |
| 7:30 AM to 7:59 AM | 23 (100.0%) | 0 (0.0%) |
| 8:00 AM to 8:29 AM | 0 (0.0%) | 88 (71.5%) |
| 8:30 AM to 8:59 AM | 0 (0.0%) | 0 (0.0%) |
| 9:00 AM to 9:59 AM | 0 (0.0%) | 25 (20.3%) |
| 10:00 AM to 10:59 AM | 0 (0.0%) | 0 (0.0%) |
| 11:00 AM to 11:59 AM | 0 (0.0%) | 0 (0.0%) |
| 12:00 PM to 3:59 PM | 0 (0.0%) | 0 (0.0%) |
| 4:00 PM to 11:59 PM | 0 (0.0%) | 10 (8.1%) |
| Total | 23 (100.0%) | 123 (100.0%) |
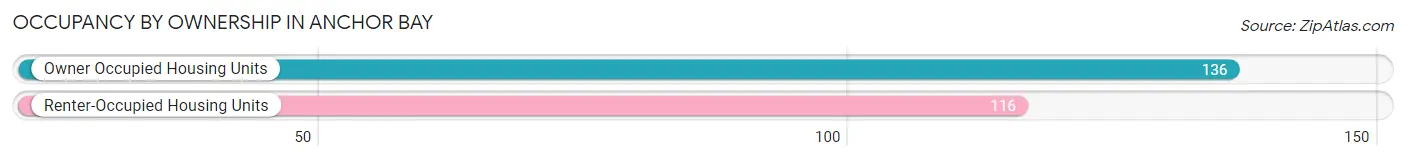
Housing Occupancy in Anchor Bay
Occupancy by Ownership in Anchor Bay
Of the total 252 dwellings in Anchor Bay, owner-occupied units account for 136 (54.0%), while renter-occupied units make up 116 (46.0%).
| Occupancy | # Housing Units | % Housing Units |
| Owner Occupied Housing Units | 136 | 54.0% |
| Renter-Occupied Housing Units | 116 | 46.0% |
| Total Occupied Housing Units | 252 | 100.0% |
Occupancy by Household Size in Anchor Bay
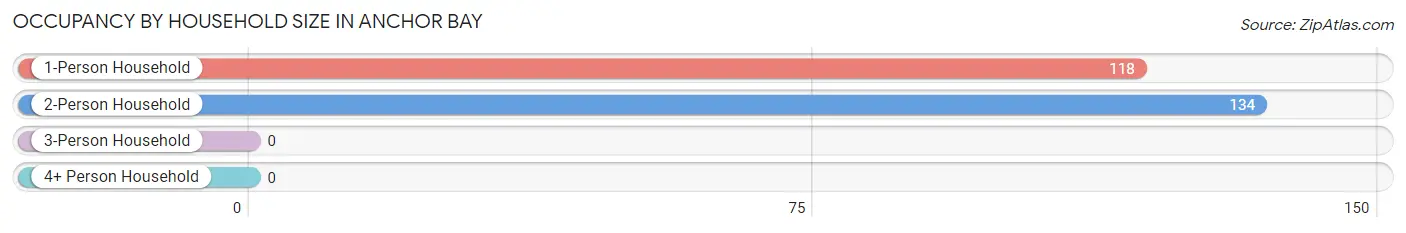
| Household Size | # Housing Units | % Housing Units |
| 1-Person Household | 118 | 46.8% |
| 2-Person Household | 134 | 53.2% |
| 3-Person Household | 0 | 0.0% |
| 4+ Person Household | 0 | 0.0% |
| Total Housing Units | 252 | 100.0% |
Occupancy by Ownership by Household Size in Anchor Bay
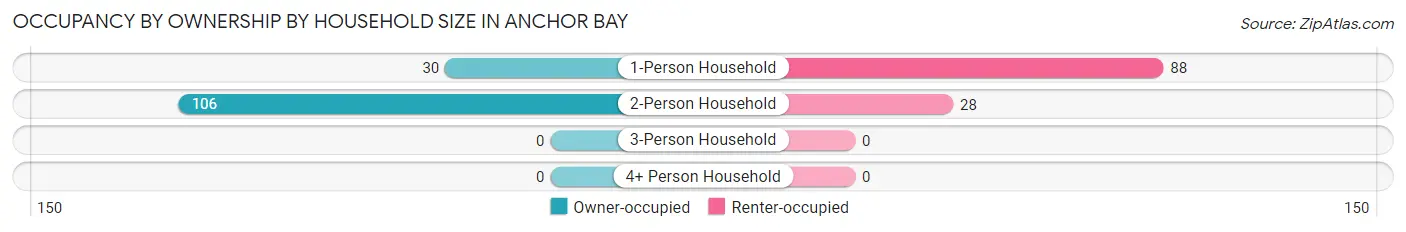
| Household Size | Owner-occupied | Renter-occupied |
| 1-Person Household | 30 (25.4%) | 88 (74.6%) |
| 2-Person Household | 106 (79.1%) | 28 (20.9%) |
| 3-Person Household | 0 (0.0%) | 0 (0.0%) |
| 4+ Person Household | 0 (0.0%) | 0 (0.0%) |
| Total Housing Units | 136 (54.0%) | 116 (46.0%) |
Occupancy by Educational Attainment in Anchor Bay
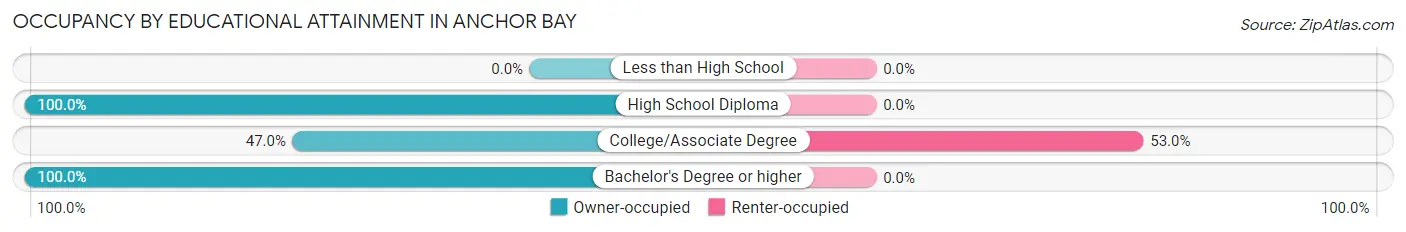
| Household Size | Owner-occupied | Renter-occupied |
| Less than High School | 0 (0.0%) | 0 (0.0%) |
| High School Diploma | 23 (100.0%) | 0 (0.0%) |
| College/Associate Degree | 103 (47.0%) | 116 (53.0%) |
| Bachelor's Degree or higher | 10 (100.0%) | 0 (0.0%) |
Occupancy by Age of Householder in Anchor Bay
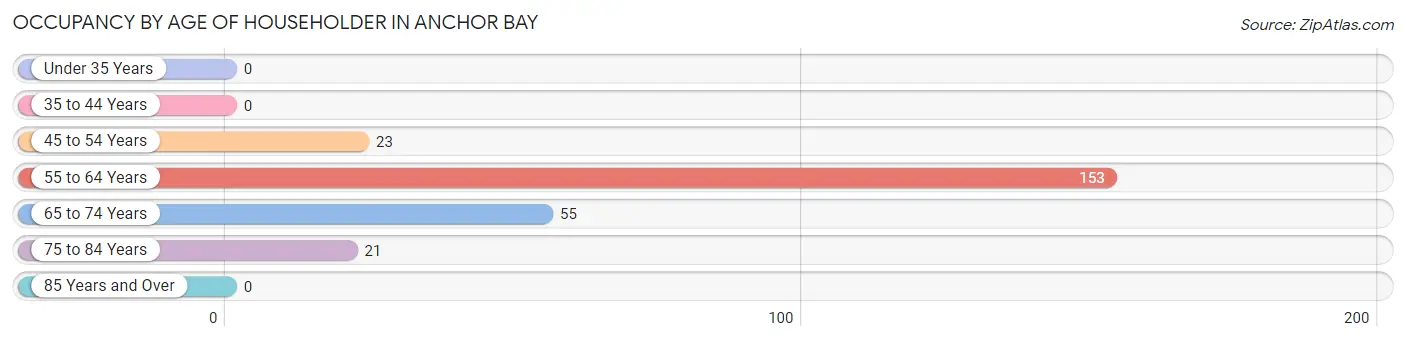
| Age Bracket | # Households | % Households |
| Under 35 Years | 0 | 0.0% |
| 35 to 44 Years | 0 | 0.0% |
| 45 to 54 Years | 23 | 9.1% |
| 55 to 64 Years | 153 | 60.7% |
| 65 to 74 Years | 55 | 21.8% |
| 75 to 84 Years | 21 | 8.3% |
| 85 Years and Over | 0 | 0.0% |
| Total | 252 | 100.0% |
Housing Finances in Anchor Bay
Median Income by Occupancy in Anchor Bay
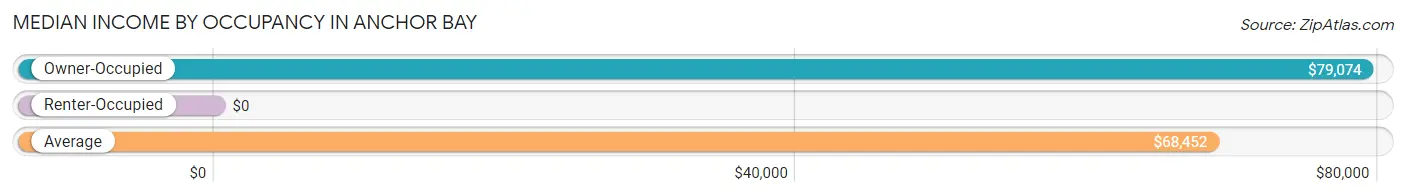
| Occupancy Type | # Households | Median Income |
| Owner-Occupied | 136 (54.0%) | $79,074 |
| Renter-Occupied | 116 (46.0%) | $0 |
| Average | 252 (100.0%) | $68,452 |
Occupancy by Householder Income Bracket in Anchor Bay
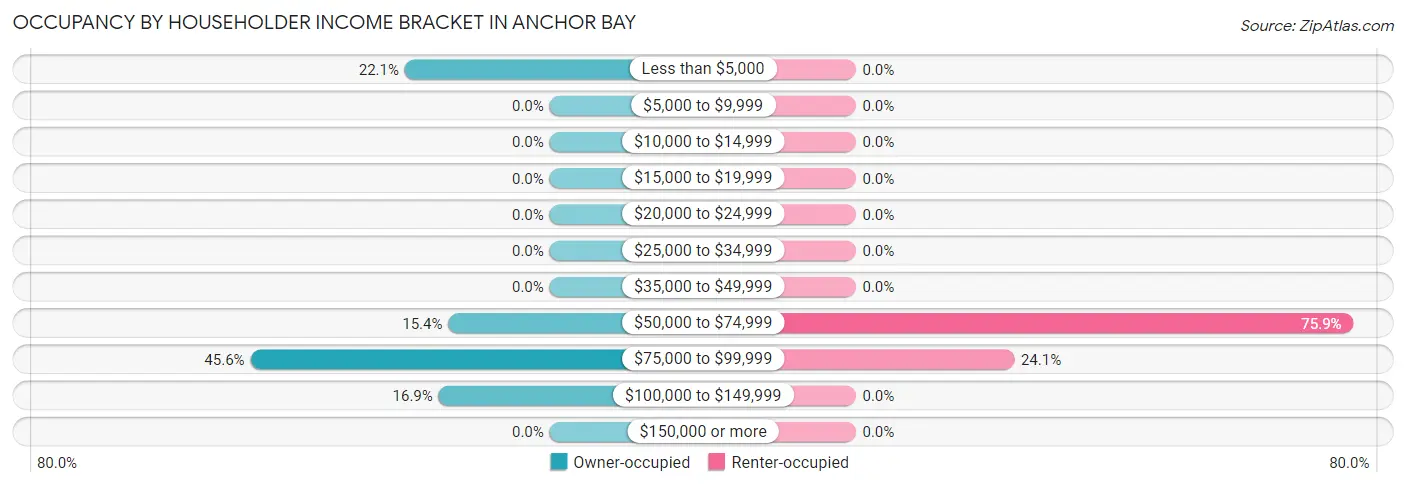
| Income Bracket | Owner-occupied | Renter-occupied |
| Less than $5,000 | 30 (22.1%) | 0 (0.0%) |
| $5,000 to $9,999 | 0 (0.0%) | 0 (0.0%) |
| $10,000 to $14,999 | 0 (0.0%) | 0 (0.0%) |
| $15,000 to $19,999 | 0 (0.0%) | 0 (0.0%) |
| $20,000 to $24,999 | 0 (0.0%) | 0 (0.0%) |
| $25,000 to $34,999 | 0 (0.0%) | 0 (0.0%) |
| $35,000 to $49,999 | 0 (0.0%) | 0 (0.0%) |
| $50,000 to $74,999 | 21 (15.4%) | 88 (75.9%) |
| $75,000 to $99,999 | 62 (45.6%) | 28 (24.1%) |
| $100,000 to $149,999 | 23 (16.9%) | 0 (0.0%) |
| $150,000 or more | 0 (0.0%) | 0 (0.0%) |
| Total | 136 (100.0%) | 116 (100.0%) |
Monthly Housing Cost Tiers in Anchor Bay
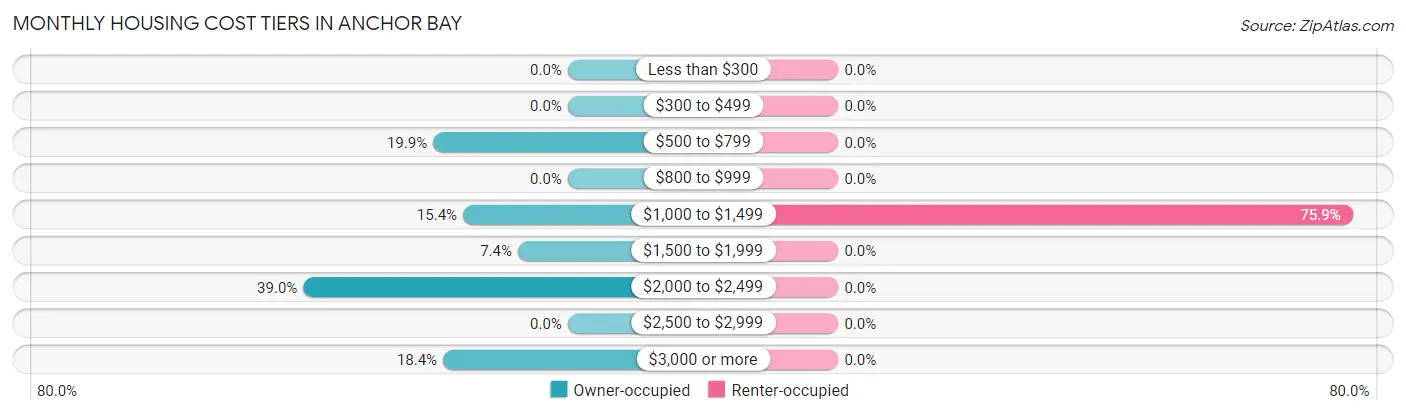
| Monthly Cost | Owner-occupied | Renter-occupied |
| Less than $300 | 0 (0.0%) | 0 (0.0%) |
| $300 to $499 | 0 (0.0%) | 0 (0.0%) |
| $500 to $799 | 27 (19.9%) | 0 (0.0%) |
| $800 to $999 | 0 (0.0%) | 0 (0.0%) |
| $1,000 to $1,499 | 21 (15.4%) | 88 (75.9%) |
| $1,500 to $1,999 | 10 (7.3%) | 0 (0.0%) |
| $2,000 to $2,499 | 53 (39.0%) | 0 (0.0%) |
| $2,500 to $2,999 | 0 (0.0%) | 0 (0.0%) |
| $3,000 or more | 25 (18.4%) | 0 (0.0%) |
| Total | 136 (100.0%) | 116 (100.0%) |
Physical Housing Characteristics in Anchor Bay
Housing Structures in Anchor Bay
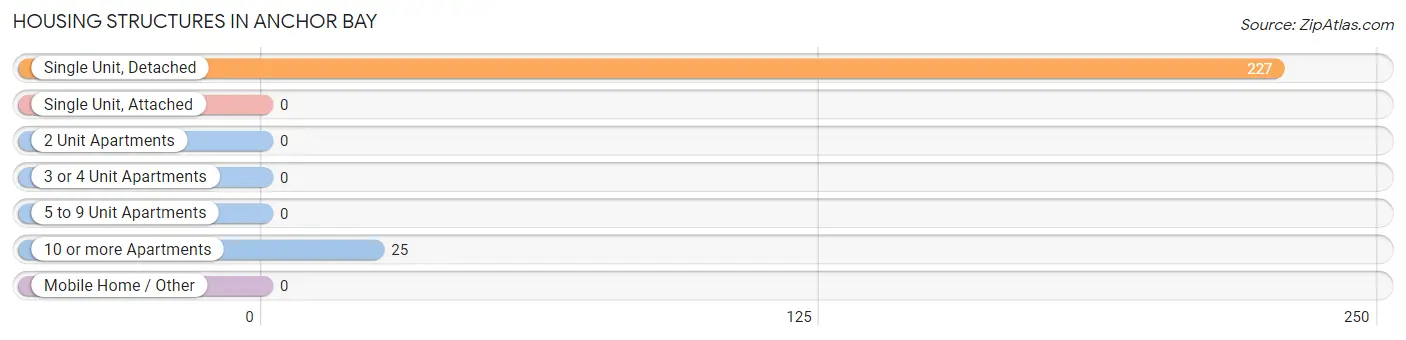
| Structure Type | # Housing Units | % Housing Units |
| Single Unit, Detached | 227 | 90.1% |
| Single Unit, Attached | 0 | 0.0% |
| 2 Unit Apartments | 0 | 0.0% |
| 3 or 4 Unit Apartments | 0 | 0.0% |
| 5 to 9 Unit Apartments | 0 | 0.0% |
| 10 or more Apartments | 25 | 9.9% |
| Mobile Home / Other | 0 | 0.0% |
| Total | 252 | 100.0% |
Housing Structures by Occupancy in Anchor Bay
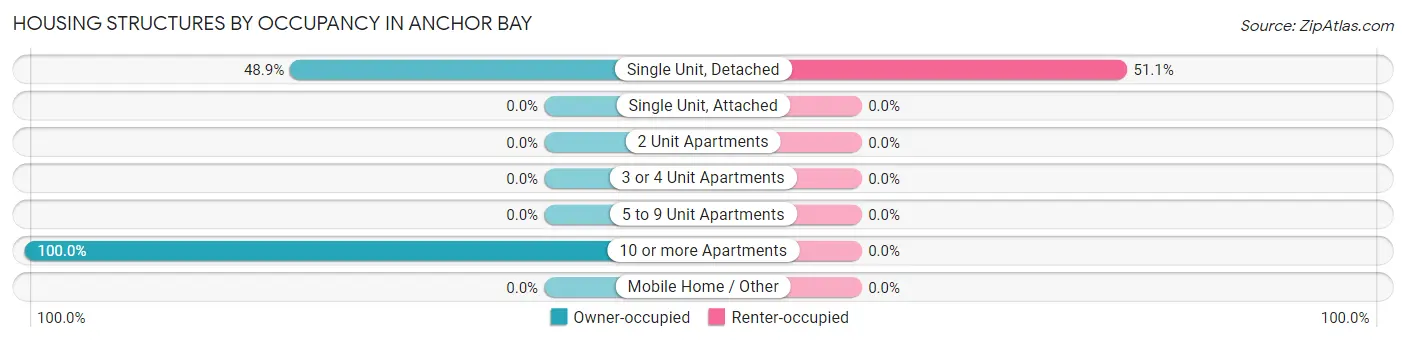
| Structure Type | Owner-occupied | Renter-occupied |
| Single Unit, Detached | 111 (48.9%) | 116 (51.1%) |
| Single Unit, Attached | 0 (0.0%) | 0 (0.0%) |
| 2 Unit Apartments | 0 (0.0%) | 0 (0.0%) |
| 3 or 4 Unit Apartments | 0 (0.0%) | 0 (0.0%) |
| 5 to 9 Unit Apartments | 0 (0.0%) | 0 (0.0%) |
| 10 or more Apartments | 25 (100.0%) | 0 (0.0%) |
| Mobile Home / Other | 0 (0.0%) | 0 (0.0%) |
| Total | 136 (54.0%) | 116 (46.0%) |
Housing Structures by Number of Rooms in Anchor Bay
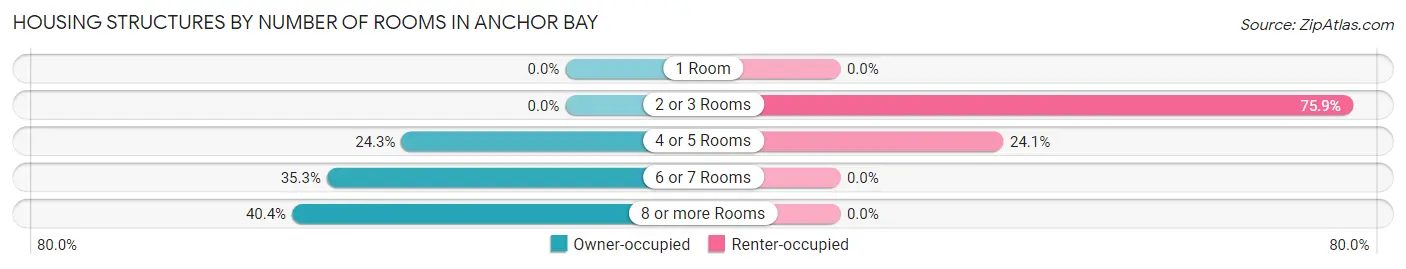
| Number of Rooms | Owner-occupied | Renter-occupied |
| 1 Room | 0 (0.0%) | 0 (0.0%) |
| 2 or 3 Rooms | 0 (0.0%) | 88 (75.9%) |
| 4 or 5 Rooms | 33 (24.3%) | 28 (24.1%) |
| 6 or 7 Rooms | 48 (35.3%) | 0 (0.0%) |
| 8 or more Rooms | 55 (40.4%) | 0 (0.0%) |
| Total | 136 (100.0%) | 116 (100.0%) |
Housing Structure by Heating Type in Anchor Bay
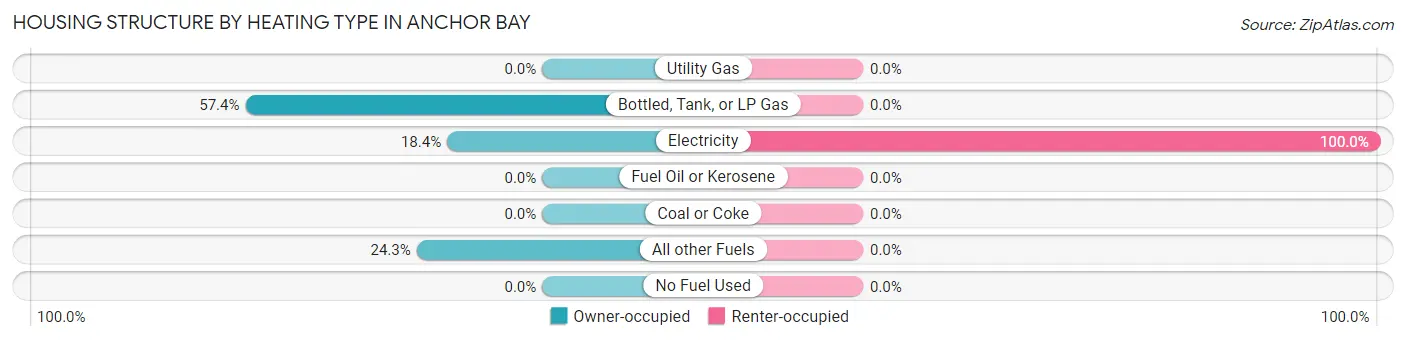
| Heating Type | Owner-occupied | Renter-occupied |
| Utility Gas | 0 (0.0%) | 0 (0.0%) |
| Bottled, Tank, or LP Gas | 78 (57.4%) | 0 (0.0%) |
| Electricity | 25 (18.4%) | 116 (100.0%) |
| Fuel Oil or Kerosene | 0 (0.0%) | 0 (0.0%) |
| Coal or Coke | 0 (0.0%) | 0 (0.0%) |
| All other Fuels | 33 (24.3%) | 0 (0.0%) |
| No Fuel Used | 0 (0.0%) | 0 (0.0%) |
| Total | 136 (100.0%) | 116 (100.0%) |
Household Vehicle Usage in Anchor Bay
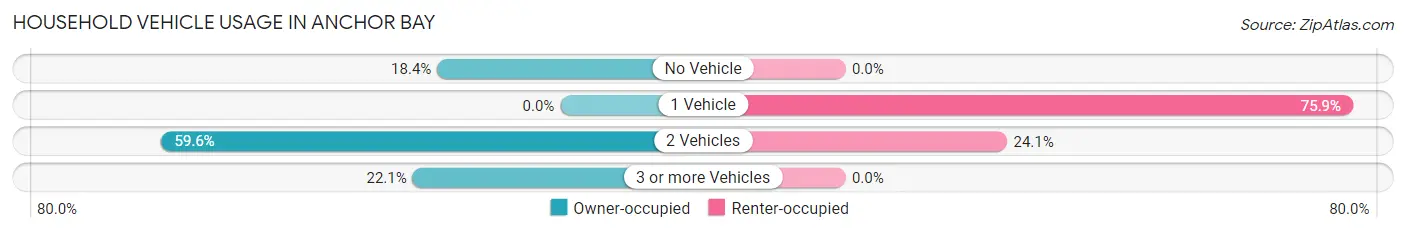
| Vehicles per Household | Owner-occupied | Renter-occupied |
| No Vehicle | 25 (18.4%) | 0 (0.0%) |
| 1 Vehicle | 0 (0.0%) | 88 (75.9%) |
| 2 Vehicles | 81 (59.6%) | 28 (24.1%) |
| 3 or more Vehicles | 30 (22.1%) | 0 (0.0%) |
| Total | 136 (100.0%) | 116 (100.0%) |
Real Estate & Mortgages in Anchor Bay
Real Estate and Mortgage Overview in Anchor Bay
| Characteristic | Without Mortgage | With Mortgage |
| Housing Units | 78 | 58 |
| Median Property Value | $892,900 | $0 |
| Median Household Income | - | - |
| Monthly Housing Costs | $1,457 | $25 |
| Real Estate Taxes | - | - |
Property Value by Mortgage Status in Anchor Bay
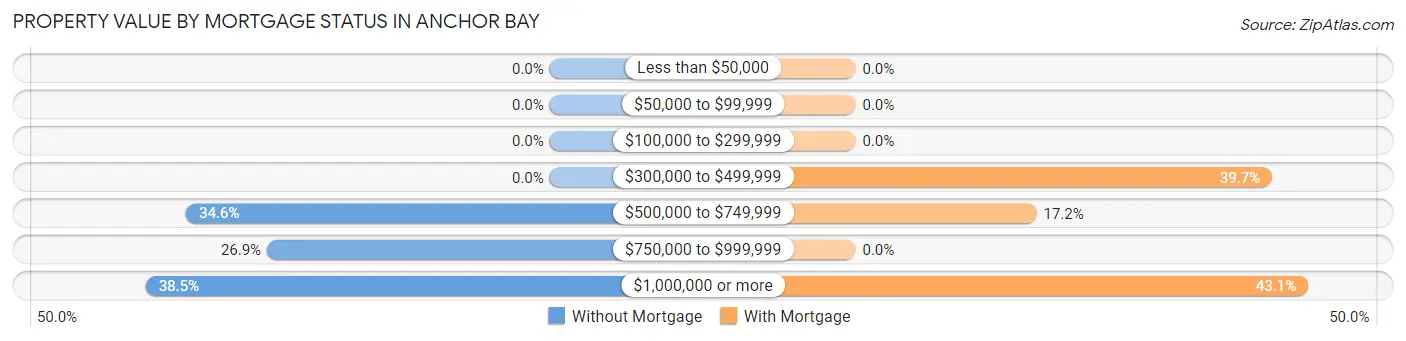
| Property Value | Without Mortgage | With Mortgage |
| Less than $50,000 | 0 (0.0%) | 0 (0.0%) |
| $50,000 to $99,999 | 0 (0.0%) | 0 (0.0%) |
| $100,000 to $299,999 | 0 (0.0%) | 0 (0.0%) |
| $300,000 to $499,999 | 0 (0.0%) | 23 (39.7%) |
| $500,000 to $749,999 | 27 (34.6%) | 10 (17.2%) |
| $750,000 to $999,999 | 21 (26.9%) | 0 (0.0%) |
| $1,000,000 or more | 30 (38.5%) | 25 (43.1%) |
| Total | 78 (100.0%) | 58 (100.0%) |
Household Income by Mortgage Status in Anchor Bay
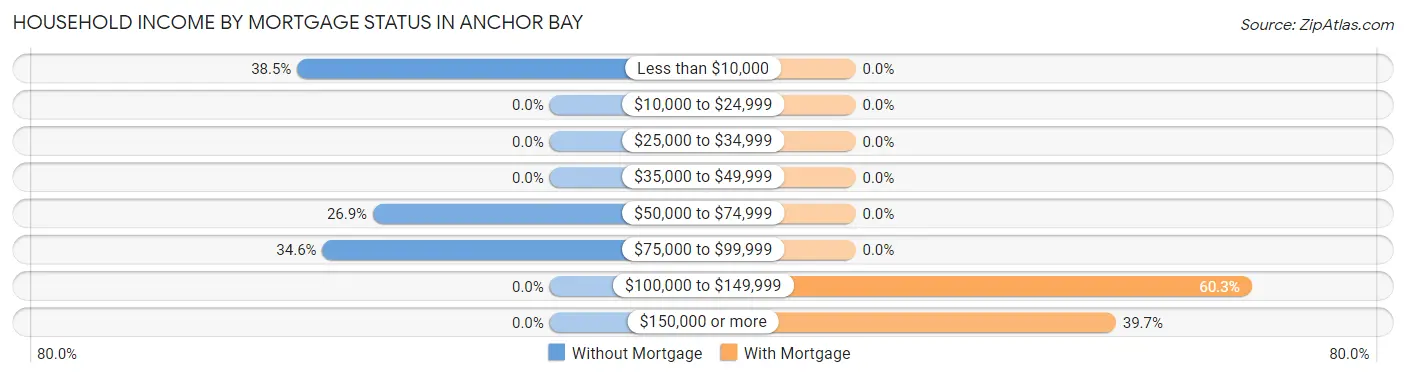
| Household Income | Without Mortgage | With Mortgage |
| Less than $10,000 | 30 (38.5%) | 0 (0.0%) |
| $10,000 to $24,999 | 0 (0.0%) | 0 (0.0%) |
| $25,000 to $34,999 | 0 (0.0%) | 0 (0.0%) |
| $35,000 to $49,999 | 0 (0.0%) | 0 (0.0%) |
| $50,000 to $74,999 | 21 (26.9%) | 0 (0.0%) |
| $75,000 to $99,999 | 27 (34.6%) | 0 (0.0%) |
| $100,000 to $149,999 | 0 (0.0%) | 35 (60.3%) |
| $150,000 or more | 0 (0.0%) | 23 (39.7%) |
| Total | 78 (100.0%) | 58 (100.0%) |
Property Value to Household Income Ratio in Anchor Bay
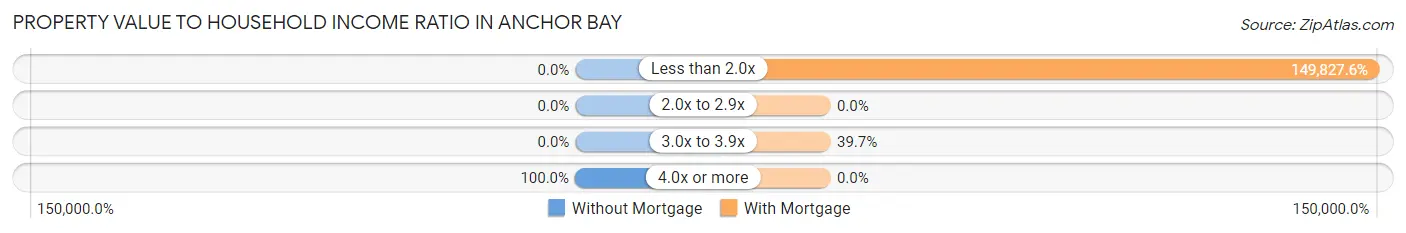
| Value-to-Income Ratio | Without Mortgage | With Mortgage |
| Less than 2.0x | 0 (0.0%) | 86,900 (149,827.6%) |
| 2.0x to 2.9x | 0 (0.0%) | 0 (0.0%) |
| 3.0x to 3.9x | 0 (0.0%) | 23 (39.7%) |
| 4.0x or more | 78 (100.0%) | 0 (0.0%) |
| Total | 78 (100.0%) | 58 (100.0%) |
Real Estate Taxes by Mortgage Status in Anchor Bay
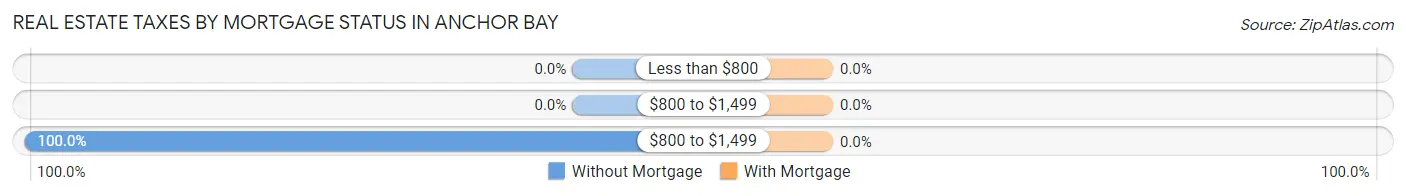
| Property Taxes | Without Mortgage | With Mortgage |
| Less than $800 | 0 (0.0%) | 0 (0.0%) |
| $800 to $1,499 | 0 (0.0%) | 0 (0.0%) |
| $800 to $1,499 | 78 (100.0%) | 0 (0.0%) |
| Total | 78 (100.0%) | 58 (100.0%) |
Health & Disability in Anchor Bay
Health Insurance Coverage by Age in Anchor Bay
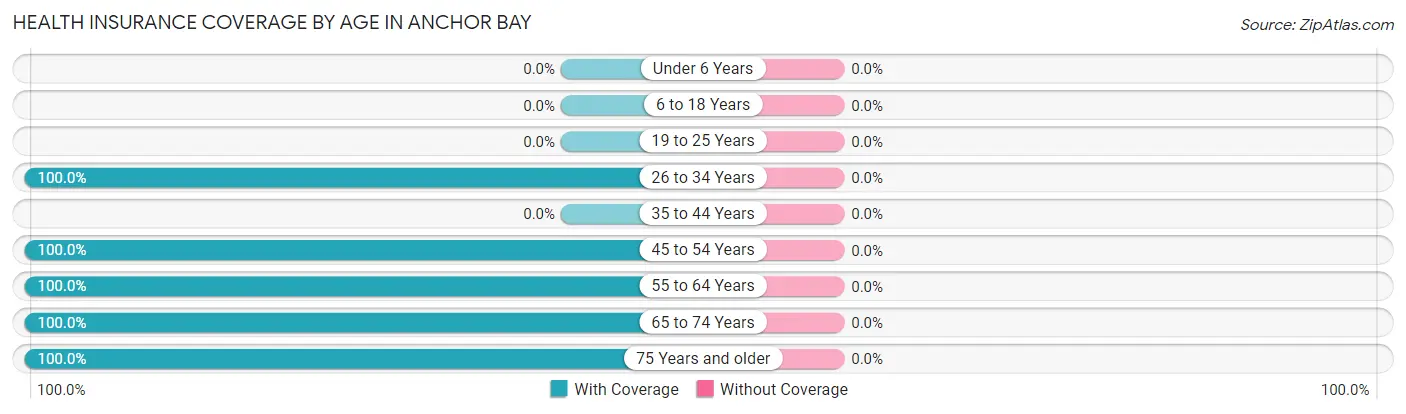
| Age Bracket | With Coverage | Without Coverage |
| Under 6 Years | 0 (0.0%) | 0 (0.0%) |
| 6 to 18 Years | 0 (0.0%) | 0 (0.0%) |
| 19 to 25 Years | 0 (0.0%) | 0 (0.0%) |
| 26 to 34 Years | 12 (100.0%) | 0 (0.0%) |
| 35 to 44 Years | 0 (0.0%) | 0 (0.0%) |
| 45 to 54 Years | 23 (100.0%) | 0 (0.0%) |
| 55 to 64 Years | 153 (100.0%) | 0 (0.0%) |
| 65 to 74 Years | 160 (100.0%) | 0 (0.0%) |
| 75 Years and older | 21 (100.0%) | 0 (0.0%) |
| Total | 369 (100.0%) | 0 (0.0%) |
Health Insurance Coverage by Citizenship Status in Anchor Bay
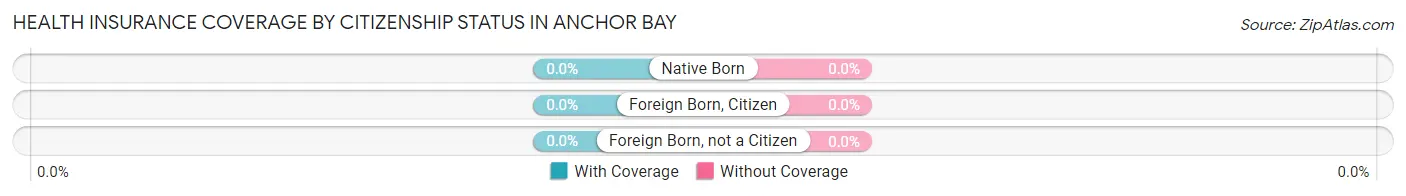
| Citizenship Status | With Coverage | Without Coverage |
| Native Born | 0 (0.0%) | 0 (0.0%) |
| Foreign Born, Citizen | 0 (0.0%) | 0 (0.0%) |
| Foreign Born, not a Citizen | 0 (0.0%) | 0 (0.0%) |
Health Insurance Coverage by Household Income in Anchor Bay
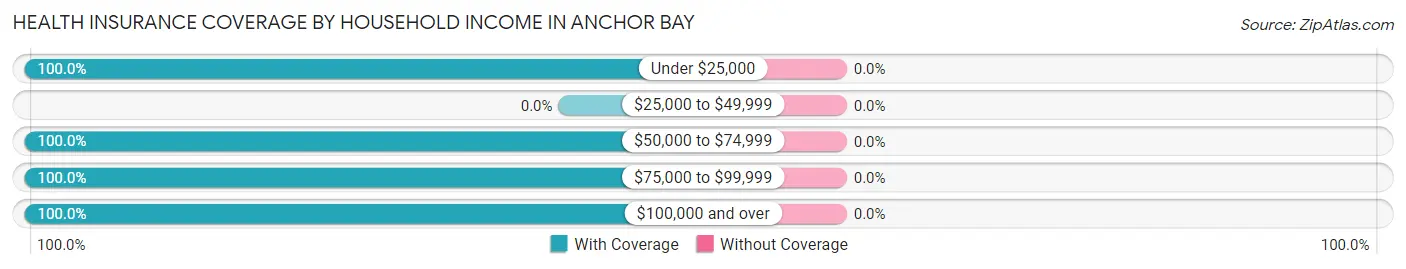
| Household Income | With Coverage | Without Coverage |
| Under $25,000 | 30 (100.0%) | 0 (0.0%) |
| $25,000 to $49,999 | 0 (0.0%) | 0 (0.0%) |
| $50,000 to $74,999 | 132 (100.0%) | 0 (0.0%) |
| $75,000 to $99,999 | 172 (100.0%) | 0 (0.0%) |
| $100,000 and over | 35 (100.0%) | 0 (0.0%) |
Public vs Private Health Insurance Coverage by Age in Anchor Bay
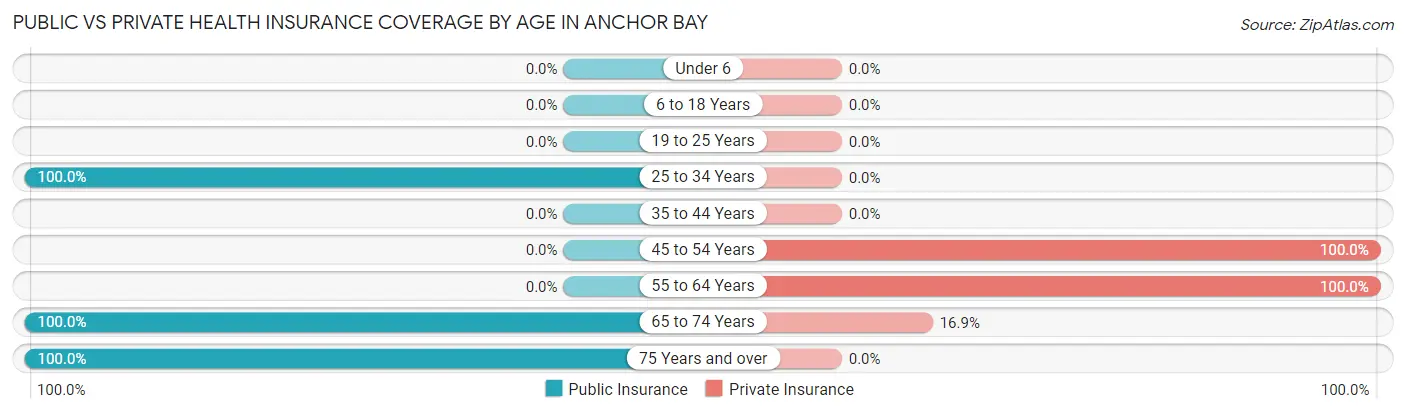
| Age Bracket | Public Insurance | Private Insurance |
| Under 6 | 0 (0.0%) | 0 (0.0%) |
| 6 to 18 Years | 0 (0.0%) | 0 (0.0%) |
| 19 to 25 Years | 0 (0.0%) | 0 (0.0%) |
| 25 to 34 Years | 12 (100.0%) | 0 (0.0%) |
| 35 to 44 Years | 0 (0.0%) | 0 (0.0%) |
| 45 to 54 Years | 0 (0.0%) | 23 (100.0%) |
| 55 to 64 Years | 0 (0.0%) | 153 (100.0%) |
| 65 to 74 Years | 160 (100.0%) | 27 (16.9%) |
| 75 Years and over | 21 (100.0%) | 0 (0.0%) |
| Total | 193 (52.3%) | 203 (55.0%) |
Disability Status by Sex by Age in Anchor Bay
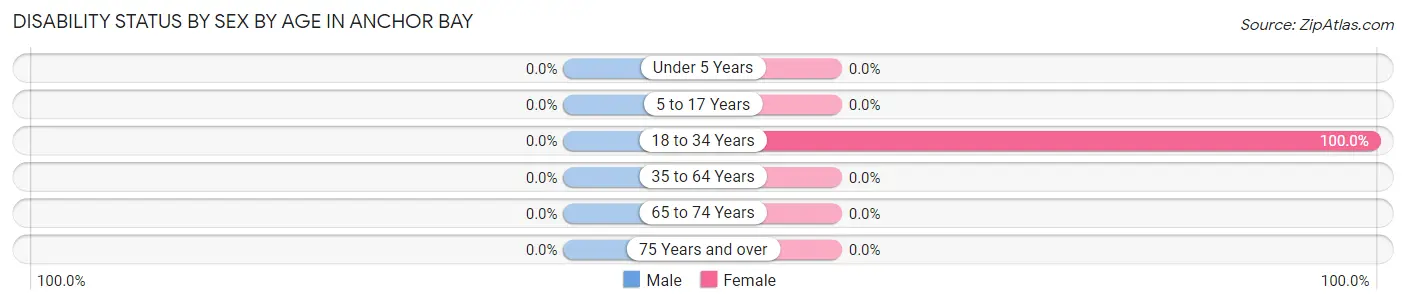
| Age Bracket | Male | Female |
| Under 5 Years | 0 (0.0%) | 0 (0.0%) |
| 5 to 17 Years | 0 (0.0%) | 0 (0.0%) |
| 18 to 34 Years | 0 (0.0%) | 12 (100.0%) |
| 35 to 64 Years | 0 (0.0%) | 0 (0.0%) |
| 65 to 74 Years | 0 (0.0%) | 0 (0.0%) |
| 75 Years and over | 0 (0.0%) | 0 (0.0%) |
Disability Class by Sex by Age in Anchor Bay
Disability Class: Hearing Difficulty
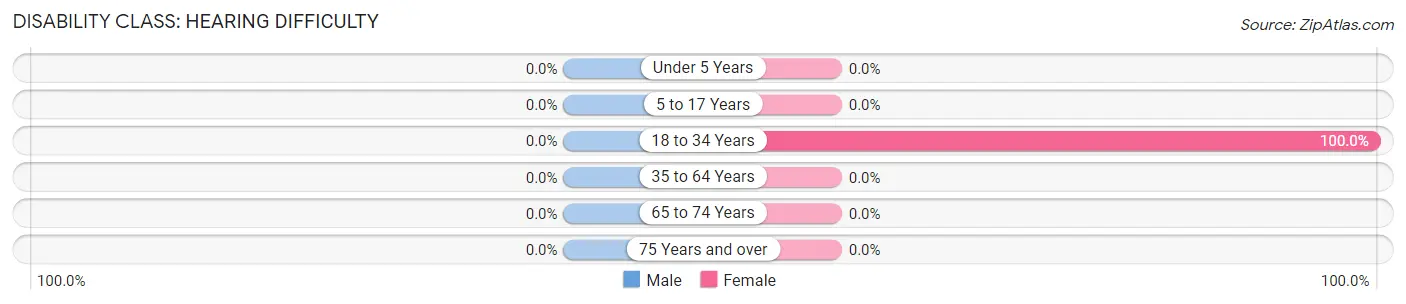
| Age Bracket | Male | Female |
| Under 5 Years | 0 (0.0%) | 0 (0.0%) |
| 5 to 17 Years | 0 (0.0%) | 0 (0.0%) |
| 18 to 34 Years | 0 (0.0%) | 12 (100.0%) |
| 35 to 64 Years | 0 (0.0%) | 0 (0.0%) |
| 65 to 74 Years | 0 (0.0%) | 0 (0.0%) |
| 75 Years and over | 0 (0.0%) | 0 (0.0%) |
Disability Class: Vision Difficulty
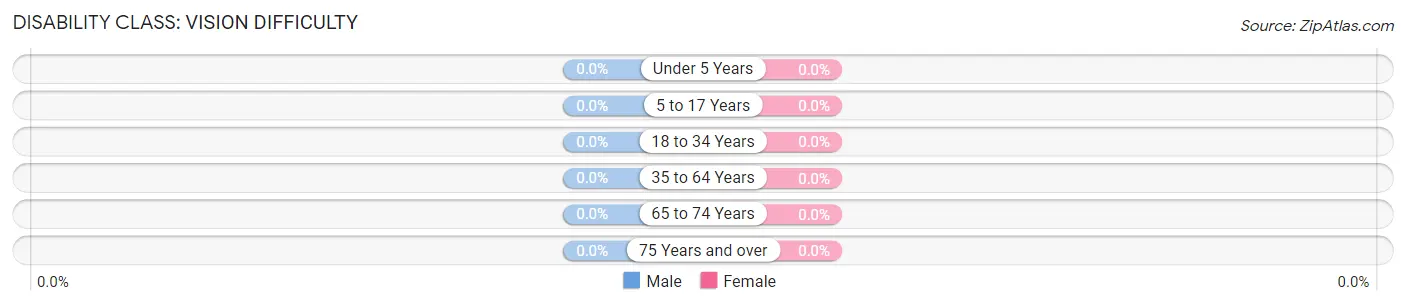
| Age Bracket | Male | Female |
| Under 5 Years | 0 (0.0%) | 0 (0.0%) |
| 5 to 17 Years | 0 (0.0%) | 0 (0.0%) |
| 18 to 34 Years | 0 (0.0%) | 0 (0.0%) |
| 35 to 64 Years | 0 (0.0%) | 0 (0.0%) |
| 65 to 74 Years | 0 (0.0%) | 0 (0.0%) |
| 75 Years and over | 0 (0.0%) | 0 (0.0%) |
Disability Class: Cognitive Difficulty
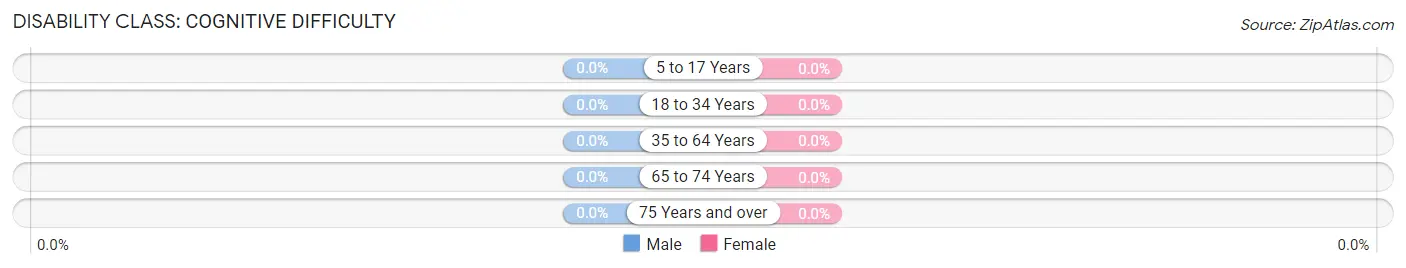
| Age Bracket | Male | Female |
| 5 to 17 Years | 0 (0.0%) | 0 (0.0%) |
| 18 to 34 Years | 0 (0.0%) | 0 (0.0%) |
| 35 to 64 Years | 0 (0.0%) | 0 (0.0%) |
| 65 to 74 Years | 0 (0.0%) | 0 (0.0%) |
| 75 Years and over | 0 (0.0%) | 0 (0.0%) |
Disability Class: Ambulatory Difficulty
| Age Bracket | Male | Female |
| 5 to 17 Years | 0 (0.0%) | 0 (0.0%) |
| 18 to 34 Years | 0 (0.0%) | 0 (0.0%) |
| 35 to 64 Years | 0 (0.0%) | 0 (0.0%) |
| 65 to 74 Years | 0 (0.0%) | 0 (0.0%) |
| 75 Years and over | 0 (0.0%) | 0 (0.0%) |
Disability Class: Self-Care Difficulty
| Age Bracket | Male | Female |
| 5 to 17 Years | 0 (0.0%) | 0 (0.0%) |
| 18 to 34 Years | 0 (0.0%) | 0 (0.0%) |
| 35 to 64 Years | 0 (0.0%) | 0 (0.0%) |
| 65 to 74 Years | 0 (0.0%) | 0 (0.0%) |
| 75 Years and over | 0 (0.0%) | 0 (0.0%) |
Technology Access in Anchor Bay
Computing Device Access in Anchor Bay
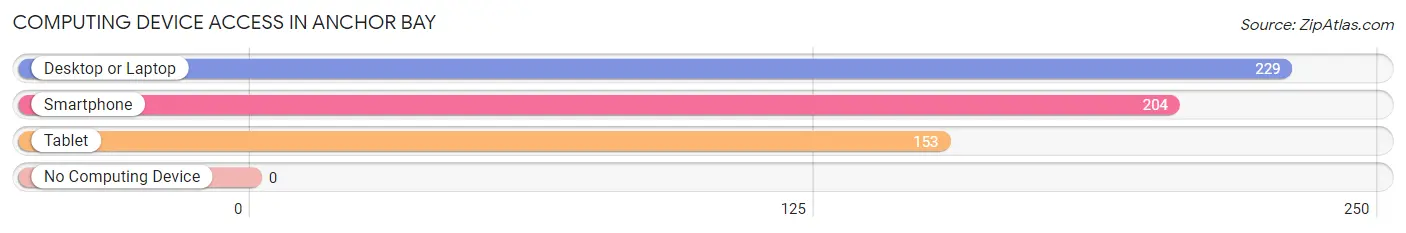
| Device Type | # Households | % Households |
| Desktop or Laptop | 229 | 90.9% |
| Smartphone | 204 | 80.9% |
| Tablet | 153 | 60.7% |
| No Computing Device | 0 | 0.0% |
| Total | 252 | 100.0% |
Internet Access in Anchor Bay
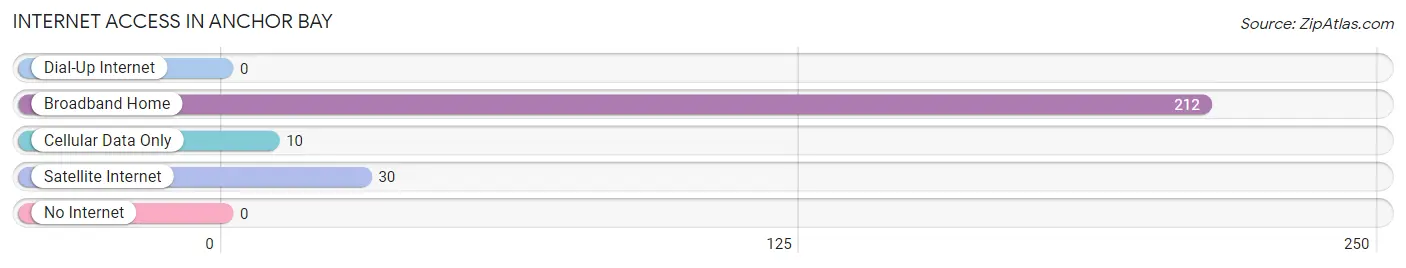
| Internet Type | # Households | % Households |
| Dial-Up Internet | 0 | 0.0% |
| Broadband Home | 212 | 84.1% |
| Cellular Data Only | 10 | 4.0% |
| Satellite Internet | 30 | 11.9% |
| No Internet | 0 | 0.0% |
| Total | 252 | 100.0% |
Anchor Bay Summary
Anchor Bay is a small unincorporated community located in Sonoma County, California. It is situated on the western shore of Tomales Bay, approximately 15 miles north of the city of Bodega Bay. Anchor Bay is a popular destination for tourists, offering a variety of recreational activities such as fishing, kayaking, and beachcombing.
History
The area now known as Anchor Bay was originally inhabited by the Coast Miwok Native Americans. The first European settlers arrived in the area in the mid-1800s, and the town was officially established in 1867. The town was named after the nearby Anchor Rock, which was used as an anchor point for ships entering Tomales Bay.
In the early 1900s, the town was a popular destination for tourists, who came to enjoy the area’s natural beauty and recreational activities. The town was also home to a number of commercial fishing operations, which provided employment for many of the local residents.
In the 1950s, the town began to decline as the commercial fishing industry moved elsewhere. In the 1970s, the town was revitalized as a tourist destination, and today it is a popular spot for visitors from all over the world.
Geography
Anchor Bay is located on the western shore of Tomales Bay, approximately 15 miles north of the city of Bodega Bay. The town is situated on a small peninsula, surrounded by the Pacific Ocean to the west and Tomales Bay to the east. The area is characterized by rolling hills, rocky cliffs, and sandy beaches.
The climate in Anchor Bay is mild and temperate, with average temperatures ranging from the mid-50s to the mid-70s throughout the year. The area receives an average of 25 inches of rain per year, with most of the precipitation occurring during the winter months.
Economy
The economy of Anchor Bay is largely based on tourism. The town is a popular destination for visitors from all over the world, who come to enjoy the area’s natural beauty and recreational activities. The town is also home to a number of commercial fishing operations, which provide employment for many of the local residents.
In addition to tourism and fishing, Anchor Bay is home to a number of small businesses, including restaurants, shops, and galleries. The town is also home to a number of bed and breakfasts, which provide lodging for visitors.
Demographics
As of the 2010 census, the population of Anchor Bay was 1,845. The population is predominantly white (90.2%), with small percentages of Hispanic (4.2%), Asian (2.2%), and African American (1.2%) residents. The median household income in Anchor Bay is $50,000, and the median age is 44.
Conclusion
Anchor Bay is a small unincorporated community located in Sonoma County, California. It is situated on the western shore of Tomales Bay, approximately 15 miles north of the city of Bodega Bay. Anchor Bay is a popular destination for tourists, offering a variety of recreational activities such as fishing, kayaking, and beachcombing. The economy of Anchor Bay is largely based on tourism, with a number of small businesses and commercial fishing operations providing employment for many of the local residents. The population of Anchor Bay is predominantly white, with small percentages of Hispanic, Asian, and African American residents.
Common Questions
What is Per Capita Income in Anchor Bay?
Per Capita income in Anchor Bay is $44,983.
What is the Median Family Income in Anchor Bay?
Median Family Income in Anchor Bay is $79,398.
What is the Median Household income in Anchor Bay?
Median Household Income in Anchor Bay is $68,452.
What is Inequality or Gini Index in Anchor Bay?
Inequality or Gini Index in Anchor Bay is 0.22.
What is the Total Population of Anchor Bay?
Total Population of Anchor Bay is 369.
What is the Total Male Population of Anchor Bay?
Total Male Population of Anchor Bay is 156.
What is the Total Female Population of Anchor Bay?
Total Female Population of Anchor Bay is 213.
What is the Ratio of Males per 100 Females in Anchor Bay?
There are 73.24 Males per 100 Females in Anchor Bay.
What is the Ratio of Females per 100 Males in Anchor Bay?
There are 136.54 Females per 100 Males in Anchor Bay.
What is the Median Population Age in Anchor Bay?
Median Population Age in Anchor Bay is 63.9 Years.
What is the Average Family Size in Anchor Bay
Average Family Size in Anchor Bay is 1.9 People.
What is the Average Household Size in Anchor Bay
Average Household Size in Anchor Bay is 1.5 People.
How Large is the Labor Force in Anchor Bay?
There are 158 People in the Labor Forcein in Anchor Bay.
What is the Percentage of People in the Labor Force in Anchor Bay?
42.8% of People are in the Labor Force in Anchor Bay.