Cities with the Highest Percentage of Population with a Degree in Liberal Arts and History in Massachusetts
RELATED REPORTS & OPTIONS
Liberal Arts and History
Massachusetts
Compare Cities
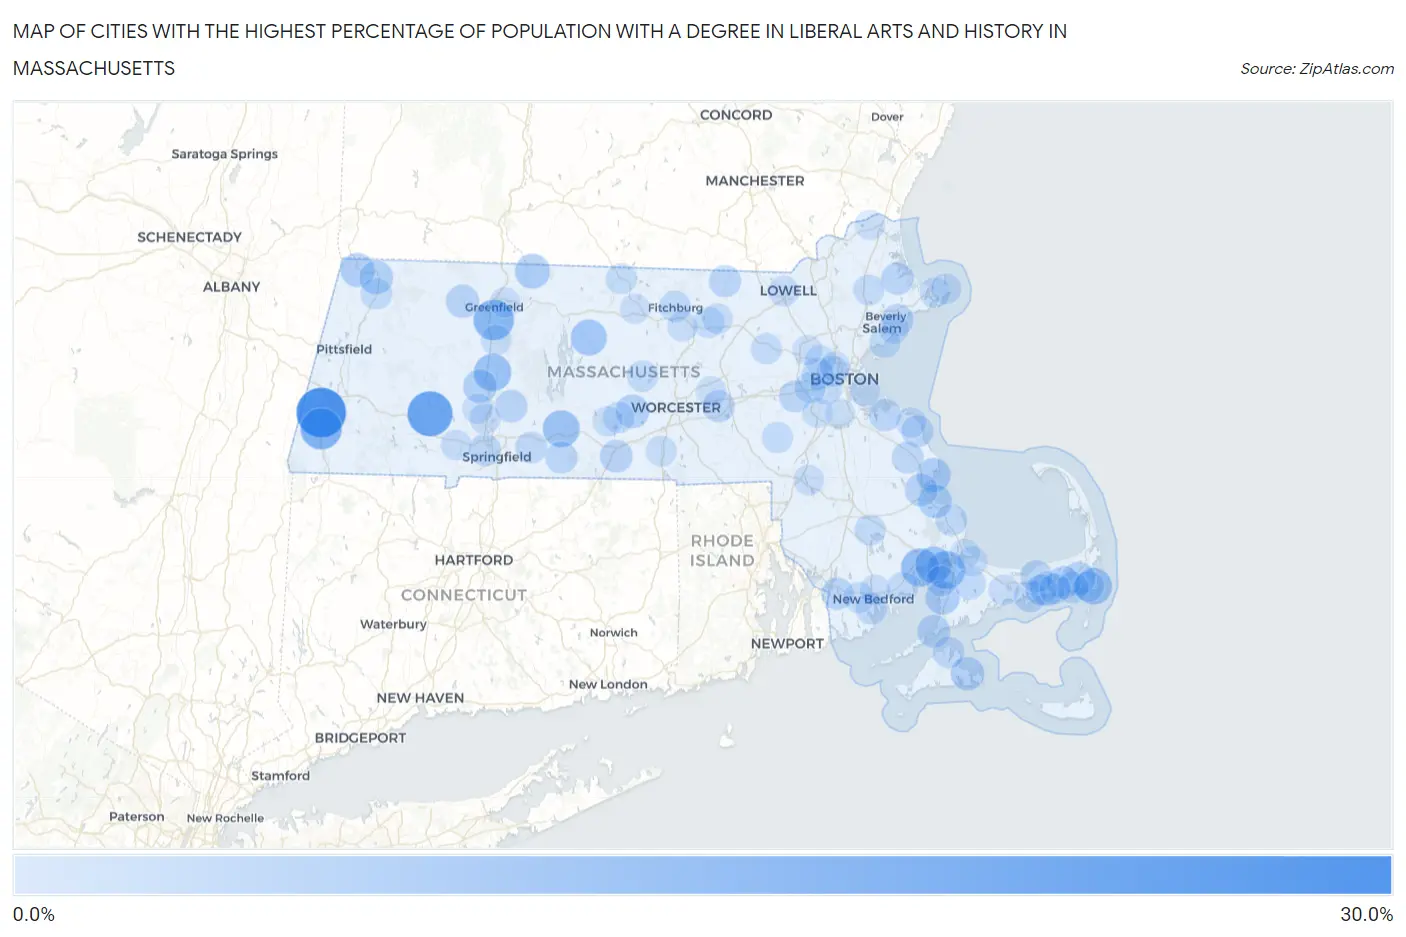
Map of Cities with the Highest Percentage of Population with a Degree in Liberal Arts and History in Massachusetts
0.0%
30.0%
Cities with the Highest Percentage of Population with a Degree in Liberal Arts and History in Massachusetts
| City | % Graduates | vs State | vs National | |
| 1. | Housatonic | 29.5% | 5.5%(+24.0)#1 | 4.9%(+24.6)#676 |
| 2. | Huntington | 23.8% | 5.5%(+18.3)#2 | 4.9%(+18.9)#977 |
| 3. | Great Barrington | 19.2% | 5.5%(+13.7)#3 | 4.9%(+14.3)#1,372 |
| 4. | Deerfield | 18.3% | 5.5%(+12.8)#4 | 4.9%(+13.4)#1,470 |
| 5. | Bourne | 15.3% | 5.5%(+9.84)#5 | 4.9%(+10.4)#1,998 |
| 6. | Weweantic | 15.2% | 5.5%(+9.74)#6 | 4.9%(+10.3)#2,005 |
| 7. | Hatfield | 14.6% | 5.5%(+9.09)#7 | 4.9%(+9.69)#2,141 |
| 8. | Palmer Town | 14.0% | 5.5%(+8.54)#8 | 4.9%(+9.14)#2,299 |
| 9. | Onset | 13.9% | 5.5%(+8.46)#9 | 4.9%(+9.07)#2,321 |
| 10. | Chatham | 13.6% | 5.5%(+8.15)#10 | 4.9%(+8.76)#2,431 |
| 11. | Petersham | 12.9% | 5.5%(+7.39)#11 | 4.9%(+8.00)#2,654 |
| 12. | Amherst | 11.8% | 5.5%(+6.29)#12 | 4.9%(+6.89)#3,062 |
| 13. | Northfield | 11.4% | 5.5%(+5.92)#13 | 4.9%(+6.53)#3,226 |
| 14. | West Dennis | 10.8% | 5.5%(+5.34)#14 | 4.9%(+5.95)#3,526 |
| 15. | North Falmouth | 10.8% | 5.5%(+5.27)#15 | 4.9%(+5.88)#3,560 |
| 16. | Williamstown | 10.6% | 5.5%(+5.13)#16 | 4.9%(+5.74)#3,625 |
| 17. | Duxbury | 10.6% | 5.5%(+5.11)#17 | 4.9%(+5.72)#3,641 |
| 18. | Plymouth | 10.4% | 5.5%(+4.88)#18 | 4.9%(+5.48)#3,778 |
| 19. | North Adams | 10.2% | 5.5%(+4.74)#19 | 4.9%(+5.35)#3,853 |
| 20. | East Harwich | 10.1% | 5.5%(+4.66)#20 | 4.9%(+5.27)#3,897 |
| 21. | Northampton | 10.1% | 5.5%(+4.61)#21 | 4.9%(+5.22)#3,925 |
| 22. | Spencer | 9.9% | 5.5%(+4.45)#22 | 4.9%(+5.06)#4,036 |
| 23. | Edgartown | 9.8% | 5.5%(+4.31)#23 | 4.9%(+4.92)#4,111 |
| 24. | Shelburne Falls | 9.5% | 5.5%(+4.07)#24 | 4.9%(+4.67)#4,291 |
| 25. | Northwest Harwich | 9.5% | 5.5%(+3.97)#25 | 4.9%(+4.58)#4,358 |
| 26. | Cedar Crest | 9.4% | 5.5%(+3.93)#26 | 4.9%(+4.54)#4,390 |
| 27. | Woods Hole | 9.4% | 5.5%(+3.92)#27 | 4.9%(+4.53)#4,402 |
| 28. | Kingston | 9.2% | 5.5%(+3.68)#28 | 4.9%(+4.29)#4,585 |
| 29. | Sturbridge | 9.2% | 5.5%(+3.67)#29 | 4.9%(+4.28)#4,590 |
| 30. | Ipswich | 8.7% | 5.5%(+3.25)#30 | 4.9%(+3.86)#4,941 |
| 31. | Granby | 8.7% | 5.5%(+3.21)#31 | 4.9%(+3.82)#5,000 |
| 32. | Beverly | 8.6% | 5.5%(+3.13)#32 | 4.9%(+3.74)#5,049 |
| 33. | Hingham | 8.5% | 5.5%(+3.05)#33 | 4.9%(+3.66)#5,108 |
| 34. | North Westport | 8.5% | 5.5%(+3.02)#34 | 4.9%(+3.62)#5,146 |
| 35. | West Yarmouth | 8.4% | 5.5%(+2.93)#35 | 4.9%(+3.54)#5,195 |
| 36. | Westborough | 8.4% | 5.5%(+2.92)#36 | 4.9%(+3.53)#5,204 |
| 37. | Pepperell | 8.4% | 5.5%(+2.91)#37 | 4.9%(+3.52)#5,220 |
| 38. | Yarmouth Port | 8.3% | 5.5%(+2.78)#38 | 4.9%(+3.38)#5,404 |
| 39. | Monson Center | 8.2% | 5.5%(+2.73)#39 | 4.9%(+3.33)#5,452 |
| 40. | West Springfield Town | 8.2% | 5.5%(+2.71)#40 | 4.9%(+3.32)#5,469 |
| 41. | Wellesley | 8.2% | 5.5%(+2.71)#41 | 4.9%(+3.32)#5,471 |
| 42. | Scituate | 8.1% | 5.5%(+2.66)#42 | 4.9%(+3.27)#5,530 |
| 43. | Wilbraham | 8.0% | 5.5%(+2.54)#43 | 4.9%(+3.15)#5,634 |
| 44. | Harwich Port | 8.0% | 5.5%(+2.49)#44 | 4.9%(+3.10)#5,696 |
| 45. | North Pembroke | 7.9% | 5.5%(+2.43)#45 | 4.9%(+3.03)#5,758 |
| 46. | Bliss Corner | 7.9% | 5.5%(+2.38)#46 | 4.9%(+2.99)#5,803 |
| 47. | The Pinehills | 7.8% | 5.5%(+2.35)#47 | 4.9%(+2.96)#5,838 |
| 48. | South Yarmouth | 7.8% | 5.5%(+2.31)#48 | 4.9%(+2.91)#5,879 |
| 49. | Vineyard Haven | 7.8% | 5.5%(+2.29)#49 | 4.9%(+2.90)#5,897 |
| 50. | Watertown Town | 7.7% | 5.5%(+2.24)#50 | 4.9%(+2.84)#5,956 |
| 51. | Adams | 7.6% | 5.5%(+2.13)#51 | 4.9%(+2.74)#6,087 |
| 52. | Fitchburg | 7.6% | 5.5%(+2.09)#52 | 4.9%(+2.69)#6,146 |
| 53. | Brookline | 7.6% | 5.5%(+2.09)#53 | 4.9%(+2.69)#6,147 |
| 54. | Dennis Port | 7.4% | 5.5%(+1.92)#54 | 4.9%(+2.52)#6,343 |
| 55. | East Brookfield | 7.4% | 5.5%(+1.90)#55 | 4.9%(+2.51)#6,356 |
| 56. | Forestdale | 7.4% | 5.5%(+1.87)#56 | 4.9%(+2.48)#6,397 |
| 57. | Rutland | 7.3% | 5.5%(+1.85)#57 | 4.9%(+2.45)#6,433 |
| 58. | North Lakeville | 7.3% | 5.5%(+1.82)#58 | 4.9%(+2.43)#6,463 |
| 59. | Cambridge | 7.3% | 5.5%(+1.79)#59 | 4.9%(+2.40)#6,488 |
| 60. | Greenfield | 7.3% | 5.5%(+1.79)#60 | 4.9%(+2.40)#6,499 |
| 61. | Millis Clicquot | 7.2% | 5.5%(+1.74)#61 | 4.9%(+2.35)#6,548 |
| 62. | Shirley | 7.2% | 5.5%(+1.70)#62 | 4.9%(+2.31)#6,596 |
| 63. | Newton | 7.1% | 5.5%(+1.65)#63 | 4.9%(+2.26)#6,706 |
| 64. | Mattapoisett Center | 7.1% | 5.5%(+1.60)#64 | 4.9%(+2.20)#6,775 |
| 65. | West Concord | 7.0% | 5.5%(+1.57)#65 | 4.9%(+2.18)#6,813 |
| 66. | Winchendon | 7.0% | 5.5%(+1.54)#66 | 4.9%(+2.15)#6,847 |
| 67. | West Chatham | 7.0% | 5.5%(+1.54)#67 | 4.9%(+2.15)#6,854 |
| 68. | Topsfield | 7.0% | 5.5%(+1.51)#68 | 4.9%(+2.12)#6,895 |
| 69. | Swampscott | 7.0% | 5.5%(+1.49)#69 | 4.9%(+2.10)#6,917 |
| 70. | Green Harbor | 6.9% | 5.5%(+1.46)#70 | 4.9%(+2.07)#6,952 |
| 71. | Oxford | 6.9% | 5.5%(+1.42)#71 | 4.9%(+2.03)#7,000 |
| 72. | Smith Mills | 6.9% | 5.5%(+1.37)#72 | 4.9%(+1.98)#7,082 |
| 73. | New Bedford | 6.8% | 5.5%(+1.33)#73 | 4.9%(+1.94)#7,143 |
| 74. | Gloucester | 6.8% | 5.5%(+1.32)#74 | 4.9%(+1.93)#7,156 |
| 75. | Pocasset | 6.8% | 5.5%(+1.30)#75 | 4.9%(+1.91)#7,170 |
| 76. | Lowell | 6.8% | 5.5%(+1.28)#76 | 4.9%(+1.89)#7,207 |
| 77. | Westfield | 6.7% | 5.5%(+1.27)#77 | 4.9%(+1.88)#7,219 |
| 78. | Devens | 6.7% | 5.5%(+1.23)#78 | 4.9%(+1.83)#7,278 |
| 79. | Rockport | 6.7% | 5.5%(+1.20)#79 | 4.9%(+1.81)#7,306 |
| 80. | Mansfield Center | 6.6% | 5.5%(+1.16)#80 | 4.9%(+1.77)#7,393 |
| 81. | Barnstable Town | 6.6% | 5.5%(+1.16)#81 | 4.9%(+1.77)#7,396 |
| 82. | South Deerfield | 6.6% | 5.5%(+1.07)#82 | 4.9%(+1.68)#7,517 |
| 83. | Turners Falls | 6.5% | 5.5%(+1.06)#83 | 4.9%(+1.67)#7,521 |
| 84. | Holyoke | 6.5% | 5.5%(+1.05)#84 | 4.9%(+1.66)#7,538 |
| 85. | Easthampton Town | 6.5% | 5.5%(+1.03)#85 | 4.9%(+1.64)#7,559 |
| 86. | Salem | 6.5% | 5.5%(+0.982)#86 | 4.9%(+1.59)#7,639 |
| 87. | North Scituate | 6.4% | 5.5%(+0.953)#87 | 4.9%(+1.56)#7,701 |
| 88. | Leominster | 6.4% | 5.5%(+0.884)#88 | 4.9%(+1.49)#7,798 |
| 89. | Dedham | 6.3% | 5.5%(+0.816)#89 | 4.9%(+1.43)#7,893 |
| 90. | Arlington | 6.3% | 5.5%(+0.793)#90 | 4.9%(+1.40)#7,933 |
| 91. | Boston | 6.3% | 5.5%(+0.772)#91 | 4.9%(+1.38)#7,951 |
| 92. | Brookfield | 6.2% | 5.5%(+0.769)#92 | 4.9%(+1.38)#7,962 |
| 93. | Sandwich | 6.2% | 5.5%(+0.747)#93 | 4.9%(+1.36)#8,044 |
| 94. | Gardner | 6.2% | 5.5%(+0.745)#94 | 4.9%(+1.35)#8,046 |
| 95. | Northborough | 6.1% | 5.5%(+0.669)#95 | 4.9%(+1.28)#8,158 |
| 96. | Sagamore | 6.1% | 5.5%(+0.653)#96 | 4.9%(+1.26)#8,176 |
| 97. | Lexington | 6.1% | 5.5%(+0.578)#97 | 4.9%(+1.19)#8,298 |
| 98. | Milton | 6.1% | 5.5%(+0.572)#98 | 4.9%(+1.18)#8,305 |
| 99. | Amesbury Town | 6.0% | 5.5%(+0.558)#99 | 4.9%(+1.17)#8,334 |
| 100. | Somerville | 5.9% | 5.5%(+0.456)#100 | 4.9%(+1.07)#8,509 |
Common Questions
What are the Top 10 Cities with the Highest Percentage of Population with a Degree in Liberal Arts and History in Massachusetts?
Top 10 Cities with the Highest Percentage of Population with a Degree in Liberal Arts and History in Massachusetts are:
#1
29.5%
#2
23.8%
#3
19.2%
#4
18.3%
#5
15.3%
#6
15.2%
#7
14.6%
#8
14.0%
#9
13.9%
#10
13.6%
What city has the Highest Percentage of Population with a Degree in Liberal Arts and History in Massachusetts?
Housatonic has the Highest Percentage of Population with a Degree in Liberal Arts and History in Massachusetts with 29.5%.
What is the Percentage of Population with a Degree in Liberal Arts and History in the State of Massachusetts?
Percentage of Population with a Degree in Liberal Arts and History in Massachusetts is 5.5%.
What is the Percentage of Population with a Degree in Liberal Arts and History in the United States?
Percentage of Population with a Degree in Liberal Arts and History in the United States is 4.9%.