Cities with the Highest Percentage of Population with a Degree in Liberal Arts and History in South Carolina
RELATED REPORTS & OPTIONS
Liberal Arts and History
South Carolina
Compare Cities
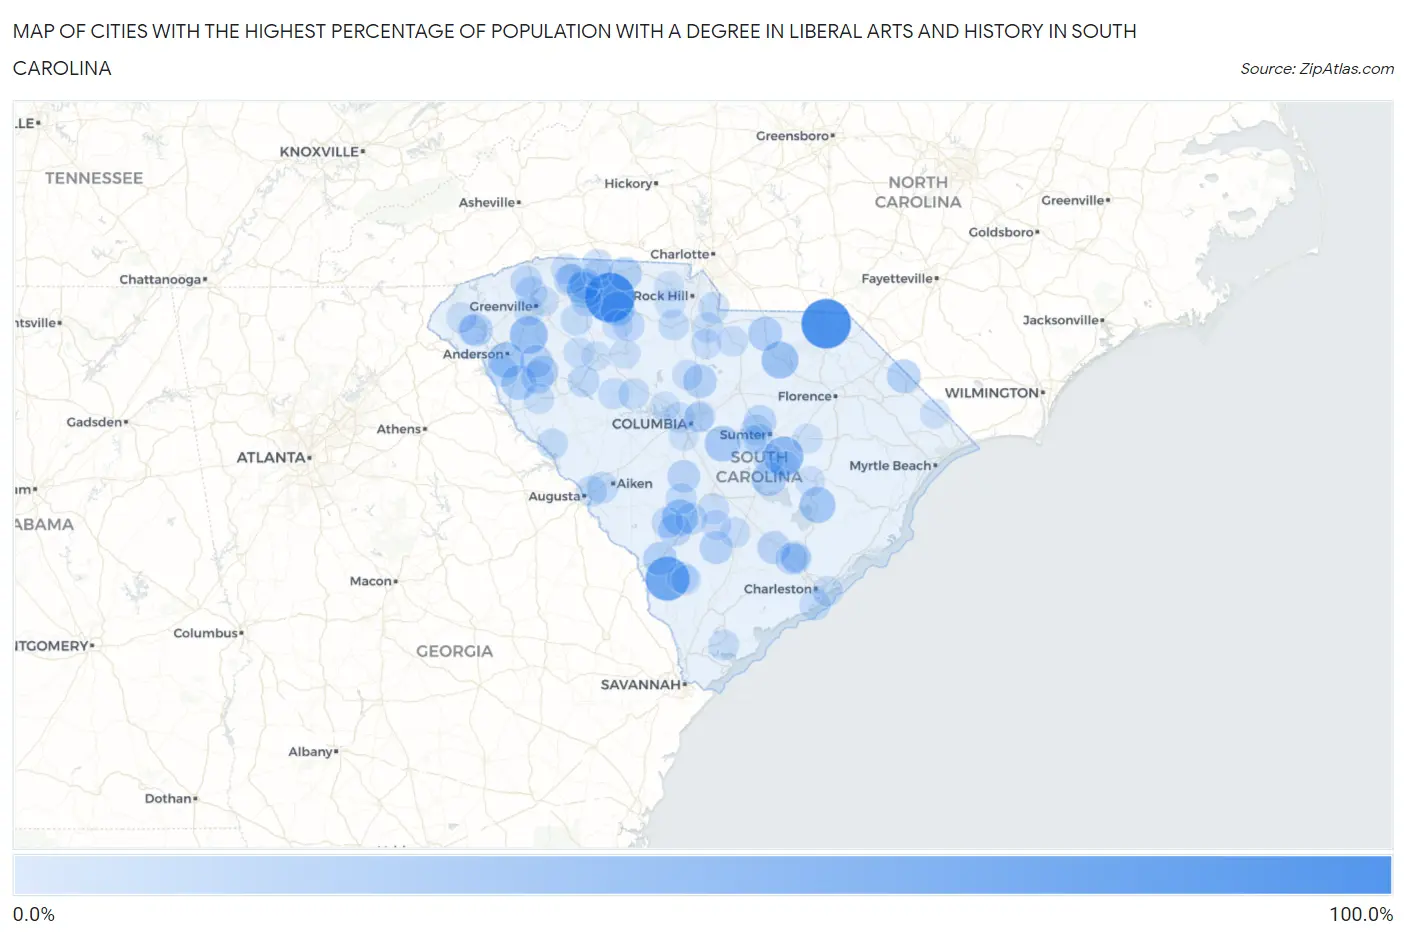
Map of Cities with the Highest Percentage of Population with a Degree in Liberal Arts and History in South Carolina
0.0%
100.0%
Cities with the Highest Percentage of Population with a Degree in Liberal Arts and History in South Carolina
| City | % Graduates | vs State | vs National | |
| 1. | Wallace | 100.0% | 5.2%(+94.8)#1 | 4.9%(+95.1)#6 |
| 2. | South Union | 100.0% | 5.2%(+94.8)#2 | 4.9%(+95.1)#11 |
| 3. | Central Pacolet | 100.0% | 5.2%(+94.8)#3 | 4.9%(+95.1)#36 |
| 4. | Gifford | 72.7% | 5.2%(+67.5)#4 | 4.9%(+67.9)#124 |
| 5. | Alcolu | 51.6% | 5.2%(+46.4)#5 | 4.9%(+46.7)#217 |
| 6. | Pelzer | 44.0% | 5.2%(+38.8)#6 | 4.9%(+39.1)#321 |
| 7. | Mcbee | 39.6% | 5.2%(+34.4)#7 | 4.9%(+34.7)#393 |
| 8. | Denmark | 36.1% | 5.2%(+30.9)#8 | 4.9%(+31.2)#456 |
| 9. | St Stephen | 34.8% | 5.2%(+29.6)#9 | 4.9%(+29.9)#489 |
| 10. | Homeland Park | 34.6% | 5.2%(+29.4)#10 | 4.9%(+29.7)#492 |
| 11. | Saxon | 33.5% | 5.2%(+28.3)#11 | 4.9%(+28.6)#515 |
| 12. | Gadsden | 33.1% | 5.2%(+27.9)#12 | 4.9%(+28.2)#567 |
| 13. | Antreville | 29.7% | 5.2%(+24.5)#13 | 4.9%(+24.9)#669 |
| 14. | Jonesville | 28.8% | 5.2%(+23.6)#14 | 4.9%(+24.0)#697 |
| 15. | Dacusville | 28.0% | 5.2%(+22.8)#15 | 4.9%(+23.1)#736 |
| 16. | Hamer | 27.9% | 5.2%(+22.7)#16 | 4.9%(+23.0)#741 |
| 17. | Summerton | 27.3% | 5.2%(+22.1)#17 | 4.9%(+22.4)#770 |
| 18. | Jefferson | 26.7% | 5.2%(+21.5)#18 | 4.9%(+21.8)#806 |
| 19. | Lake View | 25.0% | 5.2%(+19.8)#19 | 4.9%(+20.1)#889 |
| 20. | Little Rock | 25.0% | 5.2%(+19.8)#20 | 4.9%(+20.1)#892 |
| 21. | Allendale | 24.4% | 5.2%(+19.2)#21 | 4.9%(+19.5)#944 |
| 22. | East Gaffney | 23.8% | 5.2%(+18.6)#22 | 4.9%(+18.9)#978 |
| 23. | Ridgeway | 23.3% | 5.2%(+18.1)#23 | 4.9%(+18.5)#1,012 |
| 24. | Smoaks | 22.2% | 5.2%(+17.0)#24 | 4.9%(+17.4)#1,092 |
| 25. | Utica | 21.6% | 5.2%(+16.4)#25 | 4.9%(+16.7)#1,137 |
| 26. | Govan | 21.1% | 5.2%(+15.9)#26 | 4.9%(+16.2)#1,191 |
| 27. | Due West | 20.6% | 5.2%(+15.4)#27 | 4.9%(+15.7)#1,224 |
| 28. | Ridgeville | 20.5% | 5.2%(+15.3)#28 | 4.9%(+15.6)#1,227 |
| 29. | North | 20.5% | 5.2%(+15.3)#29 | 4.9%(+15.6)#1,229 |
| 30. | Honea Path | 20.1% | 5.2%(+14.9)#30 | 4.9%(+15.2)#1,257 |
| 31. | Dalzell | 19.3% | 5.2%(+14.1)#31 | 4.9%(+14.4)#1,355 |
| 32. | Inman Mills | 18.0% | 5.2%(+12.8)#32 | 4.9%(+13.2)#1,511 |
| 33. | Southern Shops | 17.7% | 5.2%(+12.5)#33 | 4.9%(+12.8)#1,552 |
| 34. | Adams Run | 17.1% | 5.2%(+11.9)#34 | 4.9%(+12.2)#1,650 |
| 35. | Drayton | 16.9% | 5.2%(+11.7)#35 | 4.9%(+12.1)#1,668 |
| 36. | Lincolnville | 16.9% | 5.2%(+11.7)#36 | 4.9%(+12.0)#1,672 |
| 37. | Donalds | 16.7% | 5.2%(+11.5)#37 | 4.9%(+11.8)#1,713 |
| 38. | Travelers Rest | 16.4% | 5.2%(+11.2)#38 | 4.9%(+11.5)#1,787 |
| 39. | Monarch Mill | 16.2% | 5.2%(+11.0)#39 | 4.9%(+11.3)#1,809 |
| 40. | Bamberg | 15.9% | 5.2%(+10.7)#40 | 4.9%(+11.0)#1,873 |
| 41. | Cross Hill | 15.8% | 5.2%(+10.6)#41 | 4.9%(+10.9)#1,894 |
| 42. | Gloverville | 15.7% | 5.2%(+10.5)#42 | 4.9%(+10.8)#1,914 |
| 43. | Slater Marietta | 15.7% | 5.2%(+10.5)#43 | 4.9%(+10.8)#1,916 |
| 44. | Chesnee | 15.4% | 5.2%(+10.2)#44 | 4.9%(+10.5)#1,970 |
| 45. | Hilda | 15.4% | 5.2%(+10.2)#45 | 4.9%(+10.5)#1,973 |
| 46. | Woodruff | 14.7% | 5.2%(+9.52)#46 | 4.9%(+9.85)#2,100 |
| 47. | Norway | 14.3% | 5.2%(+9.09)#47 | 4.9%(+9.41)#2,217 |
| 48. | Clearwater | 14.1% | 5.2%(+8.85)#48 | 4.9%(+9.18)#2,292 |
| 49. | Starr | 13.8% | 5.2%(+8.59)#49 | 4.9%(+8.92)#2,363 |
| 50. | Cherryvale | 13.8% | 5.2%(+8.56)#50 | 4.9%(+8.89)#2,372 |
| 51. | Valley Falls | 13.7% | 5.2%(+8.53)#51 | 4.9%(+8.86)#2,380 |
| 52. | Hampton | 13.1% | 5.2%(+7.95)#52 | 4.9%(+8.28)#2,570 |
| 53. | Folly Beach | 12.9% | 5.2%(+7.68)#53 | 4.9%(+8.01)#2,650 |
| 54. | Silverstreet | 12.5% | 5.2%(+7.30)#54 | 4.9%(+7.63)#2,794 |
| 55. | Eureka Mill | 12.2% | 5.2%(+7.00)#55 | 4.9%(+7.32)#2,885 |
| 56. | Plum Branch | 12.2% | 5.2%(+7.00)#56 | 4.9%(+7.32)#2,895 |
| 57. | Prosperity | 12.0% | 5.2%(+6.85)#57 | 4.9%(+7.18)#2,951 |
| 58. | Van Wyck | 12.0% | 5.2%(+6.77)#58 | 4.9%(+7.09)#2,993 |
| 59. | Fort Lawn | 11.9% | 5.2%(+6.67)#59 | 4.9%(+6.99)#3,029 |
| 60. | Rowesville | 11.8% | 5.2%(+6.57)#60 | 4.9%(+6.89)#3,074 |
| 61. | Sangaree | 11.7% | 5.2%(+6.54)#61 | 4.9%(+6.87)#3,097 |
| 62. | Heath Springs | 11.7% | 5.2%(+6.45)#62 | 4.9%(+6.78)#3,128 |
| 63. | Seven Oaks | 11.4% | 5.2%(+6.24)#63 | 4.9%(+6.56)#3,207 |
| 64. | Roebuck | 11.4% | 5.2%(+6.17)#64 | 4.9%(+6.49)#3,237 |
| 65. | Winnsboro Mills | 11.4% | 5.2%(+6.17)#65 | 4.9%(+6.49)#3,238 |
| 66. | Homewood | 11.3% | 5.2%(+6.10)#66 | 4.9%(+6.43)#3,268 |
| 67. | Shell Point | 11.3% | 5.2%(+6.06)#67 | 4.9%(+6.39)#3,283 |
| 68. | Abbeville | 11.1% | 5.2%(+5.93)#68 | 4.9%(+6.26)#3,331 |
| 69. | Arcadia Lakes | 11.1% | 5.2%(+5.91)#69 | 4.9%(+6.24)#3,341 |
| 70. | Sullivan S Island | 11.0% | 5.2%(+5.77)#70 | 4.9%(+6.09)#3,443 |
| 71. | Cane Savannah | 10.9% | 5.2%(+5.71)#71 | 4.9%(+6.03)#3,479 |
| 72. | Campobello | 10.8% | 5.2%(+5.63)#72 | 4.9%(+5.96)#3,519 |
| 73. | Paxville | 10.8% | 5.2%(+5.61)#73 | 4.9%(+5.94)#3,535 |
| 74. | Laurens | 10.8% | 5.2%(+5.58)#74 | 4.9%(+5.91)#3,548 |
| 75. | Walhalla | 10.5% | 5.2%(+5.27)#75 | 4.9%(+5.60)#3,727 |
| 76. | Reevesville | 10.4% | 5.2%(+5.25)#76 | 4.9%(+5.58)#3,738 |
| 77. | Buffalo | 10.3% | 5.2%(+5.06)#77 | 4.9%(+5.38)#3,828 |
| 78. | White Knoll | 10.2% | 5.2%(+4.99)#78 | 4.9%(+5.31)#3,874 |
| 79. | Great Falls | 10.0% | 5.2%(+4.80)#79 | 4.9%(+5.13)#3,965 |
| 80. | Branchville | 10.0% | 5.2%(+4.80)#80 | 4.9%(+5.13)#3,967 |
| 81. | Ladson | 10.0% | 5.2%(+4.75)#81 | 4.9%(+5.08)#4,031 |
| 82. | Seneca | 9.8% | 5.2%(+4.62)#82 | 4.9%(+4.95)#4,092 |
| 83. | Greeleyville | 9.4% | 5.2%(+4.18)#83 | 4.9%(+4.50)#4,418 |
| 84. | Whitmire | 9.2% | 5.2%(+4.03)#84 | 4.9%(+4.36)#4,528 |
| 85. | Chickasaw Point | 9.2% | 5.2%(+3.98)#85 | 4.9%(+4.30)#4,576 |
| 86. | Welcome | 9.0% | 5.2%(+3.78)#86 | 4.9%(+4.11)#4,745 |
| 87. | Inman | 9.0% | 5.2%(+3.78)#87 | 4.9%(+4.11)#4,748 |
| 88. | Turbeville | 8.8% | 5.2%(+3.57)#88 | 4.9%(+3.90)#4,905 |
| 89. | Mcconnells | 8.6% | 5.2%(+3.44)#89 | 4.9%(+3.77)#5,023 |
| 90. | Lake Murray Of Richland | 8.6% | 5.2%(+3.43)#90 | 4.9%(+3.75)#5,034 |
| 91. | Mayo | 8.6% | 5.2%(+3.39)#91 | 4.9%(+3.72)#5,066 |
| 92. | Forest Acres | 8.4% | 5.2%(+3.25)#92 | 4.9%(+3.57)#5,171 |
| 93. | Wedgefield | 8.4% | 5.2%(+3.20)#93 | 4.9%(+3.53)#5,206 |
| 94. | Loris | 8.4% | 5.2%(+3.20)#94 | 4.9%(+3.52)#5,215 |
| 95. | York | 8.3% | 5.2%(+3.10)#95 | 4.9%(+3.42)#5,369 |
| 96. | Pine Ridge | 8.3% | 5.2%(+3.09)#96 | 4.9%(+3.41)#5,379 |
| 97. | Manning | 8.2% | 5.2%(+3.04)#97 | 4.9%(+3.37)#5,416 |
| 98. | Wade Hampton | 8.2% | 5.2%(+2.99)#98 | 4.9%(+3.31)#5,472 |
| 99. | Clinton | 8.1% | 5.2%(+2.93)#99 | 4.9%(+3.26)#5,538 |
| 100. | Varnville | 8.1% | 5.2%(+2.89)#100 | 4.9%(+3.22)#5,578 |
Common Questions
What are the Top 10 Cities with the Highest Percentage of Population with a Degree in Liberal Arts and History in South Carolina?
Top 10 Cities with the Highest Percentage of Population with a Degree in Liberal Arts and History in South Carolina are:
#1
100.0%
#2
100.0%
#3
72.7%
#4
51.6%
#5
44.0%
#6
39.6%
#7
36.1%
#8
34.8%
#9
34.6%
#10
33.5%
What city has the Highest Percentage of Population with a Degree in Liberal Arts and History in South Carolina?
Wallace has the Highest Percentage of Population with a Degree in Liberal Arts and History in South Carolina with 100.0%.
What is the Percentage of Population with a Degree in Liberal Arts and History in the State of South Carolina?
Percentage of Population with a Degree in Liberal Arts and History in South Carolina is 5.2%.
What is the Percentage of Population with a Degree in Liberal Arts and History in the United States?
Percentage of Population with a Degree in Liberal Arts and History in the United States is 4.9%.