Zip Codes with the Highest Percentage of Population with a Degree in Liberal Arts and History in San Clemente, CA
RELATED REPORTS & OPTIONS
Liberal Arts and History
San Clemente
Compare Zip Codes
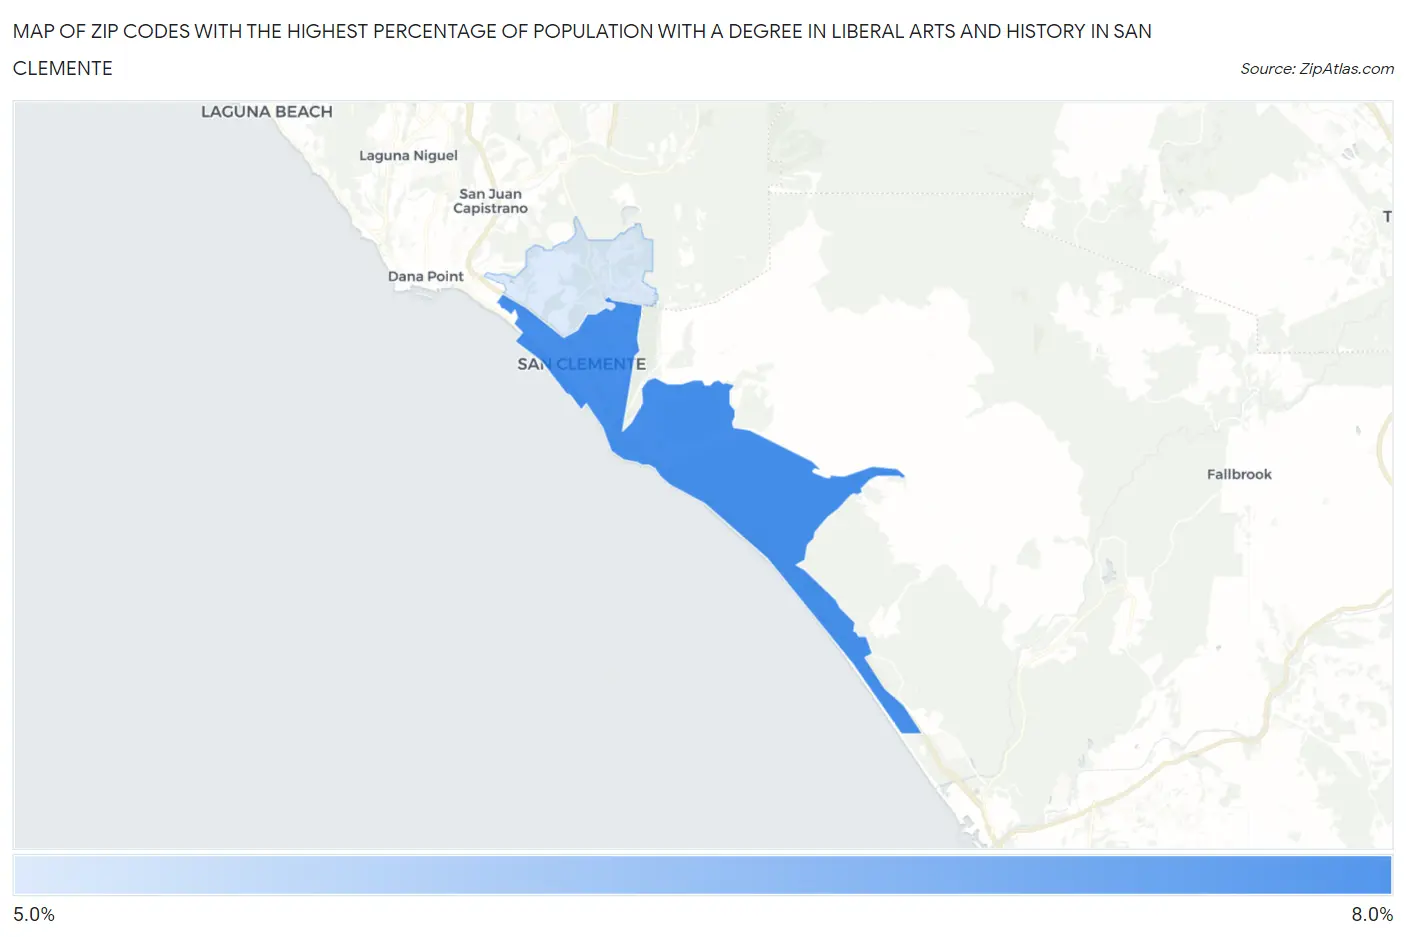
Map of Zip Codes with the Highest Percentage of Population with a Degree in Liberal Arts and History in San Clemente
5.6%
6.2%
Zip Codes with the Highest Percentage of Population with a Degree in Liberal Arts and History in San Clemente, CA
| Zip Code | % Graduates | vs State | vs National | |
| 1. | 92672 | 6.2% | 5.5%(+0.743)#679 | 4.9%(+1.37)#7,938 |
| 2. | 92673 | 5.6% | 5.5%(+0.106)#830 | 4.9%(+0.730)#9,562 |
1
Common Questions
What are the Top Zip Codes with the Highest Percentage of Population with a Degree in Liberal Arts and History in San Clemente, CA?
Top Zip Codes with the Highest Percentage of Population with a Degree in Liberal Arts and History in San Clemente, CA are:
What zip code has the Highest Percentage of Population with a Degree in Liberal Arts and History in San Clemente, CA?
92672 has the Highest Percentage of Population with a Degree in Liberal Arts and History in San Clemente, CA with 6.2%.
What is the Percentage of Population with a Degree in Liberal Arts and History in San Clemente, CA?
Percentage of Population with a Degree in Liberal Arts and History in San Clemente is 5.5%.
What is the Percentage of Population with a Degree in Liberal Arts and History in California?
Percentage of Population with a Degree in Liberal Arts and History in California is 5.5%.
What is the Percentage of Population with a Degree in Liberal Arts and History in the United States?
Percentage of Population with a Degree in Liberal Arts and History in the United States is 4.9%.