Cities with the Highest Percentage of Population with a Degree in Liberal Arts and History in Utah
RELATED REPORTS & OPTIONS
Liberal Arts and History
Utah
Compare Cities
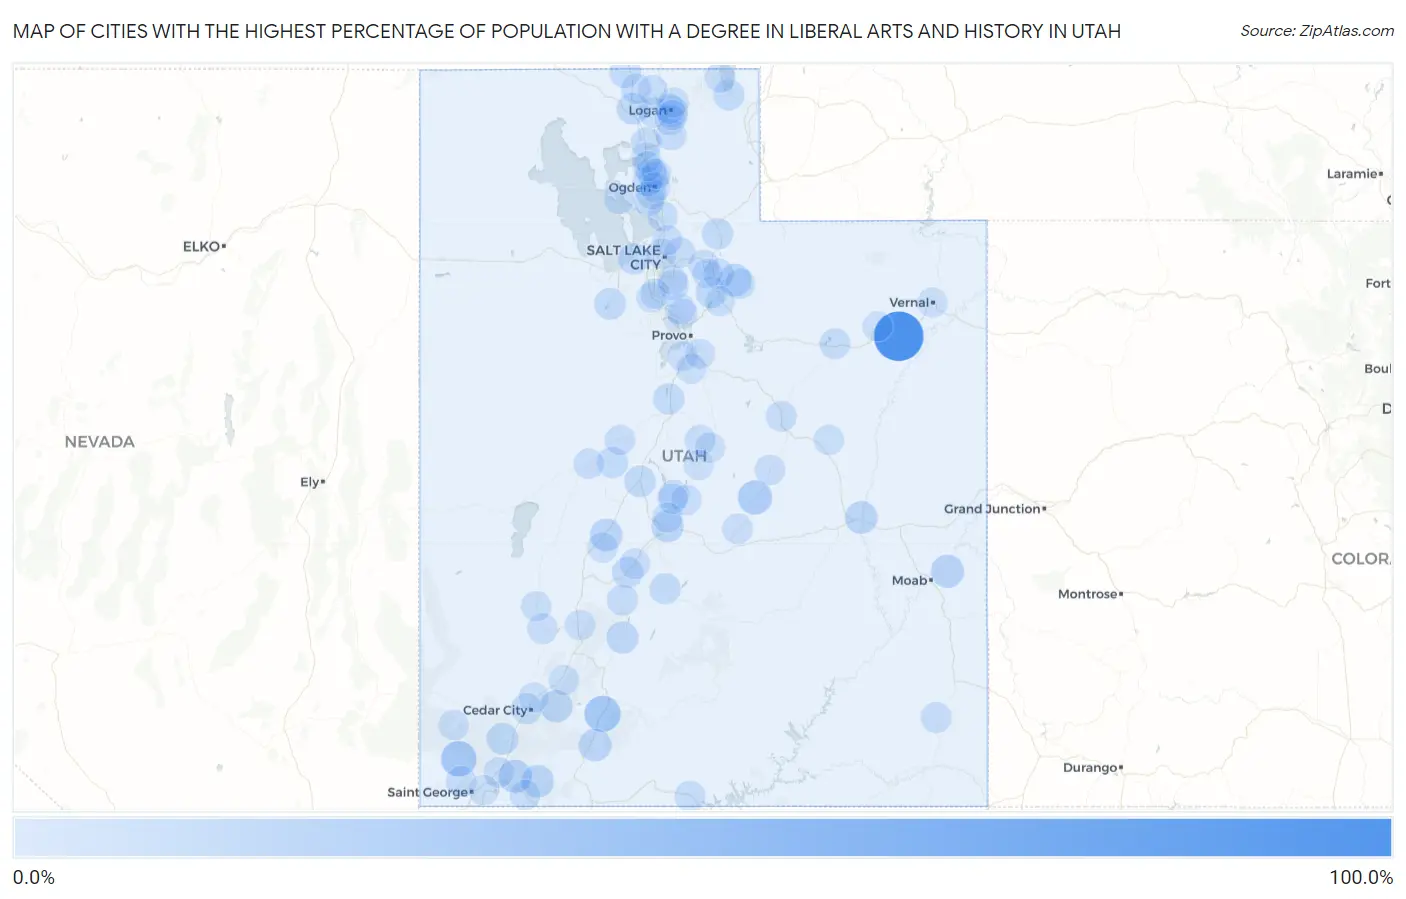
Map of Cities with the Highest Percentage of Population with a Degree in Liberal Arts and History in Utah
0.0%
100.0%
Cities with the Highest Percentage of Population with a Degree in Liberal Arts and History in Utah
| City | % Graduates | vs State | vs National | |
| 1. | Randlett | 100.0% | 3.3%(+96.7)#1 | 4.9%(+95.1)#70 |
| 2. | Hatch | 31.6% | 3.3%(+28.3)#2 | 4.9%(+26.7)#607 |
| 3. | Veyo | 29.2% | 3.3%(+25.9)#3 | 4.9%(+24.4)#688 |
| 4. | Brighton | 24.2% | 3.3%(+20.9)#4 | 4.9%(+19.3)#953 |
| 5. | Clawson | 22.2% | 3.3%(+18.9)#5 | 4.9%(+17.4)#1,099 |
| 6. | Virgin | 17.8% | 3.3%(+14.5)#6 | 4.9%(+12.9)#1,545 |
| 7. | Castle Valley | 17.1% | 3.3%(+13.8)#7 | 4.9%(+12.3)#1,635 |
| 8. | Springdale | 15.6% | 3.3%(+12.2)#8 | 4.9%(+10.7)#1,933 |
| 9. | Green River | 15.4% | 3.3%(+12.1)#9 | 4.9%(+10.5)#1,966 |
| 10. | Alton | 15.4% | 3.3%(+12.1)#10 | 4.9%(+10.5)#1,976 |
| 11. | Meadow | 15.4% | 3.3%(+12.1)#11 | 4.9%(+10.5)#1,983 |
| 12. | Francis | 15.4% | 3.3%(+12.0)#12 | 4.9%(+10.5)#1,993 |
| 13. | Salina | 13.8% | 3.3%(+10.5)#13 | 4.9%(+8.95)#2,353 |
| 14. | Brian Head | 13.6% | 3.3%(+10.3)#14 | 4.9%(+8.76)#2,429 |
| 15. | Circleville | 12.4% | 3.3%(+9.04)#15 | 4.9%(+7.49)#2,834 |
| 16. | Garland | 11.3% | 3.3%(+7.95)#16 | 4.9%(+6.40)#3,277 |
| 17. | New Harmony | 11.1% | 3.3%(+7.79)#17 | 4.9%(+6.24)#3,363 |
| 18. | Stockton | 10.8% | 3.3%(+7.49)#18 | 4.9%(+5.94)#3,529 |
| 19. | Scipio | 10.2% | 3.3%(+6.85)#19 | 4.9%(+5.30)#3,884 |
| 20. | Sunset | 10.0% | 3.3%(+6.73)#20 | 4.9%(+5.17)#3,951 |
| 21. | Midway | 9.4% | 3.3%(+6.04)#21 | 4.9%(+4.49)#4,433 |
| 22. | Mona | 9.3% | 3.3%(+5.93)#22 | 4.9%(+4.38)#4,513 |
| 23. | Coalville | 8.6% | 3.3%(+5.29)#23 | 4.9%(+3.74)#5,050 |
| 24. | Magna | 8.6% | 3.3%(+5.28)#24 | 4.9%(+3.73)#5,061 |
| 25. | Koosharem | 8.3% | 3.3%(+5.02)#25 | 4.9%(+3.46)#5,314 |
| 26. | Portage | 8.3% | 3.3%(+5.02)#26 | 4.9%(+3.46)#5,324 |
| 27. | Oak City | 8.2% | 3.3%(+4.89)#27 | 4.9%(+3.34)#5,449 |
| 28. | Joseph | 8.0% | 3.3%(+4.68)#28 | 4.9%(+3.13)#5,657 |
| 29. | Laketown | 7.8% | 3.3%(+4.53)#29 | 4.9%(+2.97)#5,822 |
| 30. | Marysvale | 7.5% | 3.3%(+4.23)#30 | 4.9%(+2.68)#6,170 |
| 31. | Duchesne | 7.4% | 3.3%(+4.04)#31 | 4.9%(+2.48)#6,389 |
| 32. | Cedar City | 7.0% | 3.3%(+3.67)#32 | 4.9%(+2.12)#6,897 |
| 33. | Paradise | 6.9% | 3.3%(+3.63)#33 | 4.9%(+2.08)#6,941 |
| 34. | Blanding | 6.9% | 3.3%(+3.56)#34 | 4.9%(+2.00)#7,058 |
| 35. | Helper | 6.8% | 3.3%(+3.46)#35 | 4.9%(+1.90)#7,190 |
| 36. | Big Water | 6.7% | 3.3%(+3.35)#36 | 4.9%(+1.79)#7,338 |
| 37. | Ivins | 6.5% | 3.3%(+3.17)#37 | 4.9%(+1.62)#7,600 |
| 38. | Brigham City | 6.4% | 3.3%(+3.10)#38 | 4.9%(+1.55)#7,710 |
| 39. | Woodland | 6.4% | 3.3%(+3.08)#39 | 4.9%(+1.53)#7,745 |
| 40. | River Heights | 6.4% | 3.3%(+3.05)#40 | 4.9%(+1.49)#7,795 |
| 41. | Emigration Canyon | 6.3% | 3.3%(+2.94)#41 | 4.9%(+1.39)#7,948 |
| 42. | Harrisville | 6.1% | 3.3%(+2.78)#42 | 4.9%(+1.23)#8,215 |
| 43. | Pleasant View | 6.0% | 3.3%(+2.72)#43 | 4.9%(+1.17)#8,327 |
| 44. | Minersville | 6.0% | 3.3%(+2.71)#44 | 4.9%(+1.15)#8,356 |
| 45. | Plymouth | 6.0% | 3.3%(+2.68)#45 | 4.9%(+1.13)#8,401 |
| 46. | Gunnison | 6.0% | 3.3%(+2.65)#46 | 4.9%(+1.10)#8,446 |
| 47. | Moroni | 6.0% | 3.3%(+2.63)#47 | 4.9%(+1.08)#8,474 |
| 48. | Snyderville | 5.9% | 3.3%(+2.61)#48 | 4.9%(+1.05)#8,529 |
| 49. | Huntington | 5.9% | 3.3%(+2.60)#49 | 4.9%(+1.05)#8,534 |
| 50. | Cedar Hills | 5.9% | 3.3%(+2.54)#50 | 4.9%(+0.981)#8,680 |
| 51. | Mendon | 5.8% | 3.3%(+2.52)#51 | 4.9%(+0.971)#8,697 |
| 52. | Delta | 5.8% | 3.3%(+2.44)#52 | 4.9%(+0.881)#8,863 |
| 53. | Mayfield | 5.7% | 3.3%(+2.40)#53 | 4.9%(+0.842)#8,942 |
| 54. | Emery | 5.7% | 3.3%(+2.40)#54 | 4.9%(+0.842)#8,946 |
| 55. | Granite | 5.6% | 3.3%(+2.32)#55 | 4.9%(+0.770)#9,080 |
| 56. | Elsinore | 5.6% | 3.3%(+2.30)#56 | 4.9%(+0.746)#9,133 |
| 57. | Centerfield | 5.5% | 3.3%(+2.20)#57 | 4.9%(+0.645)#9,336 |
| 58. | Hideout | 5.4% | 3.3%(+2.12)#58 | 4.9%(+0.570)#9,482 |
| 59. | Leeds | 5.4% | 3.3%(+2.06)#59 | 4.9%(+0.504)#9,601 |
| 60. | Riverdale | 5.3% | 3.3%(+2.00)#60 | 4.9%(+0.444)#9,733 |
| 61. | Nibley | 5.3% | 3.3%(+1.96)#61 | 4.9%(+0.401)#9,797 |
| 62. | Beaver | 5.3% | 3.3%(+1.95)#62 | 4.9%(+0.391)#9,812 |
| 63. | Marriott Slaterville | 5.2% | 3.3%(+1.91)#63 | 4.9%(+0.354)#9,936 |
| 64. | Apple Valley | 5.0% | 3.3%(+1.72)#64 | 4.9%(+0.170)#10,315 |
| 65. | Enterprise | 5.0% | 3.3%(+1.72)#65 | 4.9%(+0.164)#10,324 |
| 66. | Garden City | 5.0% | 3.3%(+1.64)#66 | 4.9%(+0.087)#10,500 |
| 67. | Salt Lake City | 4.9% | 3.3%(+1.56)#67 | 4.9%(+0.006)#10,682 |
| 68. | Paragonah | 4.9% | 3.3%(+1.56)#68 | 4.9%(+0.006)#10,697 |
| 69. | Hooper | 4.8% | 3.3%(+1.48)#69 | 4.9%(-0.073)#10,879 |
| 70. | Leamington | 4.7% | 3.3%(+1.37)#70 | 4.9%(-0.185)#11,153 |
| 71. | Ogden | 4.7% | 3.3%(+1.37)#71 | 4.9%(-0.186)#11,156 |
| 72. | East Carbon | 4.6% | 3.3%(+1.30)#72 | 4.9%(-0.257)#11,315 |
| 73. | Fruit Heights | 4.5% | 3.3%(+1.19)#73 | 4.9%(-0.363)#11,533 |
| 74. | Milford | 4.5% | 3.3%(+1.19)#74 | 4.9%(-0.364)#11,535 |
| 75. | Kanosh | 4.4% | 3.3%(+1.13)#75 | 4.9%(-0.428)#11,682 |
| 76. | North Logan | 4.4% | 3.3%(+1.08)#76 | 4.9%(-0.471)#11,786 |
| 77. | Spring City | 4.4% | 3.3%(+1.05)#77 | 4.9%(-0.509)#11,871 |
| 78. | White | 4.3% | 3.3%(+1.01)#78 | 4.9%(-0.548)#11,988 |
| 79. | Benjamin | 4.3% | 3.3%(+0.999)#79 | 4.9%(-0.556)#12,007 |
| 80. | Washington | 4.3% | 3.3%(+0.994)#80 | 4.9%(-0.560)#12,014 |
| 81. | Enoch | 4.3% | 3.3%(+0.959)#81 | 4.9%(-0.596)#12,087 |
| 82. | Ephraim | 4.2% | 3.3%(+0.888)#82 | 4.9%(-0.666)#12,254 |
| 83. | Woodland Hills | 4.2% | 3.3%(+0.878)#83 | 4.9%(-0.676)#12,275 |
| 84. | Logan | 4.1% | 3.3%(+0.812)#84 | 4.9%(-0.743)#12,459 |
| 85. | Park City | 4.0% | 3.3%(+0.714)#85 | 4.9%(-0.840)#12,660 |
| 86. | Vernal | 4.0% | 3.3%(+0.687)#86 | 4.9%(-0.868)#12,709 |
| 87. | Redmond | 4.0% | 3.3%(+0.682)#87 | 4.9%(-0.872)#12,727 |
| 88. | Pleasant Grove | 4.0% | 3.3%(+0.679)#88 | 4.9%(-0.876)#12,751 |
| 89. | Roosevelt | 4.0% | 3.3%(+0.652)#89 | 4.9%(-0.902)#12,790 |
| 90. | Mapleton | 3.9% | 3.3%(+0.563)#90 | 4.9%(-0.992)#13,014 |
| 91. | Willard | 3.8% | 3.3%(+0.499)#91 | 4.9%(-1.06)#13,176 |
| 92. | Providence | 3.8% | 3.3%(+0.483)#92 | 4.9%(-1.07)#13,215 |
| 93. | Newton | 3.8% | 3.3%(+0.470)#93 | 4.9%(-1.08)#13,250 |
| 94. | Daniel | 3.8% | 3.3%(+0.456)#94 | 4.9%(-1.10)#13,279 |
| 95. | South Willard | 3.8% | 3.3%(+0.447)#95 | 4.9%(-1.11)#13,304 |
| 96. | Bountiful | 3.8% | 3.3%(+0.442)#96 | 4.9%(-1.11)#13,315 |
| 97. | Herriman | 3.7% | 3.3%(+0.427)#97 | 4.9%(-1.13)#13,348 |
| 98. | Cottonwood Heights | 3.7% | 3.3%(+0.391)#98 | 4.9%(-1.16)#13,420 |
| 99. | Riverton | 3.7% | 3.3%(+0.388)#99 | 4.9%(-1.17)#13,424 |
| 100. | North Ogden | 3.7% | 3.3%(+0.380)#100 | 4.9%(-1.17)#13,482 |
Common Questions
What are the Top 10 Cities with the Highest Percentage of Population with a Degree in Liberal Arts and History in Utah?
Top 10 Cities with the Highest Percentage of Population with a Degree in Liberal Arts and History in Utah are:
#1
100.0%
#2
31.6%
#3
29.2%
#4
22.2%
#5
17.8%
#6
17.1%
#7
15.6%
#8
15.4%
#9
15.4%
#10
15.4%
What city has the Highest Percentage of Population with a Degree in Liberal Arts and History in Utah?
Randlett has the Highest Percentage of Population with a Degree in Liberal Arts and History in Utah with 100.0%.
What is the Percentage of Population with a Degree in Liberal Arts and History in the State of Utah?
Percentage of Population with a Degree in Liberal Arts and History in Utah is 3.3%.
What is the Percentage of Population with a Degree in Liberal Arts and History in the United States?
Percentage of Population with a Degree in Liberal Arts and History in the United States is 4.9%.